1. www.SolarMonitor.org
Figure 1 –
Magnified image of the active
region 12134 as seen from SDO/
AIA 193 Å
Active Regions, Sunspots and Flares
The surface of the Sun is not quiescent and uniform but is in fact dotted with Active
Regions (AR) - Fig. 1. An active region is a region of the sun with very strong
magnetic fields. These fields can prevent the normal convective processes on the
solar surface leading to regions with lower than average temperatures. These
features are called Sunspots. These sunspot systems can be very complex and
sometimes the AR associated with them can give rise to events called Solar
Flares. A solar flare is a sudden release of magnetic energy (1025 J) in the form of
a broad spectrum of electromagnetic radiation (Gamma rays to Radio waves).
Flares are classified into a A, B, C, M, X scale based off the peak flux of X-rays
produced by the flare. X-class flares are the most energetic.
Flare Forecasting
Solar Monitor offers its own
Flare Prediction System, using
a combination of TCD’s
Poisson-based model1,2 and
NOAA’s (National Oceanic
And Atmospheric
Administration) Space Weather
Prediction Center data.
Active Regions are given,
along with their percentage
probability of producing C-,M-
or X-Class events in the
following 24 hour period.
These percentage probabilities
are based on the number of
flares produced by regions,
classified using the McIntosh
Classification Scheme3, during
the 21st and 22nd solar cycle.
This data was used to
calculate the average number
of events expected (μ) in a
given time interval. Thus an
equation for calculating flare
probability (Pμ) in a 24 hour
period can be given as follows:
1. Gallagher, P. T., Moon, Y. -J., Wang, H.,
Solar Physics, 209, 171, (2002).
2. Bloomfield et al., 2012, The
Astrophysical Journal Letters, 747,
L41
3. McIntosh, P., 1990, Solar Physics, 125,
251
4. http://www.idlcoyote.com , David W
Fanning.
Pμ(N≥1) = 1 – e-μ
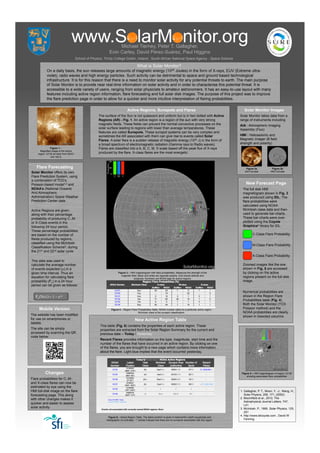
New Forecast Page
The full disk HMI
magnetogram shown in Fig. 3
was produced using IDL. The
flare probabilities were
calculated using NOAA
McIntosh class data and then
used to generate bar-charts.
These bar-charts were over-
plotted using the Coyote
Graphics4 library for IDL.
Zoomed images like the one
shown in Fig. 5 are accessed
by clicking on the active
regions present on the full disk
image.
Numerical probabilities are
shown in the Region Flare
Probabilities table (Fig. 4).
Both the Solar Monitor (TCD
Poisson method) and the
NOAA probabilities are clearly
shown in bisected columns.
.
What is Solar Monitor?
On a daily basis, the sun releases large amounts of magnetic energy (1025 Joules) in the form of X-rays, EUV (Extreme ultra-
violet), radio waves and high energy particles. Such activity can be detrimental to space and ground based technological
infrastructure. It is for this reason that there is a need to monitor solar activity for any potential threats to earth. The main purpose
of Solar Monitor is to provide near real-time information on solar activity and in order to characterise this potential threat. It is
accessible to a wide variety of users, ranging from solar physicists to amateur astronomers. It has an easy-to-use layout with many
features including active region information, flare forecasting and full solar disk images. The purpose of this project was to improve
the flare prediction page in order to allow for a quicker and more intuitive interpretation of flaring probabilities.
New Active Region Table
This table (Fig. 6) contains the properties of each active region. These
properties are extracted from the Solar Region Summary for the current and
previous date – Today / Yesterday
Recent Flares provides information on the type, magnitude, start time and the
number of the flares that have occurred in an active region. By clicking on one
of the flares, you are brought to a new page which contains more information
about the flare. Light blue implies that the event occurred yesterday.
Mobile Version
The website has been modified
for use on smartphones or
tablets.
The site can be simply
accessed by scanning the QR
code below:
Michael Tierney, Peter T. Gallagher,
Eoin Carley, David Pérez-Suárez, Paul Higgins
Figure 3 – HMI magnetogram with flare probabilities. Measures the strength of the
magnetic field. Black and white are opposite polarity. Grid shows latitude and
longitude. Numbers are NOAA tags for active regions.
X-Class Flare Probability
C-Class Flare Probability
M-Class Flare Probability
Figure 4 – Region Flare Probabilities Table. NOAA number refers to a particular active region.
McIntosh class is the sunspot classification.
Figure 5 – HMI magnetogram of region 12135
showing associated flare probabilities
Solar Monitor Images
Solar Monitor takes data from a
range of instruments including
AIA : Atmospheric Imaging
Assembly (Flux)
HMI : Helioseismic and
Magnetic Imager (B field
strength and polarity)
Figure 2b
HMI Full-disk
Figure 2a
AIA Full-disk
Changes
Flare probabilities for C-,M-
and X-class flares can now be
estimated by eye using the
HMI full-disk image on the flare
forecasting page. This along
with other changes makes it
quicker and easier to assess
solar activity.
Figure 6 – Active Region Table. The latest position is given in heliocentric (earth equatorial) and
heliographic co-ordinates. “/” entries indicate that there are no sunspots associated with the region.
School of Physics, Trinity College Dublin, Ireland , South African National Space Agency - Space Science