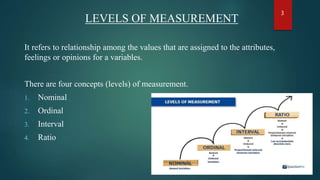
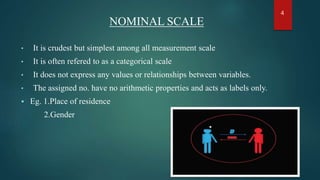
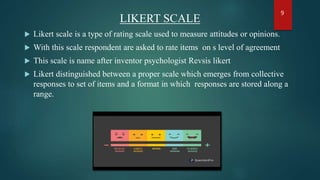
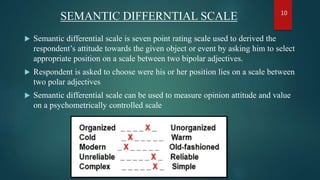
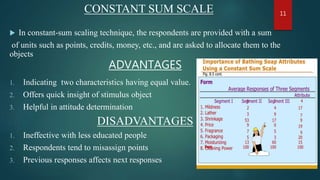
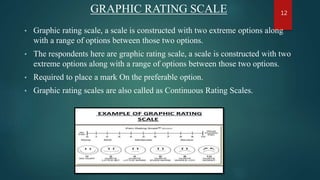
BUSINESS RESEARCH METHODS
Title : MEASUREMENT AND DATA COLLECTION
1
• Piyush salve
• Divyanshu pandey
• Tanvi Katkade
• Manali Gaikwad
• Rutvik Dandawate
• Ronak Purohit
• Ayush Dwivedi
• Anurag Sontakke
• Samiksha khandeshwar
PROJECT PRESENTED BY 2
LEVELS OF MEASUREMENT
It refers to relationship among the values that are assigned to the attributes,
feelings or opinions for a variables.
There are four concepts (levels) of measurement.
1. Nominal
2. Ordinal
3. Interval
4. Ratio
3
NOMINAL SCALE
• It is crudest but simplest among all measurement scale
• It is often refered to as a categorical scale
• It does not express any values or relationships between variables.
• The assigned no. have no arithmetic properties and acts as labels only.
 Eg. 1.Place of residence
2.Gender
4
ORDINAL SCALE
 Ordinal data is a categorical, statistical data type where the variables have
natural, ordered categories.
 This level of measurement depicts some ordered relationship among the
variable’s observations.
5
INTERVAL SCALE
 The third level of measurement is the interval
level of measurement.
 Scale with the values ,and there is same
numerical distance between each value.
 This scale has an arbitrary zero point.
 Eg. 0-10,10-20,Tempreture,etc
6
RATIO SCALE
 The fourth level of measurement is the ratio
level of measurement.
 Scales with the scores where there is same
distance between each score
 The scale has true, meaningful zero point that
anchors the scale
 The only scale that allows to make ratio
comparisons
 Eg -
7
ATTITUDE SCALING TECHNIQUES
 A measure of an selective quantity of an attitude possessed by an
individuals concentrated with a reference group
 Attitude is a resultant of external and internal factors
 Depending upon attitude to be measure appropriate scales are
designed
 Scaling is technique used for measuring quantitative responses of
respondent such as those related to their
feelings,perseptions,like-dislikes taste and preference
8
LIKERT SCALE
 Likert scale is a type of rating scale used to measure attitudes or opinions.
 With this scale respondent are asked to rate items on s level of agreement
 This scale is name after inventor psychologist Revsis likert
 Likert distinguished between a proper scale which emerges from collective
responses to set of items and a format in which responses are stored along a
range.
9
SEMANTIC DIFFERNTIAL SCALE
 Semantic differential scale is seven point rating scale used to derived the
respondent’s attitude towards the given object or event by asking him to select
appropriate position on a scale between two bipolar adjectives.
 Respondent is asked to choose were his or her position lies on a scale between
two polar adjectives
 Semantic differential scale can be used to measure opinion attitude and value
on a psychometrically controlled scale
10
CONSTANT SUM SCALE
 In constant-sum scaling technique, the respondents are provided with a sum
of units such as points, credits, money, etc., and are asked to allocate them to the
objects
ADVANTAGES
1. Indicating two characteristics having equal value.
2. Offers quick insight of stimulus object
3. Helpful in attitude determination
DISADVANTAGES
1. Ineffective with less educated people
2. Respondents tend to misassign points
3. Previous responses affects next responses
11
GRAPHIC RATING SCALE
• Graphic rating scale, a scale is constructed with two extreme options along
with a range of options between those two options.
• The respondents here are graphic rating scale, a scale is constructed with two
extreme options along with a range of options between those two options.
• Required to place a mark On the preferable option.
• Graphic rating scales are also called as Continuous Rating Scales.
12
ADVANTAGES
 Quick to develop.
 Result or responses can compared quantitatively
 Cost effective and easy to operate
DISADVANTAGES
 Graphic scales are used differently by different supervisors.
 Scales are ambiguous or vague
 Validity of the scales is suspected
13
PAIRED COMPARISION
 In this method respondent can express his attitude by making choice between
two objects.
 Paired Comparison Method is a handy tool for decision making
 it describes object’s values and compares them to each other.
 Note:-It's often difficult to choose the best option when you have different
ones that are far apart.
14
FORCE RANKING SCALE
• Forced ranking, also known as a vitality curve.
• It is a controversial management tool which measures, ranks and grades
employees' work performance based on their comparison with each other
instead of against fixed standards.
• It is a controversial workforce management tool used to evaluate employees
15
TYPES OF DATA
There are two types of data :-
1. Primary data
2. Secondary data
16
SECONDARY DATA
 DEFINATION:-
I. Secondary data refers to data that is collected by someone other
than the user.
II. It is the data that is being reused. Usually in different context.
III. Eg . Data from book
 SOURCE OF DATA
1. internal sources
2. External sources
17
CHARECTERSTICS
1. Insight into total situation
2. Supplementary information
3. Cost, time and effort saving
4. Helpful in hypothesis formulation
5. Helpful in testing the hypothesis
18
ISSUES TO BE CONSIDER
• Concerns about secondary use of data mostly revolve around potential harm
to individual subjects and issue of return for consent. Secondary data vary in
terms of the amount of identifying information in it.
• If the data has no identifying information or is completely devoid of such
information or is appropriately coded so that the researcher does not have
access to the codes, then it does not require a full review by the ethical board.
• The researcher will then have to explain why is it unavoidable to have
identifying information to answer the research question and must also indicate
how participants' privacy and the confidentiality of the data will be protected.
• If the above said concerns are satisfactorily addressed, the researcher can then
request fora waiver of consent.
19
SUFFICENCY
The data is considered inadequate if the level of accuracy achieved in data is found
inadequate or if they are related to an area which may be either narrower or wider
than the area of the present enquiry.
ADEQUACY
• If the present problem of the researcher is not answered by the data then it
should be considered as inadequate and should be refrained from using by
the researcher.
• The data will not be considered sufficient if the scope of the researcher is
narrower or wider than the secondary data that is collected.
• befit would be very risky to use the data if it simply matches some part of
the query posed by there searcher because of chances of error in the present
research increasing drastically
20
RELIABILITY
 Background work needed for research is already been carried out
such as, case studies
 Data may have been used in published texts and statistics is
elasewhere,and data could already be promoted in media or bring
in useful
 Secondary data genrally have pre-established degree of validity
and reliability which need not be re-examined by researcher
 Secondary data is key in the concept of data enrichment
21
CONSISTANCY
• Secondary data are market research data collected for a purpose other than
the one on hand.
• The data have the advantage of being much less expensive and more quickly
available than primary data.
• However, because secondary data are collected for a different purpose, one
must carefully evaluate their appropriateness for a given market research
situation.
• Secondary data should be evaluated with respect to several important criteria.
• The data should be accurate, that is, without errors. The data should be
relevant to the particular research need on hand.
22
PRIMARY DATA
 DEFINITION:-
• Primary data are information collected by a researcher
specifically for a research assignment.
• Primary data has not published yet, it is more reliable,
authentic and objective
• Primary data are original in nature and are directly
related to the issue or problem and current data.
• Primary data can collected through various methods like
interviews,surveys, questionnaires, etc.
23
ADVANTAGES
• Original and relevant to topic so accuracy is quite
high
• It can collected from lots of ways across the
world
• primary data is current and it can better give a
realistic view
• Reliability of primary data is very high
24
DISADVANTAGES
• High cost
• Time consuming
• Iaccurate feedbacks
• More numbers of recourses are requred
25

measurement scaling and data collection BBA

  • 1.
    BUSINESS RESEARCH METHODS Title: MEASUREMENT AND DATA COLLECTION 1
  • 2.
    • Piyush salve •Divyanshu pandey • Tanvi Katkade • Manali Gaikwad • Rutvik Dandawate • Ronak Purohit • Ayush Dwivedi • Anurag Sontakke • Samiksha khandeshwar PROJECT PRESENTED BY 2
  • 3.
    LEVELS OF MEASUREMENT Itrefers to relationship among the values that are assigned to the attributes, feelings or opinions for a variables. There are four concepts (levels) of measurement. 1. Nominal 2. Ordinal 3. Interval 4. Ratio 3
  • 4.
    NOMINAL SCALE • Itis crudest but simplest among all measurement scale • It is often refered to as a categorical scale • It does not express any values or relationships between variables. • The assigned no. have no arithmetic properties and acts as labels only.  Eg. 1.Place of residence 2.Gender 4
  • 5.
    ORDINAL SCALE  Ordinaldata is a categorical, statistical data type where the variables have natural, ordered categories.  This level of measurement depicts some ordered relationship among the variable’s observations. 5
  • 6.
    INTERVAL SCALE  Thethird level of measurement is the interval level of measurement.  Scale with the values ,and there is same numerical distance between each value.  This scale has an arbitrary zero point.  Eg. 0-10,10-20,Tempreture,etc 6
  • 7.
    RATIO SCALE  Thefourth level of measurement is the ratio level of measurement.  Scales with the scores where there is same distance between each score  The scale has true, meaningful zero point that anchors the scale  The only scale that allows to make ratio comparisons  Eg - 7
  • 8.
    ATTITUDE SCALING TECHNIQUES A measure of an selective quantity of an attitude possessed by an individuals concentrated with a reference group  Attitude is a resultant of external and internal factors  Depending upon attitude to be measure appropriate scales are designed  Scaling is technique used for measuring quantitative responses of respondent such as those related to their feelings,perseptions,like-dislikes taste and preference 8
  • 9.
    LIKERT SCALE  Likertscale is a type of rating scale used to measure attitudes or opinions.  With this scale respondent are asked to rate items on s level of agreement  This scale is name after inventor psychologist Revsis likert  Likert distinguished between a proper scale which emerges from collective responses to set of items and a format in which responses are stored along a range. 9
  • 10.
    SEMANTIC DIFFERNTIAL SCALE Semantic differential scale is seven point rating scale used to derived the respondent’s attitude towards the given object or event by asking him to select appropriate position on a scale between two bipolar adjectives.  Respondent is asked to choose were his or her position lies on a scale between two polar adjectives  Semantic differential scale can be used to measure opinion attitude and value on a psychometrically controlled scale 10
  • 11.
    CONSTANT SUM SCALE In constant-sum scaling technique, the respondents are provided with a sum of units such as points, credits, money, etc., and are asked to allocate them to the objects ADVANTAGES 1. Indicating two characteristics having equal value. 2. Offers quick insight of stimulus object 3. Helpful in attitude determination DISADVANTAGES 1. Ineffective with less educated people 2. Respondents tend to misassign points 3. Previous responses affects next responses 11
  • 12.
    GRAPHIC RATING SCALE •Graphic rating scale, a scale is constructed with two extreme options along with a range of options between those two options. • The respondents here are graphic rating scale, a scale is constructed with two extreme options along with a range of options between those two options. • Required to place a mark On the preferable option. • Graphic rating scales are also called as Continuous Rating Scales. 12
  • 13.
    ADVANTAGES  Quick todevelop.  Result or responses can compared quantitatively  Cost effective and easy to operate DISADVANTAGES  Graphic scales are used differently by different supervisors.  Scales are ambiguous or vague  Validity of the scales is suspected 13
  • 14.
    PAIRED COMPARISION  Inthis method respondent can express his attitude by making choice between two objects.  Paired Comparison Method is a handy tool for decision making  it describes object’s values and compares them to each other.  Note:-It's often difficult to choose the best option when you have different ones that are far apart. 14
  • 15.
    FORCE RANKING SCALE •Forced ranking, also known as a vitality curve. • It is a controversial management tool which measures, ranks and grades employees' work performance based on their comparison with each other instead of against fixed standards. • It is a controversial workforce management tool used to evaluate employees 15
  • 16.
    TYPES OF DATA Thereare two types of data :- 1. Primary data 2. Secondary data 16
  • 17.
    SECONDARY DATA  DEFINATION:- I.Secondary data refers to data that is collected by someone other than the user. II. It is the data that is being reused. Usually in different context. III. Eg . Data from book  SOURCE OF DATA 1. internal sources 2. External sources 17
  • 18.
    CHARECTERSTICS 1. Insight intototal situation 2. Supplementary information 3. Cost, time and effort saving 4. Helpful in hypothesis formulation 5. Helpful in testing the hypothesis 18
  • 19.
    ISSUES TO BECONSIDER • Concerns about secondary use of data mostly revolve around potential harm to individual subjects and issue of return for consent. Secondary data vary in terms of the amount of identifying information in it. • If the data has no identifying information or is completely devoid of such information or is appropriately coded so that the researcher does not have access to the codes, then it does not require a full review by the ethical board. • The researcher will then have to explain why is it unavoidable to have identifying information to answer the research question and must also indicate how participants' privacy and the confidentiality of the data will be protected. • If the above said concerns are satisfactorily addressed, the researcher can then request fora waiver of consent. 19
  • 20.
    SUFFICENCY The data isconsidered inadequate if the level of accuracy achieved in data is found inadequate or if they are related to an area which may be either narrower or wider than the area of the present enquiry. ADEQUACY • If the present problem of the researcher is not answered by the data then it should be considered as inadequate and should be refrained from using by the researcher. • The data will not be considered sufficient if the scope of the researcher is narrower or wider than the secondary data that is collected. • befit would be very risky to use the data if it simply matches some part of the query posed by there searcher because of chances of error in the present research increasing drastically 20
  • 21.
    RELIABILITY  Background workneeded for research is already been carried out such as, case studies  Data may have been used in published texts and statistics is elasewhere,and data could already be promoted in media or bring in useful  Secondary data genrally have pre-established degree of validity and reliability which need not be re-examined by researcher  Secondary data is key in the concept of data enrichment 21
  • 22.
    CONSISTANCY • Secondary dataare market research data collected for a purpose other than the one on hand. • The data have the advantage of being much less expensive and more quickly available than primary data. • However, because secondary data are collected for a different purpose, one must carefully evaluate their appropriateness for a given market research situation. • Secondary data should be evaluated with respect to several important criteria. • The data should be accurate, that is, without errors. The data should be relevant to the particular research need on hand. 22
  • 23.
    PRIMARY DATA  DEFINITION:- •Primary data are information collected by a researcher specifically for a research assignment. • Primary data has not published yet, it is more reliable, authentic and objective • Primary data are original in nature and are directly related to the issue or problem and current data. • Primary data can collected through various methods like interviews,surveys, questionnaires, etc. 23
  • 24.
    ADVANTAGES • Original andrelevant to topic so accuracy is quite high • It can collected from lots of ways across the world • primary data is current and it can better give a realistic view • Reliability of primary data is very high 24
  • 25.
    DISADVANTAGES • High cost •Time consuming • Iaccurate feedbacks • More numbers of recourses are requred 25