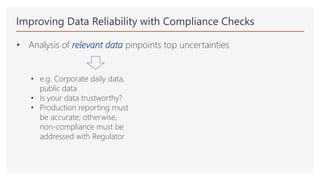
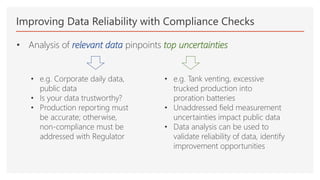
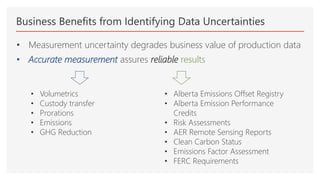
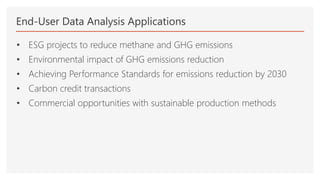
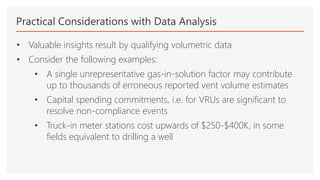
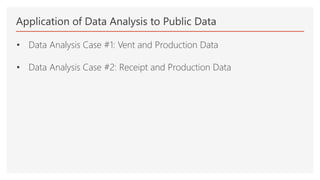
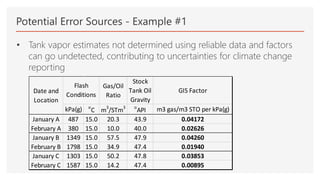
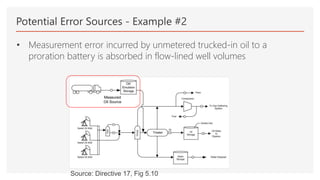
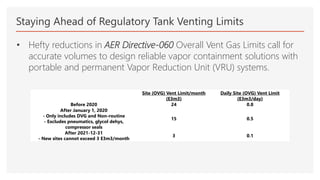
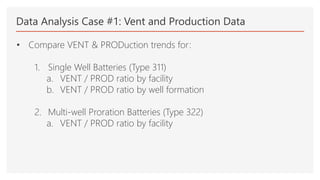
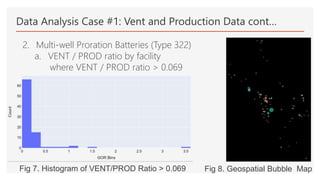
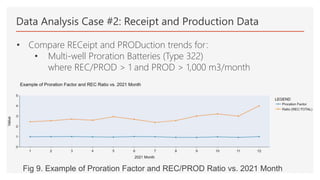
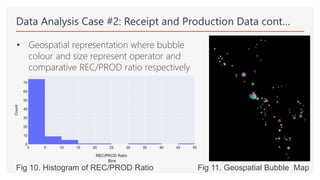
Measurement & Reporting Data Analysis for
Compliance
Canadian Digital Oilfields Conference – May 18, 2022
Agenda
• Introduction
• The case for compliance
• Why data matters to compliance
• Compliance, data and the bottom line
• Practical considerations w/ data analysis
• Identifying potential error sources before they become non-
compliance issues
• Discovering potential error sources through data analysis
• Conclusion
Getting Useful Results from Volumetric Data Analysis
Consider:
• What if you can’t tell whether publicly reported Vent or Trucked
volumes are realistic?
• You can’t manage what you can’t measure.
• There is a direct correlation between the accuracy of reported data
and its value.
Compliance Indicators through Data Analysis
Industry has a need for accuracy necessitates quick, useful assessment
techniques
• Analysis of relevant data pinpoints measurement and reporting
improvement opportunities
• Information displayed with visual indicators, i.e. bubble maps,
reveals outlier data excursions for facilities where regulatory limits
have been exceeded for:
• Reporting vent volume estimates
• Trucked oil receipt volumes into proration batteries
Improving Data Reliability with Compliance Checks
• Analysis of relevant data pinpoints top uncertainties
• e.g. Corporate daily data,
public data
• Is your data trustworthy?
• Production reporting must
be accurate; otherwise,
non-compliance must be
addressed with Regulator
Improving Data Reliability with Compliance Checks
• e.g. Corporate daily data,
public data
• Is your data trustworthy?
• Production reporting must
be accurate; otherwise,
non-compliance must be
addressed with Regulator
• Analysis of relevant data pinpoints top uncertainties
• e.g. Tank venting, excessive
trucked production into
proration batteries
• Unaddressed field measurement
uncertainties impact public data
• Data analysis can be used to
validate reliability of data, identify
improvement opportunities
Business Benefits from Identifying Data Uncertainties
• Measurement uncertainties degrade the business value of production
data
• Accurate measurement assures reliable results
Business Benefits from Identifying Data Uncertainties
• Measurement uncertainty degrades business value of production data
• Accurate measurement assures reliable results
• Volumetrics
• Custody transfer
• Prorations
• Emissions
• GHG Reduction
Business Benefits from Identifying Data Uncertainties
• Volumetrics
• Custody transfer
• Prorations
• Emissions
• GHG Reduction
• Measurement uncertainty degrades business value of production data
• Accurate measurement assures reliable results
• Alberta Emissions Offset Registry
• Alberta Emission Performance
Credits
• Risk Assessments
• AER Remote Sensing Reports
• Clean Carbon Status
• Emissions Factor Assessment
• FERC Requirements
End-User Data Analysis Applications
• ESG projects to reduce methane and GHG emissions
• Environmental impact of GHG emissions reduction
• Achieving Performance Standards for emissions reduction by 2030
• Carbon credit transactions
• Commercial opportunities with sustainable production methods
Practical Considerations with Data Analysis
• Valuable insights result by qualifying volumetric data
• Consider the following examples:
• A single unrepresentative gas-in-solution factor may contribute
up to thousands of erroneous reported vent volume estimates
• Capital spending commitments, i.e. for VRUs are significant to
resolve non-compliance events
• Truck-in meter stations cost upwards of $250-$400K, in some
fields equivalent to drilling a well
Application of Data Analysis to Public Data
• Data Analysis Case #1: Vent and Production Data
• Data Analysis Case #2: Receipt and Production Data
Potential Error Sources - Example #1
Gas/Oil
Ratio
Stock
Tank Oil
Gravity
GIS Factor
kPa(g) o
C m
3
/STm
3 o
API m3 gas/m3 STO per kPa(g)
January A 487 15.0 20.3 43.9 0.04172
February A 380 15.0 10.0 40.0 0.02626
January B 1349 15.0 57.5 47.9 0.04260
February B 1798 15.0 34.9 47.4 0.01940
January C 1303 15.0 50.2 47.8 0.03853
February C 1587 15.0 14.2 47.4 0.00895
Date and
Location
Flash
Conditions
• Tank vapor estimates not determined using reliable data and factors
can go undetected, contributing to uncertainties for climate change
reporting
Potential Error Sources - Example #2
• Measurement error incurred by unmetered trucked-in oil to a
proration battery is absorbed in flow-lined well volumes
Source: Directive 17, Fig 5.10
Staying Ahead of Regulatory Tank Venting Limits
• Hefty reductions in AER Directive-060 Overall Vent Gas Limits call for
accurate volumes to design reliable vapor containment solutions with
portable and permanent Vapor Reduction Unit (VRU) systems.
Site (OVG) Vent Limit/month
(E3m3)
Daily Site (OVG) Vent Limit
(E3m3/day)
Before 2020 24 0.8
After January 1, 2020
- Only includes DVG and Non-routine
- Excludes pneumatics, glycol dehys,
compressor seals
15 0.5
After 2021-12-31
- New sites cannot exceed 3 E3m3/month
3 0.1
Data Analysis Case #1: Vent and Production Data
• Compare VENT & PRODuction trends for:
1. Single Well Batteries (Type 311)
a. VENT / PROD ratio by facility
b. VENT / PROD ratio by well formation
2. Multi-well Proration Batteries (Type 322)
a. VENT / PROD ratio by facility
Data Analysis Case #1: Vent and Production Data cont…
1. Single Well Batteries (Type 311)
a. VENT / PROD ratio by facility
b. VENT / PROD ratio by well formation
Context:
• Where VENT / PROD is used as gas-to-oil ratio (GOR)
• GOR is expected to be 0.007 e3m3 gas / m3 oil
Data Analysis Case #1: Vent and Production Data cont…
1. Single Well Batteries (Type 311)
a. VENT / PROD ratio by facility
where VENT / PROD ratio > 0.069
Fig 1. Histogram of VENT/PROD Ratio > 0.069 Fig 2. Geospatial Bubble Map
Data Analysis Case #1: Vent and Production Data cont…
1. Single Well Batteries (Type 311)
a. VENT / PROD ratio by facility
where VENT / PROD ratio > 0.69
Fig 3. Histogram of VENT/PROD Ratio > 0.69 Fig 4. Geospatial Bubble Map
Data Analysis Case #1: Vent and Production Data cont…
1. Single Well Batteries (Type 311)
b. VENT / PROD ratio by well formation
Fig 5. List of GOR means by Formation Fig 6. Geospatial Bubble Map
Data Analysis Case #1: Vent and Production Data cont…
2. Multi-well Proration Batteries (Type 322)
a. VENT / PROD ratio by facility
where VENT / PROD ratio > 0.069
Fig 7. Histogram of VENT/PROD Ratio > 0.069 Fig 8. Geospatial Bubble Map
Data Analysis Case #2: Receipt and Production Data
• Compare RECeipt and PRODuction trends for:
• Multi-well Proration Batteries (Type 322)
where REC/PROD > 1 and PROD > 1,000 m3/month
Fig 9. Example of Proration Factor and REC/PROD Ratio vs. 2021 Month
Data Analysis Case #2: Receipt and Production Data cont…
• Geospatial representation where bubble
colour and size represent operator and
comparative REC/PROD ratio respectively
Fig 10. Histogram of REC/PROD Ratio Fig 11. Geospatial Bubble Map
Conclusions
Both digital data solutions offer useful methods for both producers and
regulators to identify accuracy improvement opportunities.

MEASUREMENT & REPORTING DATA ANALYSIS FOR COMPLIANCE

  • 1.
    Measurement & ReportingData Analysis for Compliance Canadian Digital Oilfields Conference – May 18, 2022
  • 2.
    Agenda • Introduction • Thecase for compliance • Why data matters to compliance • Compliance, data and the bottom line • Practical considerations w/ data analysis • Identifying potential error sources before they become non- compliance issues • Discovering potential error sources through data analysis • Conclusion
  • 3.
    Getting Useful Resultsfrom Volumetric Data Analysis Consider: • What if you can’t tell whether publicly reported Vent or Trucked volumes are realistic? • You can’t manage what you can’t measure. • There is a direct correlation between the accuracy of reported data and its value.
  • 4.
    Compliance Indicators throughData Analysis Industry has a need for accuracy necessitates quick, useful assessment techniques • Analysis of relevant data pinpoints measurement and reporting improvement opportunities • Information displayed with visual indicators, i.e. bubble maps, reveals outlier data excursions for facilities where regulatory limits have been exceeded for: • Reporting vent volume estimates • Trucked oil receipt volumes into proration batteries
  • 5.
    Improving Data Reliabilitywith Compliance Checks • Analysis of relevant data pinpoints top uncertainties • e.g. Corporate daily data, public data • Is your data trustworthy? • Production reporting must be accurate; otherwise, non-compliance must be addressed with Regulator
  • 6.
    Improving Data Reliabilitywith Compliance Checks • e.g. Corporate daily data, public data • Is your data trustworthy? • Production reporting must be accurate; otherwise, non-compliance must be addressed with Regulator • Analysis of relevant data pinpoints top uncertainties • e.g. Tank venting, excessive trucked production into proration batteries • Unaddressed field measurement uncertainties impact public data • Data analysis can be used to validate reliability of data, identify improvement opportunities
  • 7.
    Business Benefits fromIdentifying Data Uncertainties • Measurement uncertainties degrade the business value of production data • Accurate measurement assures reliable results
  • 8.
    Business Benefits fromIdentifying Data Uncertainties • Measurement uncertainty degrades business value of production data • Accurate measurement assures reliable results • Volumetrics • Custody transfer • Prorations • Emissions • GHG Reduction
  • 9.
    Business Benefits fromIdentifying Data Uncertainties • Volumetrics • Custody transfer • Prorations • Emissions • GHG Reduction • Measurement uncertainty degrades business value of production data • Accurate measurement assures reliable results • Alberta Emissions Offset Registry • Alberta Emission Performance Credits • Risk Assessments • AER Remote Sensing Reports • Clean Carbon Status • Emissions Factor Assessment • FERC Requirements
  • 10.
    End-User Data AnalysisApplications • ESG projects to reduce methane and GHG emissions • Environmental impact of GHG emissions reduction • Achieving Performance Standards for emissions reduction by 2030 • Carbon credit transactions • Commercial opportunities with sustainable production methods
  • 11.
    Practical Considerations withData Analysis • Valuable insights result by qualifying volumetric data • Consider the following examples: • A single unrepresentative gas-in-solution factor may contribute up to thousands of erroneous reported vent volume estimates • Capital spending commitments, i.e. for VRUs are significant to resolve non-compliance events • Truck-in meter stations cost upwards of $250-$400K, in some fields equivalent to drilling a well
  • 12.
    Application of DataAnalysis to Public Data • Data Analysis Case #1: Vent and Production Data • Data Analysis Case #2: Receipt and Production Data
  • 13.
    Potential Error Sources- Example #1 Gas/Oil Ratio Stock Tank Oil Gravity GIS Factor kPa(g) o C m 3 /STm 3 o API m3 gas/m3 STO per kPa(g) January A 487 15.0 20.3 43.9 0.04172 February A 380 15.0 10.0 40.0 0.02626 January B 1349 15.0 57.5 47.9 0.04260 February B 1798 15.0 34.9 47.4 0.01940 January C 1303 15.0 50.2 47.8 0.03853 February C 1587 15.0 14.2 47.4 0.00895 Date and Location Flash Conditions • Tank vapor estimates not determined using reliable data and factors can go undetected, contributing to uncertainties for climate change reporting
  • 14.
    Potential Error Sources- Example #2 • Measurement error incurred by unmetered trucked-in oil to a proration battery is absorbed in flow-lined well volumes Source: Directive 17, Fig 5.10
  • 15.
    Staying Ahead ofRegulatory Tank Venting Limits • Hefty reductions in AER Directive-060 Overall Vent Gas Limits call for accurate volumes to design reliable vapor containment solutions with portable and permanent Vapor Reduction Unit (VRU) systems. Site (OVG) Vent Limit/month (E3m3) Daily Site (OVG) Vent Limit (E3m3/day) Before 2020 24 0.8 After January 1, 2020 - Only includes DVG and Non-routine - Excludes pneumatics, glycol dehys, compressor seals 15 0.5 After 2021-12-31 - New sites cannot exceed 3 E3m3/month 3 0.1
  • 16.
    Data Analysis Case#1: Vent and Production Data • Compare VENT & PRODuction trends for: 1. Single Well Batteries (Type 311) a. VENT / PROD ratio by facility b. VENT / PROD ratio by well formation 2. Multi-well Proration Batteries (Type 322) a. VENT / PROD ratio by facility
  • 17.
    Data Analysis Case#1: Vent and Production Data cont… 1. Single Well Batteries (Type 311) a. VENT / PROD ratio by facility b. VENT / PROD ratio by well formation Context: • Where VENT / PROD is used as gas-to-oil ratio (GOR) • GOR is expected to be 0.007 e3m3 gas / m3 oil
  • 18.
    Data Analysis Case#1: Vent and Production Data cont… 1. Single Well Batteries (Type 311) a. VENT / PROD ratio by facility where VENT / PROD ratio > 0.069 Fig 1. Histogram of VENT/PROD Ratio > 0.069 Fig 2. Geospatial Bubble Map
  • 19.
    Data Analysis Case#1: Vent and Production Data cont… 1. Single Well Batteries (Type 311) a. VENT / PROD ratio by facility where VENT / PROD ratio > 0.69 Fig 3. Histogram of VENT/PROD Ratio > 0.69 Fig 4. Geospatial Bubble Map
  • 20.
    Data Analysis Case#1: Vent and Production Data cont… 1. Single Well Batteries (Type 311) b. VENT / PROD ratio by well formation Fig 5. List of GOR means by Formation Fig 6. Geospatial Bubble Map
  • 21.
    Data Analysis Case#1: Vent and Production Data cont… 2. Multi-well Proration Batteries (Type 322) a. VENT / PROD ratio by facility where VENT / PROD ratio > 0.069 Fig 7. Histogram of VENT/PROD Ratio > 0.069 Fig 8. Geospatial Bubble Map
  • 22.
    Data Analysis Case#2: Receipt and Production Data • Compare RECeipt and PRODuction trends for: • Multi-well Proration Batteries (Type 322) where REC/PROD > 1 and PROD > 1,000 m3/month Fig 9. Example of Proration Factor and REC/PROD Ratio vs. 2021 Month
  • 23.
    Data Analysis Case#2: Receipt and Production Data cont… • Geospatial representation where bubble colour and size represent operator and comparative REC/PROD ratio respectively Fig 10. Histogram of REC/PROD Ratio Fig 11. Geospatial Bubble Map
  • 24.
    Conclusions Both digital datasolutions offer useful methods for both producers and regulators to identify accuracy improvement opportunities.