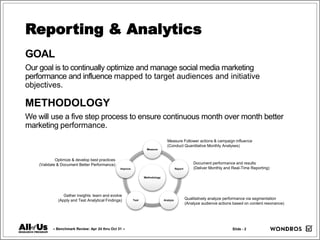
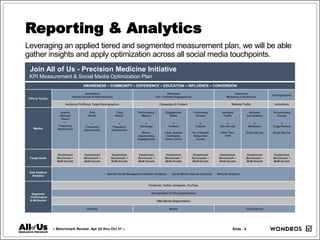
ANALYTICS &
MEASUREMENT
Reporting & Analytics
GOAL
Our goal is to continually optimize and manage social media marketing
performance and influence mapped to target audiences and initiative
objectives.
METHODOLOGY
We will use a five step process to ensure continuous month over month better
marketing performance.
Methodology
Measure
Report
Analyze
Test
Improve
Measure Follower actions & campaign influence
(Conduct Quantitative Monthly Analyses)
Document performance and results
(Deliver Monthly and Real-Time Reporting)
Qualitatively analyze performance via segmentation
(Analyze audience actions based on content resonance)
Gather insights: learn and evolve
(Apply and Test Analytical Findings)
Optimize & develop best practices
(Validate & Document Better Performance)
Slide - 2
– Benchmark Review: Apr 24 thru Oct 31 –
TOOLS
A mix of tools will be activated to manage our future performance. At the core of our
social media activities will be the subscription-based Sprinklr platform, which
combines daily publishing, engagement and analytics (and more) into an integrated,
holistic management platform. We will also leverage channel specific analytic and
advertising tools, which are available for all of our channels.
REPORTING CADENCE
The goal is to deliver monthly reporting for the social media team and key
stakeholders to steer ongoing social media execution. Insights collected from the
month over month quantitative and qualitative analyses will be applied for continuous
social media optimization to ensure we are reaching, growing and influencing
audiences at scale.
METRICS
Measurable metrics and KPIs will be leveraged to optimize overall social media
performance and to track performance against identified objectives and goals. A
robust measurement plan has been developed and put into place to direct ongoing
analytics, which leverages analysis segmentation across channels, demographics,
markets and user device preferences.
Reporting & Analytics
Slide - 3
– Benchmark Review: Apr 24 thru Oct 31 –
A sampling of insights we aim to gather and collect include:
Reporting & Analytics
How are social media marketing campaigns performing across paid, earned and owned?
What channels are performing best? Is performance aligned to objectives and goals?
How are campaigns, content and paid advertising impacting the user experience and user journey?
What creative and messages are resonating analyzed against target UBR populations?
What actionable trends do we see in the data?
How best can we leverage owned, earned and paid impressions for greater KPI performance and conversions?
What are audience persona, device use and geographic engagement nuances across social media?
How many impressions is it taking to move someone from social channel community participation to site visit
interest and enrollment?
How do we create look-a-like models and employ those into our outreach and advertising tactics?
Slide - 4
– Benchmark Review: Apr 24 thru Oct 31 –
Leveraging an applied tiered and segmented measurement plan, we will be able
gather insights and apply optimization across all social media touchpoints.
Reporting & Analytics
Join All of Us - Precision Medicine Initiative
KPI Measurement & Social Media Optimization Plan
AWARENESS – COMMUNITY – EXPERIENCE – EDUCATION – INFLUENCE – CONVERSION
KPIs & Tactics
Acquisition
Owned, Earned & Paid Influence
Behaviors
Fan / Follower Engagements
Outcomes
Marketing Conversions
Demographics
Audience Profiling x Target Demographics Campaigns & Content Website Traffic Activations
Metrics
Organic
(Earned)
Reach
+
Frequency
Impressions
Paid
Reach
+
Frequency
Impressions
Total
Reach
+
Frequency
Impressions
Performance
Metrics
x
Campaign
Reach,
Impressions,
Engagements
Engagement
Rates
x
Content
Likes, Shares,
Comments,
Views, Clicks
Community
Growth
x
Channel
Fan, Follower,
Subscriber
Counts
Assisted
Traffic
x
Site Activity
Click-Thru,
CTR
Assisted
Conversions
x
Attribution
Email Opt-Ins
Accumulated
Counts
x
Target Demos
Email Opt-Ins
Target Goals
Established
Benchmark +
MoM Growth
Established
Benchmark +
MoM Growth
Established
Benchmark +
MoM Growth
Established
Benchmark +
MoM Growth
Established
Benchmark +
MoM Growth
Established
Benchmark +
MoM Growth
Established
Benchmark +
MoM Growth
Established
Benchmark +
MoM Growth
Established
Benchmark +
MoM Growth
Data Platform
Analytics
- Sprinklr Social Management Platform Analytics - Social Media Channel Analytics - Website Analytics -
Segments
- Performance
& Attribution
Facebook, Twitter, Instagram, YouTube
Demographic Profile Segmentation
DMA Market Segmentation
Desktop Mobile Cross-Device
Slide - 5
– Benchmark Review: Apr 24 thru Oct 31 –
Our KPI and analytic framework will guide our strategic directions thru three core
analytic measurement pillars.
Reporting & Analytics
Acquisition
Website Traffic – How is social
media creating traffic to the primary
website?
How is Owned, Earned and Paid
media contributing?
Are we mapping to milestone target
goals for awareness and website
traffic?
Are we continuously optimizing
social media performance for
greater reach and influence?
Are we aligned to strategic
priorities and budget spend?
Behaviors
Personas & Demographics –
What does the conversion journey
look like? How is social media and
its channels influencing target
demographics?
What campaigns are resonating
with audiences? What content?
What ties into an optimal
experience for social media
communities and the potential
enrollee?
Which channels are performing best
for engagements?
Is the community and discussion
growing? Are our own social media
channels growing an audience?
Are we activating target audiences?
Outcomes
Conversions – How is social media
impacting conversion (email opt-ins
and account creation)?
How are individual social media
channels contributing?
What demographic trends are being
realized as created by social
media? What demographics do we
need to place greater emphasis?
How is social media impacting
regional market geographies and
conversions?
How is the national social media
effort supporting partner marketing
activities?
Slide - 6
– Benchmark Review: Apr 24 thru Oct 31 –
With deeper views via a defined metric ecosystem serving as the foundation to
drive social performance thru data + segmentation + measurement + analysis.
Reporting & Analytics
Owned Media
Channels, Campaigns & Content
 Organic Reach, frequency,
impressions
 Geo-demographic target goals
 Engagements, engagement
rates, clicks
 Social community growth
(Facebook, Twitter, Instagram,
YouTube)
 Assisted website traffic (visits,
views, duration, bounce rate,
CTAs)
 Conversion Counts
 Conversion Attribution: channels,
markets, socio-demos, device
 MoM target milestone growth
Shared & Earned Media
Content Sharing & Publicity
 Earned Reach, frequency,
impressions
 Geo-demographic target goals
 Organic content shares, clicks
 Post reach, engagements,
shares, clicks
 Assisted website traffic (visits,
views, duration, bounce rate,
CTAs)
 Conversion Counts
 Conversion Attribution: outlets,
socio-demos, markets, device
 MoM target milestone growth
Paid Media
Advertising Campaigns
 Paid reach, frequency,
impressions
 Geo-demographic target goals
 Performance metrics: Clicks,
CTR, CPC, CPM, ROAS, CPA
 Assisted website traffic (visits,
views, duration, bounce rate,
CTAs)
 Conversion Counts
 Conversion Attribution: outlets,
markets, socio-demos, device
 MoM target milestone growth
Slide - 7
– Benchmark Review: Apr 24 thru Oct 31 –
Channel
Influence
Measurement
Metric Views (Channel x Defined Time Cycle Benchmark Comparisons + MoM Averages)
Facebook
Acquisition
(Awareness)
Reach Impressions Frequency Fan Growth
Behaviors
(Influence)
Engaged
Followers +
Engagement Rate
Engagements
(Likes, Reactions,
Comments)
Engagements
(Shares, Reach)
Video Views Photo Views Mentions
Outcomes
(Conversion)
Link Clicks Profile Clicks
Channel
Influence
Measurement
Metric Views (Channel x Defined Time Cycle Benchmark Comparisons + MoM Averages)
Twitter
Acquisition
(Awareness)
Reach +
Tweet Reach Rate
Impressions Frequency Follower Growth
Behaviors
(Influence)
Engagement Rate
Retweets + RT
Rate
Likes + Like Rate @Replies DMs Listed
Media
Engagements
Outcomes
(Conversion)
Link Clicks Profile Clicks
Channel
Influence
Measurement
Metric Views (Channel x Defined Time Cycle Benchmark Comparisons + MoM Averages)
Instagram
Acquisition
(Awareness)
Reach Impressions Frequency Follower Growth
Behaviors
(Influence)
Engagement Rate Likes Comments Video Views Saves
Outcomes
(Conversion)
Link Clicks Profile Clicks
Channel
Influence
Measurement
Metric Views (Channel x Defined Time Cycle Benchmark Comparisons + MoM Averages)
YouTube
Acquisition
(Awareness)
Subscriber Growth
Behaviors
(Influence)
Engagement Rate Channel Views Video Views
Video Time
Watched
Likes Shares
Outcomes
(Conversion)
Link Clicks Profile Clicks
Reporting & Analytics
Social Media Channel Metrics Mapping.
Slide - 8
– Benchmark Review: Apr 24 thru Oct 31 –
Applying anevolvingsocialcontentpublishing taggingarchitecture, we will furtherbeable
tooptimize overallcontentperformance forgreaterinfluence &audience engagements.
‐‐‐‐‐‐‐‐‐‐‐‐‐‐‐‐‐‐‐‐‐‐‐‐‐‐‐‐‐‐‐‐‐‐‐‐‐‐‐‐‐‐‐‐‐‐‐‐‐‐‐‐‐‐‐‐‐‐‐‐‐‐
CAMPAIGN (CONTENT OBJECTIVE)
Category Umbrella Tagging (single‐pick list)
Campaign: Trust (all content)
Campaign: Awareness (all content)
Campaign: Education (all content)
Campaign: Conversion (all content)
Campaign: Engagement (all content)
Campaign: Influencers (all content)
‐‐‐‐‐‐‐‐‐‐‐‐‐‐‐‐‐‐‐‐‐‐‐‐‐‐‐‐‐‐‐‐‐‐‐‐‐‐‐‐‐‐‐‐‐‐‐‐‐‐‐‐‐‐‐‐‐‐‐‐‐‐
CONTENT TYPE
Umbrella Tagging (single‐pick list)
Infographic
Image or photo
NIH vlog or blog post
Press
Video
Animation
Persona highlight
Partner content
Curated content
Inspirational quote
CTA conversion link
‐‐‐‐‐‐‐‐‐‐‐‐‐‐‐‐‐‐‐‐‐‐‐‐‐‐‐‐‐‐‐‐‐‐‐‐‐‐‐‐‐‐‐‐‐‐‐‐‐‐‐‐‐‐‐‐‐‐‐‐‐‐
‐‐‐‐‐‐‐‐‐‐‐‐‐‐‐‐‐‐‐‐‐‐‐‐‐‐‐‐‐‐‐‐‐‐‐‐‐‐‐‐‐‐‐‐‐‐‐‐‐‐‐‐‐‐‐‐‐‐‐‐‐‐
CONTENT THEMES
Umbrella Tagging (multi‐pick parameter list)
Content Origin
Organic Content
Earned Content
Promoted Content
Language Use
Language Use: English
Language Use: Spanish
Content Theme
Engagement Theme 1 (How To Tips)
Engagement Theme 2 (Did You Know)
Engagement Theme 3 (Health Stories)
Engagement Theme 4 (Personal Lifestyles)
Engagement Theme 5 (People Behind the
Scenes)
Engagement Theme 6 (UGC)
Education Theme 1 (Universal Health Benefits)
Education Theme 2 (Data and the Research
Process)
Education Theme 3 (Patient Testimonials)
Education Theme 4 (Eric Dishman / NIH)
Education Theme 5 (Enrollment Steps)
Education Theme 6 (Participation Steps)
Education Theme 7 (Mobile App Activation)
Earned Media (Press Coverage)
‐‐‐‐‐‐‐‐‐‐‐‐‐‐‐‐‐‐‐‐‐‐‐‐‐‐‐‐‐‐‐‐‐‐‐‐‐‐‐‐‐‐‐‐‐‐‐‐‐‐‐‐‐‐‐‐‐‐‐‐‐‐
CONTENT THEMES (continued)
Target Demographic
Demo ‐ Persona Theme 1 (Hispanic)
Demo ‐ Persona Theme 2 (African‐American)
Demo ‐ Persona Theme 3 (Asian‐American)
Demo ‐ Persona Theme 4 (Elderly ‐ Seniors)
Demo ‐ Persona Theme 5 (Suburban
Caucasian)
Demo ‐ Persona Theme 6 (General Population)
Demo ‐ Age Group Theme 1 (Millennial)
Demo ‐ Age Group Theme 2 (Generation X)
Demo ‐ Age Group Theme 3 (Baby Boomers)
Target Geography
Geography ‐ Pilot MSA 1 (San Diego)
Geography ‐ Pilot MSA 2 (Phoenix)
Geography ‐ Pilot MSA 3 (Pittsburgh)
Geography ‐ Census Region 1 (West)
Geography ‐ Census Region 2 (Midwest)
Geography ‐ Census Region 3 (South)
Geography ‐ Census Region 4 (Northeast)
Geography ‐ Rollout (DV Market)
Partner Cross Promotion
Partner 1 (Walgreens)
Partner 2 (Mayo Clinic)
Partner 3 (WebMD)
Partner 4 (Scripps)
Partner 5 (San Diego Blood Bank)
Partner 6 (TBD)
Reporting & Analytics
Slide - 9
– Benchmark Review: Apr 24 thru Oct 31 –
 Traffic Source Patterns
 Campaign Performance
 Content Resonance
 Device & Screen Preference
 Marketing Channel Influence
 Community Inspiration & Growth
 Socio-Demo Activation
 Gen Pop (Persona) Impact
 Geography Mapping & Influence
 Acquisition / Conversion Costs
 Month over Month Performance
 Milestone Targets
All the while delivering consistentlybetter, social media performance through a
systematic approach via actionable insights to steer future execution for maximum
influence and conversions.
Reporting & Analytics
OPTIMIZATION
Slide - 10
– Benchmark Review: Apr 24 thru Oct 31 –
Measurement Plan

Measurement Plan

  • 1.
  • 2.
    Reporting & Analytics GOAL Ourgoal is to continually optimize and manage social media marketing performance and influence mapped to target audiences and initiative objectives. METHODOLOGY We will use a five step process to ensure continuous month over month better marketing performance. Methodology Measure Report Analyze Test Improve Measure Follower actions & campaign influence (Conduct Quantitative Monthly Analyses) Document performance and results (Deliver Monthly and Real-Time Reporting) Qualitatively analyze performance via segmentation (Analyze audience actions based on content resonance) Gather insights: learn and evolve (Apply and Test Analytical Findings) Optimize & develop best practices (Validate & Document Better Performance) Slide - 2 – Benchmark Review: Apr 24 thru Oct 31 –
  • 3.
    TOOLS A mix oftools will be activated to manage our future performance. At the core of our social media activities will be the subscription-based Sprinklr platform, which combines daily publishing, engagement and analytics (and more) into an integrated, holistic management platform. We will also leverage channel specific analytic and advertising tools, which are available for all of our channels. REPORTING CADENCE The goal is to deliver monthly reporting for the social media team and key stakeholders to steer ongoing social media execution. Insights collected from the month over month quantitative and qualitative analyses will be applied for continuous social media optimization to ensure we are reaching, growing and influencing audiences at scale. METRICS Measurable metrics and KPIs will be leveraged to optimize overall social media performance and to track performance against identified objectives and goals. A robust measurement plan has been developed and put into place to direct ongoing analytics, which leverages analysis segmentation across channels, demographics, markets and user device preferences. Reporting & Analytics Slide - 3 – Benchmark Review: Apr 24 thru Oct 31 –
  • 4.
    A sampling ofinsights we aim to gather and collect include: Reporting & Analytics How are social media marketing campaigns performing across paid, earned and owned? What channels are performing best? Is performance aligned to objectives and goals? How are campaigns, content and paid advertising impacting the user experience and user journey? What creative and messages are resonating analyzed against target UBR populations? What actionable trends do we see in the data? How best can we leverage owned, earned and paid impressions for greater KPI performance and conversions? What are audience persona, device use and geographic engagement nuances across social media? How many impressions is it taking to move someone from social channel community participation to site visit interest and enrollment? How do we create look-a-like models and employ those into our outreach and advertising tactics? Slide - 4 – Benchmark Review: Apr 24 thru Oct 31 –
  • 5.
    Leveraging an appliedtiered and segmented measurement plan, we will be able gather insights and apply optimization across all social media touchpoints. Reporting & Analytics Join All of Us - Precision Medicine Initiative KPI Measurement & Social Media Optimization Plan AWARENESS – COMMUNITY – EXPERIENCE – EDUCATION – INFLUENCE – CONVERSION KPIs & Tactics Acquisition Owned, Earned & Paid Influence Behaviors Fan / Follower Engagements Outcomes Marketing Conversions Demographics Audience Profiling x Target Demographics Campaigns & Content Website Traffic Activations Metrics Organic (Earned) Reach + Frequency Impressions Paid Reach + Frequency Impressions Total Reach + Frequency Impressions Performance Metrics x Campaign Reach, Impressions, Engagements Engagement Rates x Content Likes, Shares, Comments, Views, Clicks Community Growth x Channel Fan, Follower, Subscriber Counts Assisted Traffic x Site Activity Click-Thru, CTR Assisted Conversions x Attribution Email Opt-Ins Accumulated Counts x Target Demos Email Opt-Ins Target Goals Established Benchmark + MoM Growth Established Benchmark + MoM Growth Established Benchmark + MoM Growth Established Benchmark + MoM Growth Established Benchmark + MoM Growth Established Benchmark + MoM Growth Established Benchmark + MoM Growth Established Benchmark + MoM Growth Established Benchmark + MoM Growth Data Platform Analytics - Sprinklr Social Management Platform Analytics - Social Media Channel Analytics - Website Analytics - Segments - Performance & Attribution Facebook, Twitter, Instagram, YouTube Demographic Profile Segmentation DMA Market Segmentation Desktop Mobile Cross-Device Slide - 5 – Benchmark Review: Apr 24 thru Oct 31 –
  • 6.
    Our KPI andanalytic framework will guide our strategic directions thru three core analytic measurement pillars. Reporting & Analytics Acquisition Website Traffic – How is social media creating traffic to the primary website? How is Owned, Earned and Paid media contributing? Are we mapping to milestone target goals for awareness and website traffic? Are we continuously optimizing social media performance for greater reach and influence? Are we aligned to strategic priorities and budget spend? Behaviors Personas & Demographics – What does the conversion journey look like? How is social media and its channels influencing target demographics? What campaigns are resonating with audiences? What content? What ties into an optimal experience for social media communities and the potential enrollee? Which channels are performing best for engagements? Is the community and discussion growing? Are our own social media channels growing an audience? Are we activating target audiences? Outcomes Conversions – How is social media impacting conversion (email opt-ins and account creation)? How are individual social media channels contributing? What demographic trends are being realized as created by social media? What demographics do we need to place greater emphasis? How is social media impacting regional market geographies and conversions? How is the national social media effort supporting partner marketing activities? Slide - 6 – Benchmark Review: Apr 24 thru Oct 31 –
  • 7.
    With deeper viewsvia a defined metric ecosystem serving as the foundation to drive social performance thru data + segmentation + measurement + analysis. Reporting & Analytics Owned Media Channels, Campaigns & Content  Organic Reach, frequency, impressions  Geo-demographic target goals  Engagements, engagement rates, clicks  Social community growth (Facebook, Twitter, Instagram, YouTube)  Assisted website traffic (visits, views, duration, bounce rate, CTAs)  Conversion Counts  Conversion Attribution: channels, markets, socio-demos, device  MoM target milestone growth Shared & Earned Media Content Sharing & Publicity  Earned Reach, frequency, impressions  Geo-demographic target goals  Organic content shares, clicks  Post reach, engagements, shares, clicks  Assisted website traffic (visits, views, duration, bounce rate, CTAs)  Conversion Counts  Conversion Attribution: outlets, socio-demos, markets, device  MoM target milestone growth Paid Media Advertising Campaigns  Paid reach, frequency, impressions  Geo-demographic target goals  Performance metrics: Clicks, CTR, CPC, CPM, ROAS, CPA  Assisted website traffic (visits, views, duration, bounce rate, CTAs)  Conversion Counts  Conversion Attribution: outlets, markets, socio-demos, device  MoM target milestone growth Slide - 7 – Benchmark Review: Apr 24 thru Oct 31 –
  • 8.
    Channel Influence Measurement Metric Views (Channelx Defined Time Cycle Benchmark Comparisons + MoM Averages) Facebook Acquisition (Awareness) Reach Impressions Frequency Fan Growth Behaviors (Influence) Engaged Followers + Engagement Rate Engagements (Likes, Reactions, Comments) Engagements (Shares, Reach) Video Views Photo Views Mentions Outcomes (Conversion) Link Clicks Profile Clicks Channel Influence Measurement Metric Views (Channel x Defined Time Cycle Benchmark Comparisons + MoM Averages) Twitter Acquisition (Awareness) Reach + Tweet Reach Rate Impressions Frequency Follower Growth Behaviors (Influence) Engagement Rate Retweets + RT Rate Likes + Like Rate @Replies DMs Listed Media Engagements Outcomes (Conversion) Link Clicks Profile Clicks Channel Influence Measurement Metric Views (Channel x Defined Time Cycle Benchmark Comparisons + MoM Averages) Instagram Acquisition (Awareness) Reach Impressions Frequency Follower Growth Behaviors (Influence) Engagement Rate Likes Comments Video Views Saves Outcomes (Conversion) Link Clicks Profile Clicks Channel Influence Measurement Metric Views (Channel x Defined Time Cycle Benchmark Comparisons + MoM Averages) YouTube Acquisition (Awareness) Subscriber Growth Behaviors (Influence) Engagement Rate Channel Views Video Views Video Time Watched Likes Shares Outcomes (Conversion) Link Clicks Profile Clicks Reporting & Analytics Social Media Channel Metrics Mapping. Slide - 8 – Benchmark Review: Apr 24 thru Oct 31 –
  • 9.
    Applying anevolvingsocialcontentpublishing taggingarchitecture,we will furtherbeable tooptimize overallcontentperformance forgreaterinfluence &audience engagements. ‐‐‐‐‐‐‐‐‐‐‐‐‐‐‐‐‐‐‐‐‐‐‐‐‐‐‐‐‐‐‐‐‐‐‐‐‐‐‐‐‐‐‐‐‐‐‐‐‐‐‐‐‐‐‐‐‐‐‐‐‐‐ CAMPAIGN (CONTENT OBJECTIVE) Category Umbrella Tagging (single‐pick list) Campaign: Trust (all content) Campaign: Awareness (all content) Campaign: Education (all content) Campaign: Conversion (all content) Campaign: Engagement (all content) Campaign: Influencers (all content) ‐‐‐‐‐‐‐‐‐‐‐‐‐‐‐‐‐‐‐‐‐‐‐‐‐‐‐‐‐‐‐‐‐‐‐‐‐‐‐‐‐‐‐‐‐‐‐‐‐‐‐‐‐‐‐‐‐‐‐‐‐‐ CONTENT TYPE Umbrella Tagging (single‐pick list) Infographic Image or photo NIH vlog or blog post Press Video Animation Persona highlight Partner content Curated content Inspirational quote CTA conversion link ‐‐‐‐‐‐‐‐‐‐‐‐‐‐‐‐‐‐‐‐‐‐‐‐‐‐‐‐‐‐‐‐‐‐‐‐‐‐‐‐‐‐‐‐‐‐‐‐‐‐‐‐‐‐‐‐‐‐‐‐‐‐ ‐‐‐‐‐‐‐‐‐‐‐‐‐‐‐‐‐‐‐‐‐‐‐‐‐‐‐‐‐‐‐‐‐‐‐‐‐‐‐‐‐‐‐‐‐‐‐‐‐‐‐‐‐‐‐‐‐‐‐‐‐‐ CONTENT THEMES Umbrella Tagging (multi‐pick parameter list) Content Origin Organic Content Earned Content Promoted Content Language Use Language Use: English Language Use: Spanish Content Theme Engagement Theme 1 (How To Tips) Engagement Theme 2 (Did You Know) Engagement Theme 3 (Health Stories) Engagement Theme 4 (Personal Lifestyles) Engagement Theme 5 (People Behind the Scenes) Engagement Theme 6 (UGC) Education Theme 1 (Universal Health Benefits) Education Theme 2 (Data and the Research Process) Education Theme 3 (Patient Testimonials) Education Theme 4 (Eric Dishman / NIH) Education Theme 5 (Enrollment Steps) Education Theme 6 (Participation Steps) Education Theme 7 (Mobile App Activation) Earned Media (Press Coverage) ‐‐‐‐‐‐‐‐‐‐‐‐‐‐‐‐‐‐‐‐‐‐‐‐‐‐‐‐‐‐‐‐‐‐‐‐‐‐‐‐‐‐‐‐‐‐‐‐‐‐‐‐‐‐‐‐‐‐‐‐‐‐ CONTENT THEMES (continued) Target Demographic Demo ‐ Persona Theme 1 (Hispanic) Demo ‐ Persona Theme 2 (African‐American) Demo ‐ Persona Theme 3 (Asian‐American) Demo ‐ Persona Theme 4 (Elderly ‐ Seniors) Demo ‐ Persona Theme 5 (Suburban Caucasian) Demo ‐ Persona Theme 6 (General Population) Demo ‐ Age Group Theme 1 (Millennial) Demo ‐ Age Group Theme 2 (Generation X) Demo ‐ Age Group Theme 3 (Baby Boomers) Target Geography Geography ‐ Pilot MSA 1 (San Diego) Geography ‐ Pilot MSA 2 (Phoenix) Geography ‐ Pilot MSA 3 (Pittsburgh) Geography ‐ Census Region 1 (West) Geography ‐ Census Region 2 (Midwest) Geography ‐ Census Region 3 (South) Geography ‐ Census Region 4 (Northeast) Geography ‐ Rollout (DV Market) Partner Cross Promotion Partner 1 (Walgreens) Partner 2 (Mayo Clinic) Partner 3 (WebMD) Partner 4 (Scripps) Partner 5 (San Diego Blood Bank) Partner 6 (TBD) Reporting & Analytics Slide - 9 – Benchmark Review: Apr 24 thru Oct 31 –
  • 10.
     Traffic SourcePatterns  Campaign Performance  Content Resonance  Device & Screen Preference  Marketing Channel Influence  Community Inspiration & Growth  Socio-Demo Activation  Gen Pop (Persona) Impact  Geography Mapping & Influence  Acquisition / Conversion Costs  Month over Month Performance  Milestone Targets All the while delivering consistentlybetter, social media performance through a systematic approach via actionable insights to steer future execution for maximum influence and conversions. Reporting & Analytics OPTIMIZATION Slide - 10 – Benchmark Review: Apr 24 thru Oct 31 –