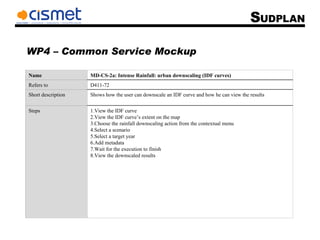
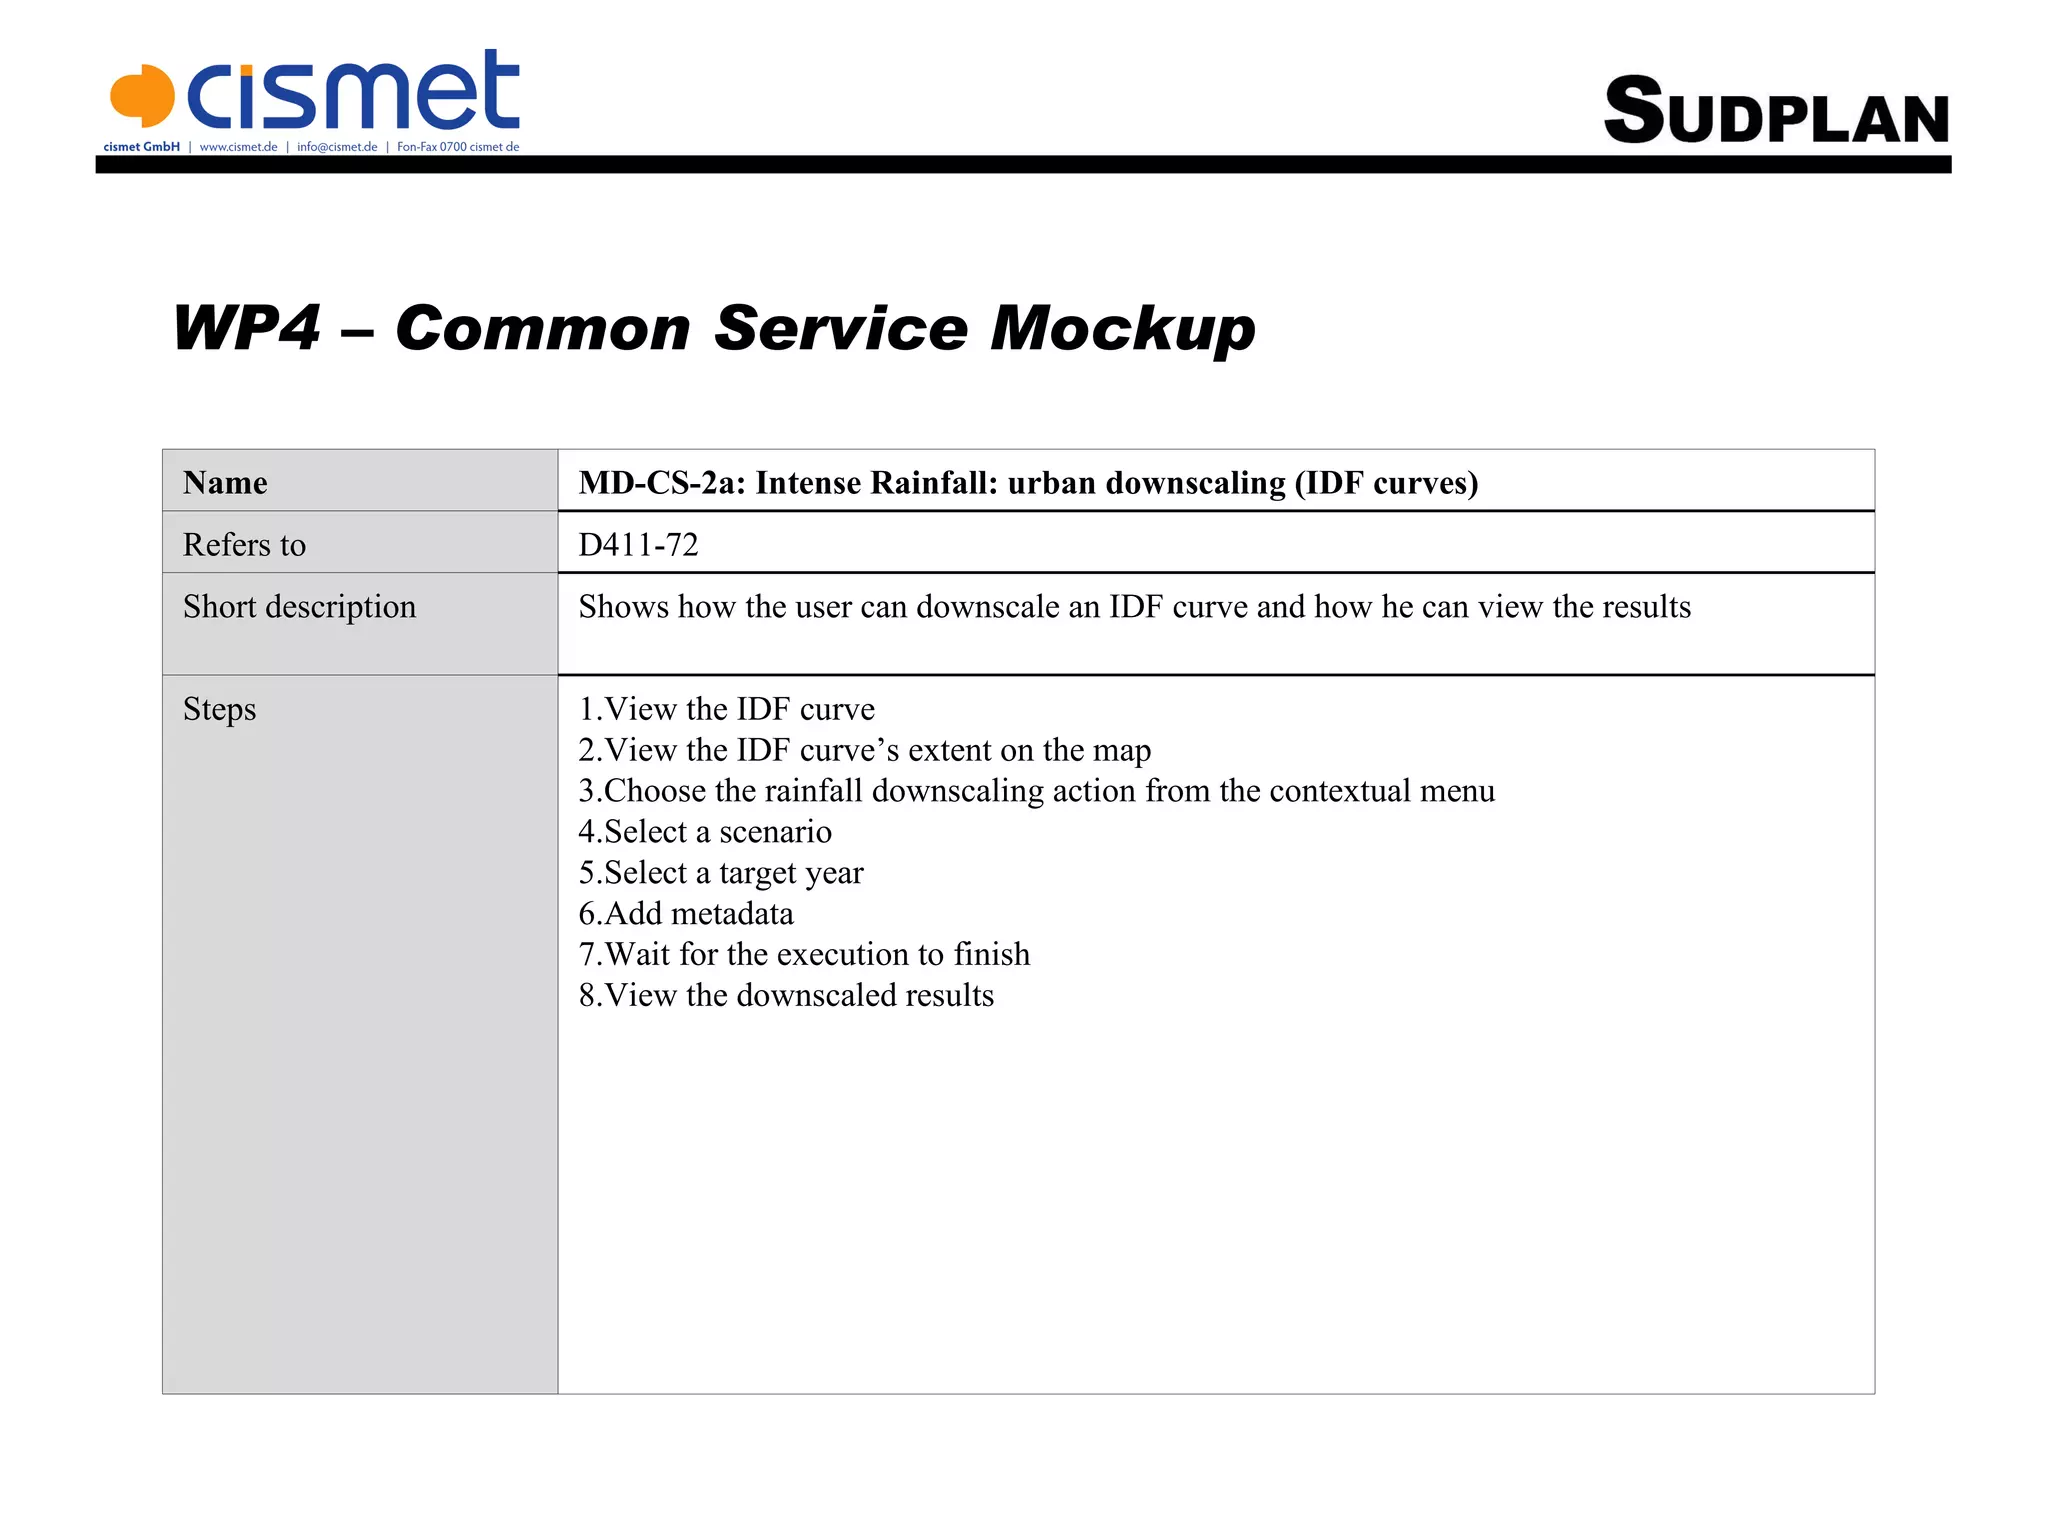
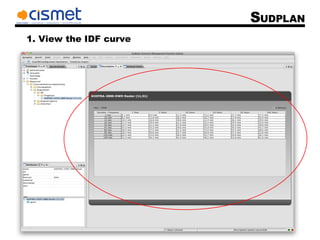
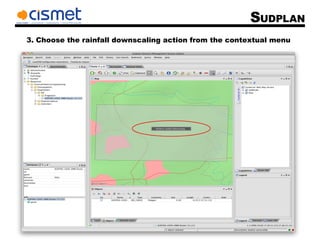
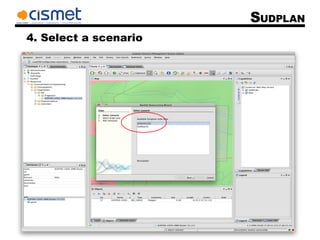
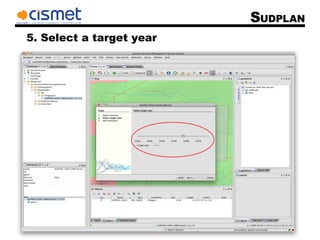
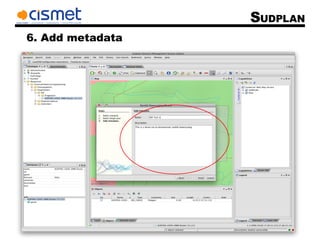
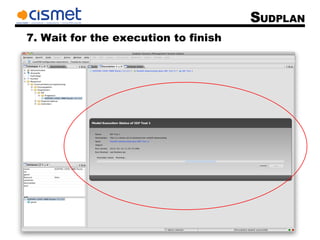
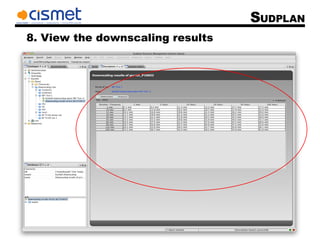
This document outlines 8 steps for downscaling an intensity-duration-frequency (IDF) curve in a common service mockup: 1) view the IDF curve, 2) view its extent on a map, 3) choose downscaling from a menu, 4) select a scenario, 5) select a target year, 6) add metadata, 7) wait for execution, and 8) view downscaled results. The process allows a user to downscale an IDF curve and view the results.


![Getting Started with Apache Spark: Big Data Made Simple [Free Meetup]](https://cdn.slidesharecdn.com/ss_thumbnails/apachesparkgettingstarted-260203175547-8361bcc3-thumbnail.jpg?width=640&height=640&fit=bounds)


