This document contains a multi-dimensional assessment test with 40 questions on various math topics for an 8th grade student. The test covers linear inequalities in two variables, systems of linear inequalities, relations and functions, conditional statements, and proof and reasoning. For each question, the student must choose the best answer from multiple choices. The document also provides the student's name, school, grade level, subject, quarter, number of days/hours of instruction on each topic, and a breakdown of the number and domain of the test questions.
The document provides information about the quantitative section of the Graduate Management Admission Test (GMAT). It details that the section contains 37 questions to be completed in 75 minutes, including both problem solving and data sufficiency questions. Problem solving questions require solving the problem and choosing the best answer, while data sufficiency questions involve determining whether one, both, or neither of the given statement(s) are sufficient to answer the question. The document provides examples of several questions and explains the relevant terms and concepts.
IIT JAM MATH 2018 Question Paper | Sourav Sir's ClassesSOURAV DAS
IIT JAM Math Previous Year Question Paper
IIT JAM Math 2018 Question Paper
IIT JAM Preparation Strategy
For full solutions contact us.
Call - 9836793076
This document contains a daily lesson log for a 7th grade mathematics class. The lesson covers algebraic expressions, properties of real numbers, linear equations, and inequalities in one variable. The lesson objectives are to differentiate between equations and inequalities, illustrate linear equations and inequalities, and find solutions to linear equations and inequalities. The lesson content includes differentiating equations and inequalities, linear equations and inequalities in one variable, and solving linear equations and inequalities. Learning resources and procedures are outlined for reviewing concepts, examples, practice, and application. Formative assessments are used to check student understanding.
GATE Math 2013 Question Paper | Sourav Sir's ClassesSOURAV DAS
GATE Math 2013 Question Paper
GATE Math Preparation Strategy
Math Question Paper
For full solutions contact us.
Call - 9836793076
Sourav Sir's Classes
Kolkata, New Delhi
The document contains 10 multiple choice questions about quadratic equations. It assesses the test taker's understanding of key concepts like identifying quadratic equations, graphing quadratic functions, writing quadratic equations in standard form, and solving quadratic equations by extracting square roots. The questions range from easy to difficult levels of difficulty.
Math 235 - Summer 2015Homework 2Due Monday June 8 in cla.docxandreecapon
Math 235 - Summer 2015
Homework 2
Due Monday June 8 in class
Remember: In this course, you must always show reasoning for your answers. You can use any result we have
proved in class, in textbook reading, or in a previous homework.
Problem 1 For each of the following problems, you must justify your answer by finding the general solution
to the corresponding system of linear equations, or by showing that no solution exists.
(a) In the vector space P3(R), can −2x3 − 11x2 + 3x+ 2 be written as a linear combination of vectors in
{x3 − 2x2 + 3x− 1, 2x3 + x2 + 3x− 2}?
(b) In the vector space M2×2(R), can
(
1 0
0 1
)
be written as a linear combination of vectors
in
{(
1 0
−1 0
)
,
(
0 1
0 1
)
,
(
1 1
0 0
)}
?
Problem 2 Show that a subset W of a vector space V (over a field F ) is a subspace of V if and only if
span(W ) = W .
Problem 3 You are given a subset S of a vector space V . Determine whether S is linearly dependent or
linearly independent using exclusively methods developed in this course, and justify your answers.
(a) V = R3 and S = {(1, 2,−1), (2,−3, 1), (2, 3,−5)}.
(b) V = P3(R) and S = {1, 1 + 2t+ t2, 1− 2t+ t3, t2 + t3}.
(c) V = F(R,R) and S = {t, et, sin(t)}.
Problem 4 Prove that a subset S of a vector space V is linearly dependent if and only if there exists a
proper subset S′ ( S with the same span as S.
Problem 5 Exercise 1.6.13 from the textbook.
Problem 6 You are given a subspace S of M2×2(F ), the vector space of 2 × 2 matrices with entries in a
field F . You are required to find a basis for this subspace, and to find the dimension of this subspace.
For each problem, you DO NOT need to prove that S is a subspace, but you DO need to prove that your
conjectured basis is, in fact, a basis (that is, you need to show it is a linearly independent generating set for
S).
(a) S is the subspace of all diagonal 2× 2 matrices with entries in F .
(b) S is the subspace of all symmetric 2× 2 matrices with entries in F .
(c) S is the subspace of all skew-symmetric 2× 2 matrices with entries in F .
Problem 7 Let W1 and W2 be subspaces of a finite-dimensional vector space V . Prove that dim(W1∩W2) ≤
min{dim(W1),dim(W2)} and dim(W1 +W2) ≥ max{dim(W1),dim(W2)}.
Problem 8 Each of the maps below goes from one vector space to another (where both vectors spaces are
over the same field). For each map: prove that it is linear, determine whether it is one-to-one or not (prove
your answer), and determine whether it is onto or not (prove your answer).
(a) T : P3(R)→M2×2(R) defined by T (p) =
(
p(0) p′(0)
p′′(0) p′′′(0)
)
.
(b) T : M2×2(F ) → F defined by T (A) = tr(A), where F is a field. (Recall that for an n × n matrix,
tr(A) =
∑n
i=1Aii.)
1
(c) T : R2 → R3 defined by T ((a, b)) = (a, b, a+ b).
(Hint: You may find an analysis of rank and nullity useful here.)
Problem 9 Suppose that T : R2 → R2 is linear and that T ((1, 2)) = (3, 4) and T ((1, 3)) = (0, 1). Find
T ((1, 0)). Is T one-to-one? Justify your answer.
Problem 10 Let ...
Linear inequalities in two variables can be represented as ax + by + c < 0, where a and b are not both zero and c can be any real number. The inequality symbol can be <, >, ≤, or ≥. Systems of linear inequalities in two variables can model real-life situations and be represented graphically by shading the region defined by the intersection of the inequalities. Solving problems involving linear inequalities in two variables involves reading the problem, representing it with inequalities, solving for the unknown quantity, and checking the solution.
QuizTop of FormQuestion 1 (24 points)Question 1True or Fa.docxsleeperharwell
Quiz
Top of Form
Question 1 (24 points)
Question 1:
True or False.
Enter the answer to each of the the questions with:
T for True
F for False
(a) If all the observations in a data set are identical, then the variance for this data set is zero.
[removed]
(b) If P(A) = 0.4 and P(B) = 0.5, then P(A AND B) = 0.2.
[removed]
c. The mean is always equal to the median for a normal distribution.
[removed]
(
d) A 95% confidence interval is wider than a 90% confidence interval of the same parameter
.
[removed]
(e) In a two-tailed hypothesis testing at significance level α of 0.05, the test statistic is calculated as 2. If P(X >2) = 0.03, then we have sufficient evidence to reject the null hypothesis.
[removed]
Bottom of Form
Question 2 (5 points)
Question 2 options:
Refer to the following frequency distribution for Questions 2, 3, 4, and 5.
Show all work. Just the answer, without supporting work, will receive no credit.
A random sample of 100 students was chosen from UMUC STAT 200 classes. The frequency distribution below shows the distribution for study time each week (in hours).
Checkout Time (in minutes)
Frequency
Relative Frequency
0.0 - 4.9
5
A
5.0 - 9.9
13
B
10.0 - 14.9
C
22
15.0 - 19.9
42
D
20.0 - 24.9
E
F
Total
100
G
Complete the Frequency Table with the missing frequency and relative frequency numbers.
Enter answer for "A" as a decimal with 2 decimal places with a zero to the left of the decimal point.
[removed]
Enter answer for "B" as a decimal with 2 decimal places with a zero to the left of the decimal point.
[removed]
Enter answer for "C" as an Integer.
[removed]
Enter answer for "D" as a decimal with 2 decimal places with a zero to the left of the decimal point.
[removed]
Enter answer for "E" as an integer.
[removed]
Enter answer for "F" as a decimal with 2 decimal places with a zero to the left of the decimal point.
[removed]
Question 3 (5 points)
Question 3 options:
A random sample of 100 students was chosen from UMUC STAT 200 classes. The frequency distribution below shows the distribution for study time each week (in hours).
This is the same distribution table from Question 2
Checkout Time (in minutes)
Frequency
Relative Frequency
0.0 - 4.9
5
A
5.0 - 9.9
13
B
10.0 - 14.9
C
22
15.0 - 19.9
42
D
20.0 - 24.9
E
F
Total
100
G
What percentage of the study times was at least 15 hours?
Enter answer as a percent without the percent sign to 0 decimal places.
[removed]
Question 4 (5 points)
Question 4 options:
A random sample of 100 students was chosen from UMUC STAT 200 classes. The frequency distribution below shows the distribution for study time each week (in hours).
This is the same distribution table from Question 2
Checkout Time (in minutes)
Frequency
Relative Frequency
0.0 - 4.9
5
A
5.0 - 9.9
13
B
10.0 - 14.9
C
22
15.0 - 19.9
42
D
20.0 - 24.9
E
F
Total
100
G
In what class interval must the median lie? Explain your answer.
.
This document provides the blueprint and model question paper for the 10th class mathematics exam.
It includes 6 tables that provide the weightage and distribution of questions for various components of the exam - academic standards, content areas, difficulty levels, question types, area-question mapping and blueprints.
The question paper will have 2 parts - Part A for 35 marks with 5 questions to be answered from 2 groups, and Part B for 15 marks with short answer questions to be answered on the question paper. The questions will assess chapters on numbers, algebra, coordinate geometry and assess various academic standards.
This document contains an unsolved mathematics paper from 1992 containing 3 sections - single correct answer type questions, matching questions, and fill in the blank questions. The paper covers topics such as roots of equations, polynomials, loci of points, probability, functions, and counting principles. In total, there are 20 questions testing a variety of math concepts and skills.
This document provides a daily lesson log for a Grade 8 mathematics class taught by Luisa F. Garcillan. The lesson covers linear inequalities in two variables over four class sessions. The objectives are to illustrate, differentiate, and graph linear inequalities in two variables. References and learning resources include textbooks, guides, and online materials. The procedures involve reviewing concepts, presenting examples, discussing new concepts, and practicing skills through activities, graphing, and word problems. The goal is for students to understand and be able to solve problems involving linear inequalities in two variables.
QuizQuestion 1 (24 points)Question 1True or Fal.docxsleeperharwell
Quiz
Question 1 (24 points)
Question 1:
True or False.
Enter the answer to each of the the questions with:
T for True
F for False
(a) If all the observations in a data set are identical, then the variance for this data set is zero.
[removed]
(b) If P(A) = 0.4 and P(B) = 0.5, then P(A AND B) = 0.2.
[removed]
c. The mean is always equal to the median for a normal distribution.
[removed]
(
d) A 95% confidence interval is wider than a 90% confidence interval of the same parameter
.
[removed]
(e) In a two-tailed hypothesis testing at significance level α of 0.05, the test statistic is calculated as 2. If P(X >2) = 0.03, then we have sufficient evidence to reject the null hypothesis.
[removed]
Question 2 (5 points)
Question 2 options:
Refer to the following frequency distribution for Questions 2, 3, 4, and 5.
Show all work. Just the answer, without supporting work, will receive no credit.
A random sample of 100 students was chosen from UMUC STAT 200 classes. The frequency distribution below shows the distribution for study time each week (in hours).
Checkout Time (in minutes)
Frequency
Relative Frequency
0.0 - 4.9
5
A
5.0 - 9.9
13
B
10.0 - 14.9
C
22
15.0 - 19.9
42
D
20.0 - 24.9
E
F
Total
100
G
Complete the Frequency Table with the missing frequency and relative frequency numbers.
Enter answer for "A" as a decimal with 2 decimal places with a zero to the left of the decimal point.
[removed]
Enter answer for "B" as a decimal with 2 decimal places with a zero to the left of the decimal point.
[removed]
Enter answer for "C" as an Integer.
[removed]
Enter answer for "D" as a decimal with 2 decimal places with a zero to the left of the decimal point.
[removed]
Enter answer for "E" as an integer.
[removed]
Enter answer for "F" as a decimal with 2 decimal places with a zero to the left of the decimal point.
[removed]
Question 3 (5 points)
Question 3 options:
A random sample of 100 students was chosen from UMUC STAT 200 classes. The frequency distribution below shows the distribution for study time each week (in hours).
This is the same distribution table from Question 2
Checkout Time (in minutes)
Frequency
Relative Frequency
0.0 - 4.9
5
A
5.0 - 9.9
13
B
10.0 - 14.9
C
22
15.0 - 19.9
42
D
20.0 - 24.9
E
F
Total
100
G
What percentage of the study times was at least 15 hours?
Enter answer as a percent without the percent sign to 0 decimal places.
[removed]
Question 4 (5 points)
Question 4 options:
A random sample of 100 students was chosen from UMUC STAT 200 classes. The frequency distribution below shows the distribution for study time each week (in hours).
This is the same distribution table from Question 2
Checkout Time (in minutes)
Frequency
Relative Frequency
0.0 - 4.9
5
A
5.0 - 9.9
13
B
10.0 - 14.9
C
22
15.0 - 19.9
42
D
20.0 - 24.9
E
F
Total
100
G
In what class interval must the median lie? Explain your answer.
Enter answer by selecting the.
This document provides an overview of measures of central tendency and dispersion in statistics. It defines mean, median and mode as the three primary measures of central tendency. It provides examples of calculating the mean and discusses the relationship between mean, median and mode. It also defines range, variance, standard deviation and coefficient of variation as measures of dispersion. The document solves examples calculating mean, median, standard deviation and discusses the dependence of mean and standard deviation on changes in origin and scale of data.
This document contains a series of quantitative questions related to topics like fractions, ratios, percentages, integers, algebra, geometry, counting, probability, and coordinate geometry. Each question is followed by multiple choice answers. The questions range in difficulty from introductory to advanced. This appears to be a practice test or set of example questions for the GMAT quantitative section.
This document provides an overview of the topics covered in an introductory mathematics analysis course for business, economics, and social sciences. It includes:
1) A review of key concepts like algebra, subsets of real numbers, properties of operations, and graphing numbers on a number line.
2) An outline of course structure with sections on algebra, algebraic expressions, fractions, and mathematical systems.
3) Examples of problems and their step-by-step solutions covering topics like simplifying expressions, factoring, addition/subtraction of fractions, and properties of real numbers.
The document provides information about math topics covered on the SAT and GRE exams. It then gives details on a math class schedule and topics to be covered over 8 weeks, including algebra with 1 and more than 1 variable, arithmetic, geometry, and advanced math questions. Handouts are provided for each topic. The last part gives strategies and examples for solving different types of math problems.
This document contains an unsolved mathematics paper from 1986 containing multiple choice and fill in the blank questions. Some of the questions relate to topics like polynomials, functions, trigonometry, vectors, probability, and geometry. The document provides context for 17 multiple choice questions in Section I and 8 fill in the blank questions in Section II for a total of 25 math problems without solutions. The reader is directed to an external website to find the solutions.
This module provides lessons on linear inequalities in two variables, including:
1) Defining linear equations and inequalities, and differentiating between the two. Linear inequalities divide the plane into two half-planes, while equations represent a single line.
2) Explaining how to read and determine solutions to linear inequalities in two variables by substituting values. Graphs of inequalities show the solution set as the shaded region.
3) Demonstrating how to graph linear inequalities by plotting the boundary line and shading the correct half-plane based on testing a point. Steps are provided to graph inequalities in slope-intercept and standard form.
4) Presenting examples of solving word problems
This document appears to be a collection of math and word problems along with their solutions. It includes sequences, equations, percentages, proportions, geometry problems (area of trapezoid), word problems involving money, and a brief definition of "resting & recharging".
This document contains a review of algebra 1 concepts including:
1) Equivalence of equations using the distributive property of multiplication over addition.
2) A statement about the order of adding or subtracting whole numbers not affecting the result.
3) Questions about evaluating expressions with radicals and exponents.
College Algebra MATH 107 Spring, 2015, V4.8 Page 1 of .docxmonicafrancis71118
This document provides instructions and requirements for a PowerPoint presentation project on a student's chosen career. The presentation must include 10-12 slides covering: an introduction of the student and research topic, an outline, background on the career path and reasons for choice, educational requirements, pay ranges in three regions, and a summary and conclusion slide. References must be in MLA format. The presentation will be graded based on inclusion of required elements, design features like themes and visual elements, transitions and animations, and correct spelling and grammar.
Gre math practice test
For Complete GRE MATH Preparation Material with Answer key and Answers description and details
http://greenhatworld.website/complete-gre-math-preparation-material/
Strategies for Effective Upskilling is a presentation by Chinwendu Peace in a Your Skill Boost Masterclass organisation by the Excellence Foundation for South Sudan on 08th and 09th June 2024 from 1 PM to 3 PM on each day.
This document provides an overview of wound healing, its functions, stages, mechanisms, factors affecting it, and complications.
A wound is a break in the integrity of the skin or tissues, which may be associated with disruption of the structure and function.
Healing is the body’s response to injury in an attempt to restore normal structure and functions.
Healing can occur in two ways: Regeneration and Repair
There are 4 phases of wound healing: hemostasis, inflammation, proliferation, and remodeling. This document also describes the mechanism of wound healing. Factors that affect healing include infection, uncontrolled diabetes, poor nutrition, age, anemia, the presence of foreign bodies, etc.
Complications of wound healing like infection, hyperpigmentation of scar, contractures, and keloid formation.
Main Java[All of the Base Concepts}.docxadhitya5119
This is part 1 of my Java Learning Journey. This Contains Custom methods, classes, constructors, packages, multithreading , try- catch block, finally block and more.
LAND USE LAND COVER AND NDVI OF MIRZAPUR DISTRICT, UPRAHUL
This Dissertation explores the particular circumstances of Mirzapur, a region located in the
core of India. Mirzapur, with its varied terrains and abundant biodiversity, offers an optimal
environment for investigating the changes in vegetation cover dynamics. Our study utilizes
advanced technologies such as GIS (Geographic Information Systems) and Remote sensing to
analyze the transformations that have taken place over the course of a decade.
The complex relationship between human activities and the environment has been the focus
of extensive research and worry. As the global community grapples with swift urbanization,
population expansion, and economic progress, the effects on natural ecosystems are becoming
more evident. A crucial element of this impact is the alteration of vegetation cover, which plays a
significant role in maintaining the ecological equilibrium of our planet.Land serves as the foundation for all human activities and provides the necessary materials for
these activities. As the most crucial natural resource, its utilization by humans results in different
'Land uses,' which are determined by both human activities and the physical characteristics of the
land.
The utilization of land is impacted by human needs and environmental factors. In countries
like India, rapid population growth and the emphasis on extensive resource exploitation can lead
to significant land degradation, adversely affecting the region's land cover.
Therefore, human intervention has significantly influenced land use patterns over many
centuries, evolving its structure over time and space. In the present era, these changes have
accelerated due to factors such as agriculture and urbanization. Information regarding land use and
cover is essential for various planning and management tasks related to the Earth's surface,
providing crucial environmental data for scientific, resource management, policy purposes, and
diverse human activities.
Accurate understanding of land use and cover is imperative for the development planning
of any area. Consequently, a wide range of professionals, including earth system scientists, land
and water managers, and urban planners, are interested in obtaining data on land use and cover
changes, conversion trends, and other related patterns. The spatial dimensions of land use and
cover support policymakers and scientists in making well-informed decisions, as alterations in
these patterns indicate shifts in economic and social conditions. Monitoring such changes with the
help of Advanced technologies like Remote Sensing and Geographic Information Systems is
crucial for coordinated efforts across different administrative levels. Advanced technologies like
Remote Sensing and Geographic Information Systems
9
Changes in vegetation cover refer to variations in the distribution, composition, and overall
structure of plant communities across different temporal and spatial scales. These changes can
occur natural.
Philippine Edukasyong Pantahanan at Pangkabuhayan (EPP) CurriculumMJDuyan
(𝐓𝐋𝐄 𝟏𝟎𝟎) (𝐋𝐞𝐬𝐬𝐨𝐧 𝟏)-𝐏𝐫𝐞𝐥𝐢𝐦𝐬
𝐃𝐢𝐬𝐜𝐮𝐬𝐬 𝐭𝐡𝐞 𝐄𝐏𝐏 𝐂𝐮𝐫𝐫𝐢𝐜𝐮𝐥𝐮𝐦 𝐢𝐧 𝐭𝐡𝐞 𝐏𝐡𝐢𝐥𝐢𝐩𝐩𝐢𝐧𝐞𝐬:
- Understand the goals and objectives of the Edukasyong Pantahanan at Pangkabuhayan (EPP) curriculum, recognizing its importance in fostering practical life skills and values among students. Students will also be able to identify the key components and subjects covered, such as agriculture, home economics, industrial arts, and information and communication technology.
𝐄𝐱𝐩𝐥𝐚𝐢𝐧 𝐭𝐡𝐞 𝐍𝐚𝐭𝐮𝐫𝐞 𝐚𝐧𝐝 𝐒𝐜𝐨𝐩𝐞 𝐨𝐟 𝐚𝐧 𝐄𝐧𝐭𝐫𝐞𝐩𝐫𝐞𝐧𝐞𝐮𝐫:
-Define entrepreneurship, distinguishing it from general business activities by emphasizing its focus on innovation, risk-taking, and value creation. Students will describe the characteristics and traits of successful entrepreneurs, including their roles and responsibilities, and discuss the broader economic and social impacts of entrepreneurial activities on both local and global scales.
বাংলাদেশের অর্থনৈতিক সমীক্ষা ২০২৪ [Bangladesh Economic Review 2024 Bangla.pdf] কম্পিউটার , ট্যাব ও স্মার্ট ফোন ভার্সন সহ সম্পূর্ণ বাংলা ই-বুক বা pdf বই " সুচিপত্র ...বুকমার্ক মেনু 🔖 ও হাইপার লিংক মেনু 📝👆 যুক্ত ..
আমাদের সবার জন্য খুব খুব গুরুত্বপূর্ণ একটি বই ..বিসিএস, ব্যাংক, ইউনিভার্সিটি ভর্তি ও যে কোন প্রতিযোগিতা মূলক পরীক্ষার জন্য এর খুব ইম্পরট্যান্ট একটি বিষয় ...তাছাড়া বাংলাদেশের সাম্প্রতিক যে কোন ডাটা বা তথ্য এই বইতে পাবেন ...
তাই একজন নাগরিক হিসাবে এই তথ্য গুলো আপনার জানা প্রয়োজন ...।
বিসিএস ও ব্যাংক এর লিখিত পরীক্ষা ...+এছাড়া মাধ্যমিক ও উচ্চমাধ্যমিকের স্টুডেন্টদের জন্য অনেক কাজে আসবে ...
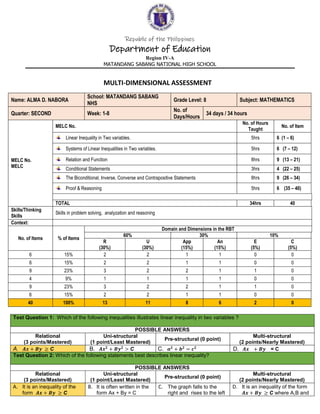
1. Republic of the Philippines
Department of Education
Region IV-A
MATANDANG SABANG NATIONAL HIGH SCHOOL
MULTI-DIMENSIONAL ASSESSMENT
Test Question 1: Which of the following inequalities illustrates linear inequality in two variables ?
POSSIBLE ANSWERS
Relational
(3 points/Mastered)
Uni-structural
(1 point/Least Mastered)
Pre-structural (0 point)
Multi-structural
(2 points/Nearly Mastered)
A. 𝑨𝒙 + 𝑩𝒚 ≥ C B. 𝑨𝒙𝟐
+ 𝑩𝒚𝟐
> C C. 𝒂𝟐
+ 𝒃𝟐
= 𝒄𝟐
D. 𝑨𝒙 + 𝑩𝒚 = C
Test Question 2: Which of the following statements best describes linear inequality?
POSSIBLE ANSWERS
Relational
(3 points/Mastered)
Uni-structural
(1 point/Least Mastered)
Pre-structural (0 point)
Multi-structural
(2 points/Nearly Mastered)
A. It is an inequality of the
form 𝑨𝒙 + 𝑩𝒚 ≥ C
B. It is often written in the
form Ax + By = C
C. The graph falls to the
right and rises to the left
D. It is an inequality of the form
𝑨𝒙 + 𝑩𝒚 ≥ C where A,B and
Name: ALMA D. NABORA
School: MATANDANG SABANG
NHS
Grade Level: 8 Subject: MATHEMATICS
Quarter: SECOND Week: 1-8
No. of
Days/Hours
34 days / 34 hours
MELC No.
MELC
MELC No.
No. of Hours
Taught
No. of Item
Linear Inequality in Two variables. 5hrs 6 (1 – 6)
Systems of Linear Inequalities in Two variables. 5hrs 6 (7 – 12)
Relation and Function 8hrs 9 (13 – 21)
Conditional Statements 3hrs 4 (22 – 25)
The Biconditional, Inverse, Converse and Contrapositive Statements 8hrs 9 (26 – 34)
Proof & Reasoning 5hrs 6 (35 – 40)
TOTAL 34hrs 40
Skills/Thinking
Skills
Skills in problem solving, analyzation and reasoning
Context:
No. of Items % of Items
Domain and Dimensions in the RBT
60% 30% 10%
R
(30%)
U
(30%)
App
(15%)
An
(15%)
E
(5%)
C
(5%)
6 15% 2 2 1 1 0 0
6 15% 2 2 1 1 0 0
9 23% 3 2 2 1 1 0
4 9% 1 1 1 1 0 0
9 23% 3 2 2 1 1 0
6 15% 2 2 1 1 0 0
40 100% 13 11 8 6 2 0
2. where A,B and C are real
numbers and A and B are
both non zero.
C are real numbers and A
and B are both negative
integers.
Test Question 3: How many solution does the linear inequality have ?
POSSIBLE ANSWERS
Relational
(3 points/Mastered)
Uni-structural
(1 point/Least Mastered)
Pre-structural (0 point)
Multi-structural
(2 points/Nearly Mastered)
A. Infinite
B. 2 C. 0 D. 3 - 5
Test Question 4: Which of the following graph represent of linear inequality in two variables ?
POSSIBLE ANSWERS
Relational
(3 points/Mastered)
Uni-structural
(1 point/Least Mastered)
Pre-structural (0 point)
Multi-structural
( 2 points/Nearly Mastered)
A.
B. C. D.
Test Question 5: A restaurant owner would like to make a model which he can use as guide in writing a linear inequality in two
variables. He will use the inequality in determining the number of kilograms of pork and beef that he need to purchase
dailygiven a certain amount of money I, the cost (A) of a kilo of pork, the cost (B) of a kilo of beef. Which of the following
models should he make and follow ?
I. Ax + By ≤ C II. Ax + By = C III. Ax + By ≥ C
POSSIBLE ANSWERS
Multi-structural
(2 points/Nearly Mastered)
Pre-structural (0 point)
Uni-structural
(1 point/Least Mastered)
Relational
(3 points/Mastered)
A. I, II and III B. III only C. I and III
E. I and II
Test Question 6: Which of the following ordered pairs is a solution of the inequality 2x + 6y ≤ 10 are true?
POSSIBLE ANSWERS
Multi-structural
(2 points/Nearly Mastered)
Pre-structural (0 point)
Uni-structural
(1 point/Least Mastered)
Relational
(3 points/Mastered)
A. (-1, 1) (1,1) (3, 1) B. (2, 2) C. (1, 2) (1, 0) D. (1, 0) (-1, 1) (1,1)
Test Question 7: Which of the following is a system of linear inequalities in two variables ?
POSSIBLE ANSWERS
Multi-structural
(2 points/Nearly Mastered)
Pre-structural (0 point)
Uni-structural
(1 point/Least Mastered)
Relational
(3 points/Mastered)
A. {3x + 5y = -2 ; x – 4y > 9} B. (x, y) C. x – 4y > 9
D. {𝑥 + 9𝑦 ≤ 2 ; 2𝑥 − 3𝑦 > 12}
Test Question 8: Which of the following graph represent of system of linear inequality in two variables ?
POSSIBLE ANSWERS
Multi-structural
(2 points/Nearly Mastered)
Pre-structural (0 point)
Uni-structural
(1 point/Least Mastered)
Relational
(3 points/Mastered)
A. B. C. D.
3. For Item no. 9 – 10: Below is the graph of system of linear inequalities in two variables x – 2y<6 and x + 2y ≤ 4 if point:
A (3,3) B (0,2) C (0, -3) D (2 , 0)
Test Question 9: Which coordinates are part of the solution set of x + 2y ≤ 4 only ?
POSSIBLE ANSWERS
Pre-structural (0 point)
Relational
(3 points/Mastered)
Multi-structural
(2 points/Nearly Mastered)
Uni-structural
(1 point/Least Mastered)
A. (0, 0) B.(0, −3 ) ( 2, 0 ) C. (0, −3) (0,2) D. (3,3)
Test Question 10: Which coordinates are part of the solution set of the system ?
A (3,3) B (0,2) C (0, -3) D (-4 , 0)
POSSIBLE ANSWERS
Pre-structural (0 point)
Relational
(3 points/Mastered)
Multi-structural
(2 points/Nearly Mastered)
Uni-structural
(1 point/Least Mastered)
A. All of the above B. C and D C. A, B, and C D. B only
Test Question 11: Given: y + x >2
y ≤ 3x – 2
Which graph shows the solution of the given set of inequalities ?
POSSIBLE ANSWERS
Pre-structural (0 point)
Relational
(3 points/Mastered)
Multi-structural
(2 points/Nearly Mastered)
Uni-structural
(1 point/Least Mastered)
A. B. C.
D.
Test Question 12: Which pair DOES NOT satisfy the system of linear inequation in two variables x + 25 > 5 and
2x – y ≤ 2 ?
A. (5, 1) B. (3, 3) C. (2, 8) D. (-4, 6)
POSSIBLE ANSWERS
Pre-structural (0 point)
Relational
(3 points/Mastered)
Multi-structural
(2 points/Nearly Mastered)
Uni-structural
(1 point/Least Mastered)
A. All of the above B. C and D C. C and A D. A only
Test Question 13: Which of the term refer to the set of ordered pairs of the second element ?
POSSIBLE ANSWERS
Uni-structural
(1 point/Least Mastered)
Multi-structural
(2 points/Nearly
Mastered)
Relational
(3 points/Mastered)
Pre-structural (0 point)
4. A. Domain B. Ordinate C. Range D. Abscissa
Test Question 14: What is the set of all first entries in ordered pairs?
POSSIBLE ANSWERS
Uni-structural
(1 point/Least Mastered)
Multi-structural
(2 points/Nearly
Mastered)
Relational
(3 points/Mastered)
Pre-structural (0 point)
A. Ordinate B. Domain C. Abscissa D. Range
Test Question 15: Which of the given term refer to the relation between two variables in which every first element is
associated with one and only one in second element?
Uni-structural
(1 point/Least Mastered)
Multi-structural
(2 points/Nearly
Mastered)
Relational
(3 points/Mastered)
Pre-structural (0 point)
A. Not Relation B. Relation C. Function D. Range
Test Question 16: Which of the following sets of ordered pairs defines a function ?
A. {(3,2), (-3, 6), (3, -2)} B. {(1, 2), (2, 6), (3, -2)} C. {(2, 2), (1, 3), (3, 4)} D.{(4, 4), (-3, 4), (4, -4)}
POSSIBLE ANSWERS
Uni-structural
(1 point/Least Mastered)
Multi-structural
(2 points/Nearly
Mastered)
Relational
(3 points/Mastered)
Pre-structural (0 point)
A. A and B B. B only C. B and C D. All of the above
Test Question 17: What is the relation of the set of ordered pairs {(2, -3), (1, 0), (2, 3)} ?
POSSIBLE ANSWERS
Relational
(3 points/Mastered)
Uni-structural
(1 point/Least Mastered)
Pre-structural (0 point)
Multi-structural
(2 points/Nearly Mastered)
A. Many to One B. Many to Many C. One to One D. One to Many
Test Question 18: In the set of ordered pairs below, what is the domain ?
{(-3, 1), (-2, 2), (-1, 3), (0, 4)}
POSSIBLE ANSWERS
Relational
(3 points/Mastered)
Uni-structural
(1 point/Least Mastered)
Pre-structural (0 point)
Multi-structural
(2 points/Nearly Mastered)
A. {-3, -2, -1, 0} B. {-3, 1, 4, 3} C. { -4, -5, -10, 2} D. {-3, -2, -1}
Test Question 19: In the given mapping diagram, what is the relation between the two element ?
POSSIBLE ANSWERS
Relational
(3 points/Mastered)
Uni-structural
(1 point/Least Mastered)
Pre-structural (0 point)
Multi-structural
(2 points/Nearly Mastered)
A. One to Many B. One to One C. One is toTwo D. Many to One
Test Question 20: Given the domain {1, 2, 3, 4, 5}, Which is the correct sets of ordered pairs that “ Range is thrice the domain ?
I = { (1, 3), (2, 6), (3, 9), (4, 12), (5, 15)} III = { (0, 3), (2, 0), (-3, 9), (4, -12), (5, -15)}
II = { (1,3), (1, 2), (2, 3), (3, 4), (4, 5)} IV = { (1, 3), (2, 6), (3, -9), (4, 12), (5, 15)}
POSSIBLE ANSWERS
Relational
(3 points/Mastered)
Uni-structural
(1 point/Least Mastered)
Pre-structural (0 point)
Multi-structural
(2 points/Nearly Mastered)
A. I B. II C. III D. IV
Test Question 21: Given the function f(x) = 3x – 6; f(-3) and f(0). Which are the correct value ?
I. -15 and -6 II. -3 and -6 III. 0 and 1 IV. -15 and 6
POSSIBLE ANSWERS
Multi-structural
(2 points/Nearly Mastered)
Pre-structural (0 point)
Uni-structural
(1 point/Least Mastered)
Relational
(3 points/Mastered)
A. IV B. III C. II D. I
5. Test Question 22: Which of the given are the part of conditional statement ?
I. Is and On II. If and of III. If and Then IV. Now and Then
POSSIBLE ANSWERS
Multi-structural
(2 points/Nearly Mastered)
Pre-structural (0 point)
Uni-structural
(1 point/Least Mastered)
Relational
(3 points/Mastered)
A. II and IV B. I C. II D. III
Test Question 23: Which of the given statement is true about the conditional statement ?
I. It is also called an If – Then statement.
II. A conditional statement has always false statement.
III. A conditional statement has a truth value of true or false.
IV. All of the above
POSSIBLE ANSWERS
Multi-structural
(2 points/Nearly Mastered)
Pre-structural (0 point)
Uni-structural
(1 point/Least Mastered)
Relational
(3 points/Mastered)
A. I, II, III B. IV C. I only D. I and III
For Item no. 24 – 25: Given the statement:
“ One half of the number is 12, the number is 24”
Test Question 24: Which is the correct conditional statement?
POSSIBLE ANSWERS
Multi-structural
(2 points/Nearly Mastered)
Pre-structural (0 point)
Uni-structural
(1 point/Least Mastered)
Relational
(3 points/Mastered)
A. If One half of the number
is 12 then the number is
24
B.
1
2
of 12 = 24
C. The One half of the
number is 12, if the number
is 24
D. If one half of the number is 12,
then the number is 24.
Test Question 25: Given the statement above, which are the hypothesis and conclusion ?
POSSIBLE ANSWERS
Pre-structural (0 point)
Relational
(3 points/Mastered)
Multi-structural
(2 points/Nearly Mastered)
Uni-structural
(1 point/Least Mastered)
A. H: 12
C: 24
B. H: One half of the
number is 12.
C: The number is 24
C. H: 12 is the one half of
number.
C: The number is 24,
D. H: one half of 24
C: The number is 12,
Test Question 26: Which statement is true about converse statement ?
I. Converse statement can be formed by switching/reversing the hypothesis and conclusion of a conditional
statement.
II. It can be formed by negating the hypothesis and the conclusion of the conditional statement.
III. Converse statement can be formed interchanging the roles of hypothesis and conclusion of the if and
then statement.
IV. We composed this statement by interchanging the hypothesis and conclusion of the inverse of the same
conditional statement.
POSSIBLE ANSWERS
Pre-structural (0 point)
Relational
(3 points/Mastered)
Multi-structural
(2 points/Nearly Mastered)
Uni-structural
(1 point/Least Mastered)
A. II B. I and III C. all of the above D. I
Test Question 27: Which statement is true about inverse statement ?
I. Converse statement can be formed by switching/reversing the hypothesis and conclusion of a conditional
statement.
II. It can be formed by negating the hypothesis and the conclusion of the conditional statement.
III. Converse statement can be formed interchanging the roles of hypothesis and conclusion of the if and
then statement.
IV. We composed this statement by interchanging the hypothesis and conclusion of the inverse of the same
conditional statement.
POSSIBLE ANSWERS
Pre-structural (0 point)
Relational
(3 points/Mastered)
Multi-structural
(2 points/Nearly Mastered)
Uni-structural
(1 point/Least Mastered)
A. all of the above B. II C. IV D. III
6. Test Question 28: Which of the given statement is true about the conditional statement ?
I. It is also called an If – Then statement.
II. A conditional statement has always false statement.
III. A conditional statement has a truth value of true or false.
IV. All of the above
POSSIBLE ANSWERS
Pre-structural (0 point)
Relational
(3 points/Mastered)
Multi-structural
(2 points/Nearly Mastered)
Uni-structural
(1 point/Least Mastered)
A. IV B. I and III C. I, II, III D. I
Test Question 29: Which symbols indicate a converse statement if: p is the hypothesis and q is the conclusion ? such as:
p→q
POSSIBLE ANSWERS
Uni-structural
(1 point/Least Mastered)
Multi-structural
(2 points/Nearly
Mastered)
Relational
(3 points/Mastered)
Pre-structural (0 point)
A. p → x B. p → q C. q → p D. ~𝑝 → ~𝑞
Test Question 30: Which is the symbolic representation of the contrapositive conditional statement if p is the hypothesis and
q is the conclusion ?
POSSIBLE ANSWERS
Uni-structural
(1 point/Least Mastered)
Multi-structural
(2 points/Nearly
Mastered)
Relational
(3 points/Mastered)
Pre-structural (0 point)
A. p → q B. q → p C. ~𝑞 → ~𝑝 D. p → x
Test Question 31: Which is the symbolic representation of the inverse statement if p is the hypothesis and
q is the conclusion ?
POSSIBLE ANSWERS
Uni-structural
(1 point/Least Mastered)
Multi-structural
(2 points/Nearly
Mastered)
Relational
(3 points/Mastered)
Pre-structural (0 point)
A. q → p B. ~𝑞 → ~𝑝 C. ~𝑝 → ~𝑞 D. p → x
Test Question 32: Which is the contrapositive of the statement: “ If an angle measures exactly 90⁰ , then it is a right angle ?
I. If an angle is right, then it measures exactly 90⁰.
II. If an angle do not measures exactly 90⁰, then it is not right angle.
III. If an angle is not right, then it does not measure exactly 90⁰.
IV. An angle is right if and only if it measures exactly 90⁰.
POSSIBLE ANSWERS
Uni-structural
(1 point/Least Mastered)
Multi-structural
(2 points/Nearly
Mastered)
Relational
(3 points/Mastered)
Pre-structural (0 point)
A. II B. II and III C. III D. I
Test Question 33: Which statement is the converse “If a number is divisible by 9, then the sum of its digits is divisible by 9?
I. If the number is not divisible by 9, then the sum of its digits is not divisible by 9.
II. If the sum of the digits of a number is divisible by 9, then it is divisible by 9.
III. If the number is divisible by 9, then the sum of its digit is not divisible by 9.
IV. If the sum of the digits of a number is not divisible by 9, then it is not divisible by 9.
POSSIBLE ANSWERS
Relational
(3 points/Mastered)
Uni-structural
(1 point/Least Mastered)
Pre-structural (0 point)
Multi-structural
(2 points/Nearly Mastered)
A. II B. III C. All of the above D. II and III
Test Question 34: Given the statement: “ A man is honest, he does not steal” which is the biconditional statement ?
POSSIBLE ANSWERS
Relational
(3 points/Mastered)
Uni-structural
(1 point/Least Mastered)
Pre-structural (0 point)
Multi-structural
(2 points/Nearly Mastered)
A. A man is honest if and
only if he does not steal.
B. If a man is honest, then
he does not steal.
C. If he does not steal, then
he is honest.
D. Both A and C
Test Question 35: Which term refers to logical way of thinking.
7. POSSIBLE ANSWERS
Multi-structural
(2 points/Nearly Mastered)
Pre-structural (0 point)
Uni-structural
(1 point/Least Mastered)
Relational
(3 points/Mastered)
A. Proving B. Arguing C. Negating D. Reasoning
Test Question 36: Which symbol read as “p implies to q” ?
POSSIBLE ANSWERS
Multi-structural
(2 points/Nearly Mastered)
Pre-structural (0 point)
Uni-structural
(1 point/Least Mastered)
Relational
(3 points/Mastered)
A. q → p B. x + y C. p ↔ q D. p → q
Test Question 37: Which is a symbolic representation of biconditional statement ?
POSSIBLE ANSWERS
Pre-structural (0 point)
Relational
(3 points/Mastered)
Multi-structural
(2 points/Nearly Mastered)
Uni-structural
(1 point/Least Mastered)
A. x + y B. p ↔ q C. p → q D. q → p
Test Question 38: Which proof also known as proof by contradiction ?
POSSIBLE ANSWERS
Pre-structural (0 point)
Relational
(3 points/Mastered)
Multi-structural
(2 points/Nearly Mastered)
Uni-structural
(1 point/Least Mastered)
A. Two column proof B. Indirect proof C. Direct proof D. Formal proof
Test Question 39: Which law state that: If p → q is a true conditional statement, p is true and q is true ?
POSSIBLE ANSWERS
Uni-structural
(1 point/Least Mastered)
Multi-structural
(2 points/Nearly
Mastered)
Relational
(3 points/Mastered)
Pre-structural (0 point)
A. Law or reasoning B. Law of Syllogism C. Law of Detachment D. Law of Integers
Test Question 40: Which is the correct statement if “ x = - 5 and / x / = 5 write in p → q ?
POSSIBLE ANSWERS
Uni-structural
(1 point/Least Mastered)
Multi-structural
(2 points/Nearly
Mastered)
Relational
(3 points/Mastered)
Pre-structural (0 point)
A. If x = 5, then x = -5 B. If /x/ = 5, then x = -5 C. If x = -5, then /x / = 5 D. X + 5 = - 5
Prepared by:
ALMA D. NABORA
Teacher II
Checked by:
MARIA ANGELIE F. PAZ
Teacher III
Noted:
SILVER A. BANDOL
Head Teacher I
ANGELITO A. OLVIDA
PSDS Catanauan II