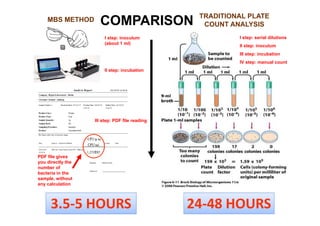
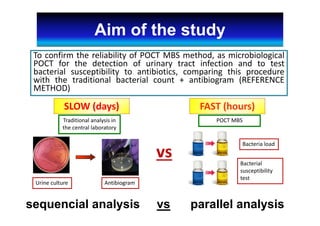
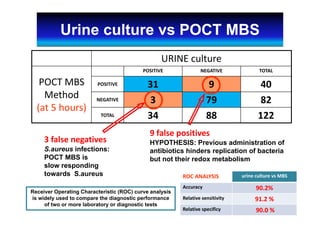
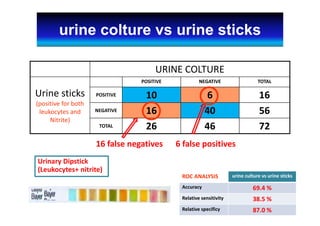
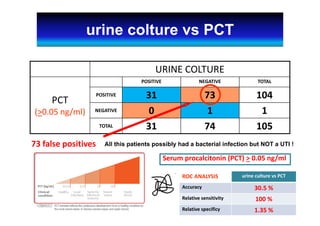
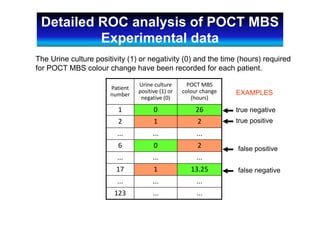
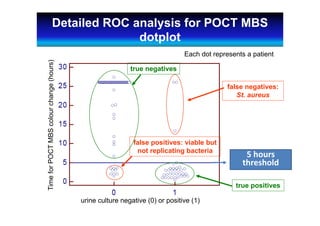
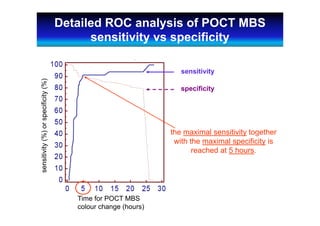
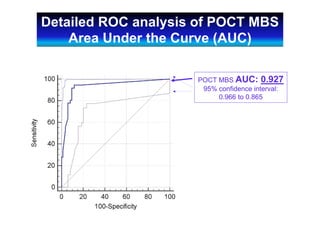
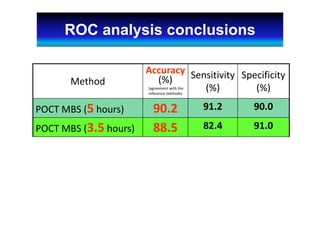
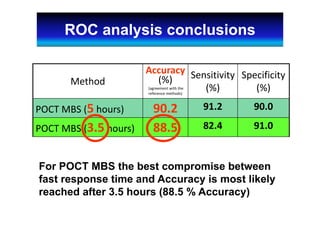
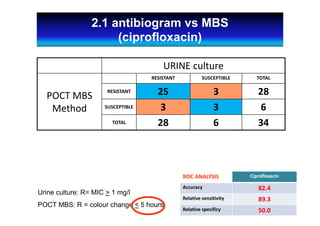
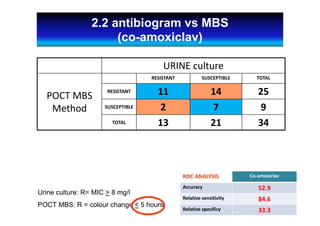
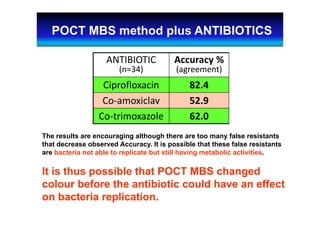
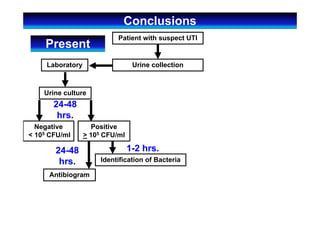
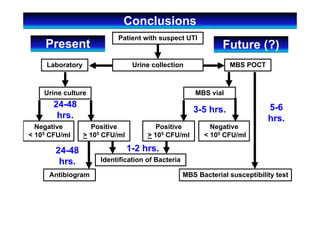
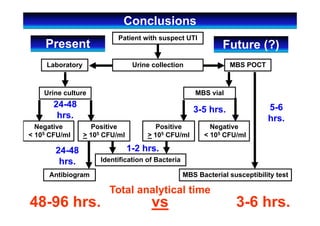
Giovanni  Antonini (giovanni.antonini@uniroma3.it)
Utilizzo del metodo MBS per la
diagnosi rapida delle infezioni
delle vie urinarie
“Clinically detectable
condition associated
with invasion by
disease causing
microorganism of
some part of the 
urinary tract”
(Wang A et al.,Prim Care. 2013 Sep;40(3):687‐706).
Significant bacteriuria ≥ 105 CFU/ml
(M. S. Najar et al., Indian J Nephrol. Oct 2009)
Center for Disease Control and Prevention (CDC 1988)
Urinary Tract Infection (UTI)
UTI is the most common 
nosocomial infection and the 
second most frequent infections
of all Emergency admissions
80% of infections are associated 
with the use of an indwelling
bladder catheter
Prevention of hospital‐acquired infections, WHO/CDS/CSR/EPH/2002.12
National Nosocomial Infections Surveillance (NNIS)
11
The incidence of UTI 
varies according           
to sex and age
Mostly observed in 
women
Epidemiology of UTIPrevalence(%)
M
W
Children Young Elderly 65-85 Elderly >85
80%
7%
6% 4% 3%
Community‐acquired UTI
E. coli
Other
P.mirabilis
K.pneumoniae, P.aeruginosa
38%
24%
15%
12%
11%
Hospital‐acquired UTI
E. coli
K.pneumoniae, P.aeruginosa
S.epidermidis, S.aureus, S.faecalis
Other
P.mirabilis
Wang et al. , Prim Care. 2013 Sep;40(3):687‐706.
Eziology of UTI
(traditional)
1-2 days for bacterial count (diagnosis)
+ other 1-2 days for antibiogram (therapy)
Colony count on 
solid medium
Antimicrobial 
susceptibility tests 
LABORATORY DIAGNOSIS of UTI
The Micro Biological Survey (MBS) method is a colorimetric 
system  developed for the selective detection and quantification 
of microrganisms present in food, water or on surfaces.
Disposable vials
•Ready to Use
•Pre-filled
•No sample pretreatment
•No Lab required
•Bacterial reaction causes colour change
MBS multireader
•automatic color changes detection
•automatic bacteria counts
•automatic supply of an analysis report
Log cfu/ml
Color change time (hrs.)
Linear regression
The analytical principle of MBS method is based on
measuring metabolism of bacteria
using redox indicators (dyes).
Greater the
number of living
bacteria, faster
the colour
change
COMPARISONMBS METHOD
I step: inoculum
(about 1 ml)
III step: PDF file reading
PDF file gives
you directly the
number of
bacteria in the
sample, without
any calculation
II step: incubation
I step: serial dilutions
II step: inoculum
III step: incubation
IV step: manual count
TRADITIONAL PLATE
COUNT ANALYSIS
3.5‐5 HOURS 24‐48 HOURS
To confirm the reliability of POCT MBS method, as microbiological
POCT for the detection of urinary tract infection and to test
bacterial susceptibility to antibiotics, comparing this procedure
with the traditional bacterial count + antibiogram (REFERENCE
METHOD)
vs
POCT MBS
Urine culture Antibiogram
SLOW (days) FAST (hours)
Aim of the study
Bacteria load
Bacterial 
susceptibility 
test
Traditional analysis in 
the central laboratory
sequencial analysis vs parallel analysis
Use of POCT MBS to evaluate
the bacterial load in urine
Clinical study
122 subjects have been enrolled between
November 2013 and July 2014 in Emergency Room 
with clinically suspected Urinary tract infections
89% with urinary catheter
Patients
Age (years)
Receiver Operating Characteristic (ROC) curve analysis used to compare
the diagnostic performance of two or more laboratory or diagnostic tests
(Griner et al., Annals of Internal Medicine 94:555-600, 1981).
Reference method
Alternative 
method
POSITIVE NEGATIVE TOTAL
POSITIVE
CP (positive agreement) DP (positive deviation: 
false positives)
(total positives for 
alternative method)
NEGATIVE
DN (negative deviation: 
false negatives) 
CN (negative 
agreement) 
(total negatives for 
alternative method)
TOTAL
N+ (total positives for 
reference method)
N‐ (total negatives for 
reference method)
N (total number of 
test)
ACCURACY is the percentage of agreement between the two methods
(positive agreement + negative agreement)/total number of tests
AC = Relative accuracy : The relative accuracy is the degree of correspondence between
the response obtained by the alternative method and the Reference methods.
SE = Relative sensitivity : The relative sensitivity is the ability of the alternative method to
detect the analyte compared to the Reference methods.
SP = Relative Specificity : The relative specificity is the ability of the alternative method
not to detect the target microorganism when it is not detected by the Reference methods.
ROC analysis
URINE culture
POCT MBS
Method  
(at 5 hours)
POSITIVE NEGATIVE TOTAL
POSITIVE 31 9 40
NEGATIVE 3 79 82
TOTAL 34 88 122
ROC ANALYSIS urine culture vs MBS
Accuracy 90.2%
Relative sensitivity 91.2 %
Relative specificy 90.0 %
9 false positives
HYPOTHESIS: Previous administration of
antibiotics hinders replication of bacteria
but not their redox metabolism
3 false negatives
S.aureus infections:
POCT MBS is
slow responding
towards S.aureus
Urine culture vs POCT MBS
Receiver Operating Characteristic (ROC) curve analysis
is widely used to compare the diagnostic performance
of two or more laboratory or diagnostic tests
URINE COLTURE
Urine sticks
(positive for both
leukocytes and 
Nitrite)
POSITIVE NEGATIVE TOTAL
POSITIVE 10 6 16
NEGATIVE 16 40 56
TOTAL 26 46 72
ROC ANALYSIS urine culture vs urine sticks
Accuracy 69.4 %
Relative sensitivity 38.5 %
Relative specificy 87.0 %
6 false positives16 false negatives
urine colture vs urine sticks
Urinary Dipstick
(Leukocytes+ nitrite)
URINE COLTURE
PCT 
(>0.05 ng/ml)
POSITIVE NEGATIVE TOTAL
POSITIVE 31 73 104
NEGATIVE 0 1 1
TOTAL 31 74 105
ROC ANALYSIS urine culture vs PCT
Accuracy 30.5 %
Relative sensitivity 100 %
Relative specificy 1.35 %
73 false positives All this patients possibly had a bacterial infection but NOT a UTI !
urine colture vs PCT
Serum procalcitonin (PCT) > 0.05 ng/ml
Patient 
number
Urine culture 
positive (1) or 
negative (0)
POCT MBS 
colour change 
(hours)
1 0 26
2 1 2
... ... ...
6 0 2
... ... ...
17 1 13.25
... ... ...
123 ... ...
The Urine culture positivity (1) or negativity (0) and the time (hours) required
for POCT MBS colour change have been recorded for each patient.
true positive
true negative
EXAMPLES
false positive
false negative
Detailed ROC analysis of POCT MBS
Experimental data
Each dot represents a patient
TimeforPOCTMBScolourchange(hours)
urine culture negative (0) or positive (1)
true negatives
true positives
false positives: viable but
not replicating bacteria
false negatives:
St. aureus
5 hours 
threshold
Detailed ROC analysis for POCT MBS
dotplot
Time for POCT MBS
colour change (hours)
sensitivity(%)orspecificity(%)
sensitivity
specificity
the maximal sensitivity together
with the maximal specificity is
reached at 5 hours.
Detailed ROC analysis of POCT MBS
sensitivity vs specificity
POCT MBS AUC: 0.927
95% confidence interval:
0.966 to 0.865
Detailed ROC analysis of POCT MBS
Area Under the Curve (AUC)
Method
Accuracy 
(%)
(agreement with the 
reference methods) 
Sensitivity
(%)
Specificity
(%)
POCT MBS (5 hours) 90.2 91.2 90.0
POCT MBS (3.5 hours) 88.5 82.4 91.0
ROC analysis conclusions
Method
Accuracy 
(%)
(agreement with the 
reference methods) 
Sensitivity
(%)
Specificity
(%)
POCT MBS (5 hours) 90.2 91.2 90.0
POCT MBS (3.5 hours) 88.5 82.4 91.0
For POCT MBS the best compromise between
fast response time and Accuracy is most likely
reached after 3.5 hours (88.5 % Accuracy)
ROC analysis conclusions
Use of POCT MBS to evaluate
the resistance/susceptibility
to antibiotics of bacteria
causing UTI
Co‐
trimoxazole
Vials + antibiotics
Amoxicillin‐
Clavulanate
CiprofloxacinNO Antibiotic
POCT MBS method plus ANTIBIOTICS
Patients’ urine was added to
ROC ANALYSIS Ciprofloxacin
Accuracy 82.4
Relative sensitivity 89.3
Relative specificy 50.0
URINE culture
POCT MBS
Method  
RESISTANT SUSCEPTIBLE TOTAL
RESISTANT 25 3 28
SUSCEPTIBLE 3 3 6
TOTAL 28 6 34
Urine culture: R= MIC > 1 mg/l
POCT MBS: R = colour change < 5 hours
2.1 antibiogram vs MBS
(ciprofloxacin)
ROC ANALYSIS Co‐amoxiclav
Accuracy 52.9
Relative sensitivity 84.6
Relative specificy 33.3
URINE culture
POCT MBS
Method  
RESISTANT SUSCEPTIBLE TOTAL
RESISTANT 11 14 25
SUSCEPTIBLE 2 7 9
TOTAL 13 21 34
Urine culture: R= MIC > 8 mg/l
POCT MBS: R = colour change < 5 hours
2.2 antibiogram vs MBS
(co-amoxiclav)
ROC ANALYSIS Co‐trimoxazole
Accuracy 62.0
Relative sensitivity 82.6
Relative specificy 27.3
URINE culture
POCT MBS
Method  
RESISTANT SUSCEPTIBLE TOTAL
RESISTANT 19 9 28
SUSCEPTIBLE 4 2 6
TOTAL 23 11 34
Urine culture: R= MIC > 4 mg/l
POCT MBS: R = colour change < 5 hours
2.3 antibiogram vs MBS
(co-trimoxazole)
ANTIBIOTIC
(n=34)
Accuracy %
(agreement)
Ciprofloxacin 82.4
Co‐amoxiclav 52.9
Co‐trimoxazole 62.0
The results are encouraging although there are too many false resistants
that decrease observed Accuracy. It is possible that these false resistants
are bacteria not able to replicate but still having metabolic activities.
It is thus possible that POCT MBS changed
colour before the antibiotic could have an effect
on bacteria replication.
POCT MBS method plus ANTIBIOTICS
Conclusions
Patient with suspect UTI
Urine collectionLaboratory
Urine culture
24-48
hrs.
Positive
> 105 CFU/ml
Negative
< 105 CFU/ml
Identification of Bacteria
24-48
hrs.
Antibiogram
Present
1-2 hrs.
Conclusions
Patient with suspect UTI
Urine collectionLaboratory MBS POCT
Urine culture MBS vial
24-48
hrs.
1-2 hrs.
Positive
> 105 CFU/ml
Negative
< 105 CFU/ml
Positive
> 105 CFU/ml
Negative
< 105 CFU/ml
Identification of Bacteria
24-48
hrs.
Antibiogram
5-6
hrs.
MBS Bacterial susceptibility test
Present Future (?)
3-5 hrs.
Conclusions
Patient with suspect UTI
Urine collectionLaboratory MBS POCT
Urine culture MBS vial
24-48
hrs.
3-5 hrs.
Positive
> 105 CFU/ml
Negative
< 105 CFU/ml
Positive
> 105 CFU/ml
Negative
< 105 CFU/ml
Identification of Bacteria
24-48
hrs.
Antibiogram
5-6
hrs.
MBS Bacterial susceptibility test
Present Future (?)
1-2 hrs.
Total analytical time
48-96 hrs. vs 3-6 hrs.
Prof. Giovanni Antonini, Prof. Paolo Visca,
dr.ssa Alyexandra Arienzo,
dr.ssa Valentina Cellitti, dr.ssa Valeria Ferrante
Prof. Salvatore Di Somma,
dr.ssa Flavia Cristofano
Ing. Alberto Mari, dr.ssa Giorgia Bottini,
dr.ssa Francesca Losito, dr.ssa Francesca R. Priolisi
Ing. Filippo Ugolini, ing. Tommaso Buranelli
Dr.ssa Cinzia Auriti, dr. Guido Castelli Gattinara
Collaborations
Prof. Roberto Messi
Acknowledgements
Partially supported by FILAS spa
(Regional Agency for the promotion of
development and innovation)
[grant number FILAS- RS-2009-1026]

Mbs uti presentation

  • 1.
    Giovanni  Antonini (giovanni.antonini@uniroma3.it) Utilizzo del metodoMBS per la diagnosi rapida delle infezioni delle vie urinarie
  • 2.
    “Clinically detectable condition associated withinvasion by disease causing microorganism of some part of the  urinary tract” (Wang A et al.,Prim Care. 2013 Sep;40(3):687‐706). Significant bacteriuria ≥ 105 CFU/ml (M. S. Najar et al., Indian J Nephrol. Oct 2009) Center for Disease Control and Prevention (CDC 1988) Urinary Tract Infection (UTI)
  • 3.
    UTI is the most common  nosocomial infection and the  second mostfrequent infections of all Emergency admissions 80% of infections are associated  with the use of an indwelling bladder catheter Prevention of hospital‐acquired infections, WHO/CDS/CSR/EPH/2002.12 National Nosocomial Infections Surveillance (NNIS) 11 The incidence of UTI  varies according            to sex and age Mostly observed in  women Epidemiology of UTIPrevalence(%) M W Children Young Elderly 65-85 Elderly >85
  • 4.
  • 5.
    (traditional) 1-2 days forbacterial count (diagnosis) + other 1-2 days for antibiogram (therapy) Colony count on  solid medium Antimicrobial  susceptibility tests  LABORATORY DIAGNOSIS of UTI
  • 6.
    The Micro Biological Survey (MBS) method is a colorimetric  system  developed for the selective detection and quantification  of microrganisms present in food, water or on surfaces. Disposablevials •Ready to Use •Pre-filled •No sample pretreatment •No Lab required •Bacterial reaction causes colour change MBS multireader •automatic color changes detection •automatic bacteria counts •automatic supply of an analysis report
  • 7.
    Log cfu/ml Color change time (hrs.) Linear regression The analytical principleof MBS method is based on measuring metabolism of bacteria using redox indicators (dyes). Greater the number of living bacteria, faster the colour change
  • 8.
    COMPARISONMBS METHOD I step:inoculum (about 1 ml) III step: PDF file reading PDF file gives you directly the number of bacteria in the sample, without any calculation II step: incubation I step: serial dilutions II step: inoculum III step: incubation IV step: manual count TRADITIONAL PLATE COUNT ANALYSIS 3.5‐5 HOURS 24‐48 HOURS
  • 9.
    To confirm thereliability of POCT MBS method, as microbiological POCT for the detection of urinary tract infection and to test bacterial susceptibility to antibiotics, comparing this procedure with the traditional bacterial count + antibiogram (REFERENCE METHOD) vs POCT MBS Urine culture Antibiogram SLOW (days) FAST (hours) Aim of the study Bacteria load Bacterial  susceptibility  test Traditional analysis in  the central laboratory sequencial analysis vs parallel analysis
  • 10.
    Use of POCTMBS to evaluate the bacterial load in urine
  • 11.
    Clinical study 122 subjects havebeen enrolled between November 2013 and July 2014 in Emergency Room  with clinically suspected Urinary tract infections 89% with urinary catheter Patients Age (years)
  • 12.
    Receiver Operating Characteristic(ROC) curve analysis used to compare the diagnostic performance of two or more laboratory or diagnostic tests (Griner et al., Annals of Internal Medicine 94:555-600, 1981). Reference method Alternative  method POSITIVE NEGATIVE TOTAL POSITIVE CP (positive agreement) DP (positive deviation:  false positives) (total positives for  alternative method) NEGATIVE DN (negative deviation:  false negatives)  CN (negative  agreement)  (total negatives for  alternative method) TOTAL N+ (total positives for  reference method) N‐ (total negatives for  reference method) N (total number of  test) ACCURACY is the percentage of agreement between the two methods (positive agreement + negative agreement)/total number of tests AC = Relative accuracy : The relative accuracy is the degree of correspondence between the response obtained by the alternative method and the Reference methods. SE = Relative sensitivity : The relative sensitivity is the ability of the alternative method to detect the analyte compared to the Reference methods. SP = Relative Specificity : The relative specificity is the ability of the alternative method not to detect the target microorganism when it is not detected by the Reference methods. ROC analysis
  • 13.
    URINE culture POCT MBS Method   (at 5 hours) POSITIVE NEGATIVE TOTAL POSITIVE31 9 40 NEGATIVE 3 79 82 TOTAL 34 88 122 ROC ANALYSIS urine culture vs MBS Accuracy 90.2% Relative sensitivity 91.2 % Relative specificy 90.0 % 9 false positives HYPOTHESIS: Previous administration of antibiotics hinders replication of bacteria but not their redox metabolism 3 false negatives S.aureus infections: POCT MBS is slow responding towards S.aureus Urine culture vs POCT MBS Receiver Operating Characteristic (ROC) curve analysis is widely used to compare the diagnostic performance of two or more laboratory or diagnostic tests
  • 14.
    URINE COLTURE Urine sticks (positive for both leukocytes and  Nitrite) POSITIVENEGATIVE TOTAL POSITIVE 10 6 16 NEGATIVE 16 40 56 TOTAL 26 46 72 ROC ANALYSIS urine culture vs urine sticks Accuracy 69.4 % Relative sensitivity 38.5 % Relative specificy 87.0 % 6 false positives16 false negatives urine colture vs urine sticks Urinary Dipstick (Leukocytes+ nitrite)
  • 15.
    URINE COLTURE PCT  (>0.05 ng/ml) POSITIVE NEGATIVE TOTAL POSITIVE31 73 104 NEGATIVE 0 1 1 TOTAL 31 74 105 ROC ANALYSIS urine culture vs PCT Accuracy 30.5 % Relative sensitivity 100 % Relative specificy 1.35 % 73 false positives All this patients possibly had a bacterial infection but NOT a UTI ! urine colture vs PCT Serum procalcitonin (PCT) > 0.05 ng/ml
  • 16.
    Patient  number Urine culture  positive (1) or  negative (0) POCT MBS  colour change  (hours) 1 0 26 21 2 ... ... ... 6 0 2 ... ... ... 17 1 13.25 ... ... ... 123 ... ... The Urine culture positivity (1) or negativity (0) and the time (hours) required for POCT MBS colour change have been recorded for each patient. true positive true negative EXAMPLES false positive false negative Detailed ROC analysis of POCT MBS Experimental data
  • 17.
    Each dot representsa patient TimeforPOCTMBScolourchange(hours) urine culture negative (0) or positive (1) true negatives true positives false positives: viable but not replicating bacteria false negatives: St. aureus 5 hours  threshold Detailed ROC analysis for POCT MBS dotplot
  • 18.
    Time for POCTMBS colour change (hours) sensitivity(%)orspecificity(%) sensitivity specificity the maximal sensitivity together with the maximal specificity is reached at 5 hours. Detailed ROC analysis of POCT MBS sensitivity vs specificity
  • 19.
    POCT MBS AUC:0.927 95% confidence interval: 0.966 to 0.865 Detailed ROC analysis of POCT MBS Area Under the Curve (AUC)
  • 20.
  • 21.
    Method Accuracy  (%) (agreement with the  reference methods)  Sensitivity (%) Specificity (%) POCT MBS (5 hours) 90.291.2 90.0 POCT MBS (3.5 hours) 88.5 82.4 91.0 For POCT MBS the best compromise between fast response time and Accuracy is most likely reached after 3.5 hours (88.5 % Accuracy) ROC analysis conclusions
  • 22.
    Use of POCTMBS to evaluate the resistance/susceptibility to antibiotics of bacteria causing UTI
  • 23.
  • 24.
    ROC ANALYSIS Ciprofloxacin Accuracy 82.4 Relative sensitivity89.3 Relative specificy 50.0 URINE culture POCT MBS Method   RESISTANT SUSCEPTIBLE TOTAL RESISTANT 25 3 28 SUSCEPTIBLE 3 3 6 TOTAL 28 6 34 Urine culture: R= MIC > 1 mg/l POCT MBS: R = colour change < 5 hours 2.1 antibiogram vs MBS (ciprofloxacin)
  • 25.
    ROC ANALYSIS Co‐amoxiclav Accuracy 52.9 Relative sensitivity84.6 Relative specificy 33.3 URINE culture POCT MBS Method   RESISTANT SUSCEPTIBLE TOTAL RESISTANT 11 14 25 SUSCEPTIBLE 2 7 9 TOTAL 13 21 34 Urine culture: R= MIC > 8 mg/l POCT MBS: R = colour change < 5 hours 2.2 antibiogram vs MBS (co-amoxiclav)
  • 26.
    ROC ANALYSIS Co‐trimoxazole Accuracy 62.0 Relative sensitivity82.6 Relative specificy 27.3 URINE culture POCT MBS Method   RESISTANT SUSCEPTIBLE TOTAL RESISTANT 19 9 28 SUSCEPTIBLE 4 2 6 TOTAL 23 11 34 Urine culture: R= MIC > 4 mg/l POCT MBS: R = colour change < 5 hours 2.3 antibiogram vs MBS (co-trimoxazole)
  • 27.
    ANTIBIOTIC (n=34) Accuracy % (agreement) Ciprofloxacin 82.4 Co‐amoxiclav 52.9 Co‐trimoxazole62.0 The results are encouraging although there are too many false resistants that decrease observed Accuracy. It is possible that these false resistants are bacteria not able to replicate but still having metabolic activities. It is thus possible that POCT MBS changed colour before the antibiotic could have an effect on bacteria replication. POCT MBS method plus ANTIBIOTICS
  • 28.
    Conclusions Patient with suspectUTI Urine collectionLaboratory Urine culture 24-48 hrs. Positive > 105 CFU/ml Negative < 105 CFU/ml Identification of Bacteria 24-48 hrs. Antibiogram Present 1-2 hrs.
  • 29.
    Conclusions Patient with suspectUTI Urine collectionLaboratory MBS POCT Urine culture MBS vial 24-48 hrs. 1-2 hrs. Positive > 105 CFU/ml Negative < 105 CFU/ml Positive > 105 CFU/ml Negative < 105 CFU/ml Identification of Bacteria 24-48 hrs. Antibiogram 5-6 hrs. MBS Bacterial susceptibility test Present Future (?) 3-5 hrs.
  • 30.
    Conclusions Patient with suspectUTI Urine collectionLaboratory MBS POCT Urine culture MBS vial 24-48 hrs. 3-5 hrs. Positive > 105 CFU/ml Negative < 105 CFU/ml Positive > 105 CFU/ml Negative < 105 CFU/ml Identification of Bacteria 24-48 hrs. Antibiogram 5-6 hrs. MBS Bacterial susceptibility test Present Future (?) 1-2 hrs. Total analytical time 48-96 hrs. vs 3-6 hrs.
  • 31.
    Prof. Giovanni Antonini,Prof. Paolo Visca, dr.ssa Alyexandra Arienzo, dr.ssa Valentina Cellitti, dr.ssa Valeria Ferrante Prof. Salvatore Di Somma, dr.ssa Flavia Cristofano Ing. Alberto Mari, dr.ssa Giorgia Bottini, dr.ssa Francesca Losito, dr.ssa Francesca R. Priolisi Ing. Filippo Ugolini, ing. Tommaso Buranelli Dr.ssa Cinzia Auriti, dr. Guido Castelli Gattinara Collaborations Prof. Roberto Messi
  • 32.
    Acknowledgements Partially supported byFILAS spa (Regional Agency for the promotion of development and innovation) [grant number FILAS- RS-2009-1026]