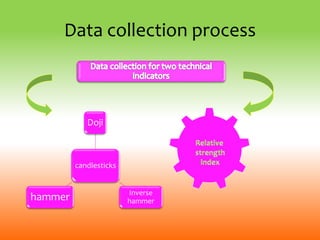
Project Report
on
COMPARATIVE STUDY ON SUCCESS
RATE OF TWO TECHNICAL INDICATORS
PERTAINING TO CRUDE OIL TRADING
Project Report submitted by:
D . SREEMANNARAYANA
ROLL NO:13781E00C2
MBA STUDENT
SVCET
RVS NAGAR
CHITTOOR.
SUBMITTED BY: - SUBMITTED TO GUIDE:-
SRIMANNARAYANA
13781E00C2
MBA 4RD SEM
DR . E . LOKANATHREDDY
(VICE PRINCIPAL)
PROJECT CONCLUDED
AT:
BRANCH, CHENNAI.
Submitted in partial fulfillment for the Award of degree of
Master of Business Administration
Academic Year
2013-2015
OBJECTIVES OF THE PROJECT
• To analyze the candlestick, relative strength index operations on
crude oil trading globally. (Through MAITRACOMMODITIES PVT
LTD).
• To make a subjective approach on hammer, reverse hammer, Doji
candlesticks with the respective samples in global commodity
market (mt4, mt5 software’s).
• To ensure the success rate and failure rate of candlestick and
relative strength index at their appropriate points.
• To compute and compare the RSI INDEX using formulae,
candlestick values and processing.
• To provide a precise summary and conclusion to crude oil trading
in commodity market
LIMITATIONS OF THE STUDY
• Time constraint is there for the intraday study.
• The estimated results that are drawn are subject
to uncertainty. Hence , it does not give any
guarantee for future profits.
• Only few Commodities were studied through
Candlestick.
INTRODUCTION
TO THE
INDUSTRY
• In India commodity markets have been in existence for decades. However in
1975 the Government banned forward contracts on commodities. Later in 2003
the Government of India again allowed forward contracts in commodities.
There have been over 20 exchanges existing for commodities all over the
country.
• In the mid-19th century, grain markets were established and a central
marketplace was created for farmers to bring their commodities and sell them
either for immediate delivery (spot trading) or for forward delivery. The latter
contracts, forwards contracts, were the fore-runners to today's futures
• There have been over 20 exchanges existing for commodities all over the
country.
• They are of national level multi commodity exchanges.
• They are
– Multi Commodity Exchange (MCX)
– National Commodities Derivatives Exchange (NCDEX)
– National Multi Commodity Exchange (NMCE)
STRUCTURE OF COMMODITY MARKET
Ministry of Consumer
Affairs
FMC
Commodity
Exchanges
National
Exchanges
MCX NCDEX NMCE
Regional
Exchanges
NBOT
20 Other
Regional
Exchanges
SEBI
(controls FMC)
INTRODUCTION TO
• MCX offers futures trading in Agricultural Commodities, Bullion,
Ferrous & Non-ferrous metals, Pulses, Oils & Oilseeds, Energy,
Plantations, Spices and other soft commodities.
• Multi Commodity Exchange (MCX) is an independent commodity
exchange based in India. It was established in 2003 and is based in
Mumbai.
• MCX is a demutualized nationwide electronic multi commodity futures
exchange set up by Financial Technologies with permanent recognition
from Government of India for facilitating online trading, clearing &
settlement operations for futures market across the country.
• The exchange started operations in November 2003.
• MCX has also setup in joint venture the National Spot Exchange a purely
agricultural commodity exchange and National Bulk Handling
Corporation (NBHC) which provides bulk storage and handling of
agricultural products.
• MCX is India's No. 1 commodity exchange with 84% Market share in
2008.
VISION:
MCX envision a unified Indian commodity market that is driven by
market forces and continually provides a level playfield for all stakeholders ranging from
the primary producer to the end-consumer; corrects historical aberrations in the system;
leverages technology to achieve exceptional efficiencies and ultimately lead to a common
world market. We also envision a brand image for MCX that identifies it as the Exchange of
Choice not only by direct participants in the commodity ecosystem but also by the general
public.
MISSION:
MCX shall accomplish the above vision by relentlessly endeavoring to
enhance awareness and understanding of exchange-enabled trade in commodity
derivatives. The Exchange will continue to minimize the adverse effects of price volatilities;
providing commodity ecosystem participants with neutral, secure and transparent trade
mechanisms; formulating quality parameters and trade regulations in conjunction with the
regulatory authority. Moreover, it will continue to enforce a zero-tolerance policy toward
unethical trade practices-attempted or real-by any participant/s; and invest in the all-round
development of the commodity ecosystem.
Board of directors
 BOARD OF DIRECTORS:
 Mr. Venkat Chary - Chairman
 Mr. Jignesh Shah - Vice Chairman
 Mr. V. Hariharan - Non Executive Director
 Mr. Joseph Massey - Non Executive Director
 Mr. P. G. Kakodkar - Non Executive Director
 Mr. Paras Ajmera - Non Executive Director
 Mr. C. M. Maniar - Independent Director
 Mr. Shvetal S. Vakil - Independent Director
 Mr. Anupam Mishra - Independent Director, FMC Nominee
 Mr. R. M. Premkumar - Independent Director, FMC Nominee
 Prof. (Mr.) K. T. Chacko - Independent Director, FMC Nominee
 Prof. (Ms.) Ashima Goyal - Independent Director, FMC Nominee
 Mr. S. Balan - Independent Director, NABARD Nominee
 Mr. B. Sriram - Independent Director, SBI Nomine
 Mr. Lambertus Rutten - Managing Director& CEO, MCX
NATIONAL COMMODITY & DERIVATIVE EXCHANGE
INTRODUCTION TO
 NCDEX is a public limited company incorporated on April 23, 2003 under the Companies Act, 1956.
 It has commenced its operations on December 15, 2003.
 National Commodity & Derivatives Exchange Limited (NCDEX) is a professionally managed on-line
multi-commodity exchange.
 NCDEX is the only commodity exchange in the country promoted by national level institutions.
 NCDEX is regulated by Forward Markets Commission.
 NCDEX is located in Mumbai and offers facilities to its members about 550 centers throughout India.
 The reach will gradually be expanded to more centers.
 NCDEX currently facilitates trading of 57 commodities.
 National Multi-Commodity Exchange of India Limited (NMCE), the first De-Mutualized Electronic Multi-
Commodity Exchange of India granted the National status on a permanent basis by the Government of
India and operational since 26th November 2002.
 It is the only Commodity Exchange in the world to have received ISO 9001:2000 certification from
British Standard Institutions (BSI).
 Innovation is the way of life at NMCE.
 NMCE commenced futures trading in 24 commodities on 26th November, 2002 .
 NMCE was the first exchange to take up the issue of differential treatment of speculative loss.
NATIONAL MULTI-COMMODITY EXCHANGE
INTRODUCTION TO
 National Multi-Commodity Exchange of India Limited (NMCE), the first
De-Mutualized Electronic Multi-Commodity Exchange of India granted
the National status on a permanent basis by the Government of India
and operational since 26th November 2002.
 It is the only Commodity Exchange in the world to have received ISO
9001:2000 certification from British Standard Institutions (BSI)
Innovation is the way of life at NMCE.
 NMCE commenced futures trading in 24 commodities on 26th
November, 2002 on a national scale and the basket of commodities has
grown substantially since then to include cash crops, food grains,
plantations, spices, oil seeds, metals & bullion among others.
 NMCE was the first exchange to take up the issue of differential
treatment of speculative loss.
 It was also the first exchange to enroll participation of high net-worth
corporate securities brokers in commodity derivatives market.
Introduction to
Forward market commission
1. Forward Markets Commission (FMC) headquartered at Mumbai, is a
regulatory authority which is overseen by the Ministry of Consumer
Affairs, Food and Public Distribution, Govt. of India.
2. It is a statutory body set up in 1953 under the Forward Contracts
(Regulation) Act, 1952.
3. " The Act provides that the Commission shall consist of not less than
two but not exceeding four members appointed by the Central
Government out of them being nominated by the Central Government
to be the Chairman.”
4. Currently Commission comprises three members among whom Shri
B.C. Khatua, IAS, is the Chairman, Shri Rajeev Kumar Agarwal, IRS
and Shri D.S.Kolamkar, IES are the Members of the Commission
5. But in latest news (2015) it is decided and declared by ministry of
finance (MOF), ministry of commerce (MOC) to make the control of
FMC is under Control of SEBI only.
FMC
MOC,
SEBI
MOF
“Company profile”
INTRODUCTION TO COMPANY
 Maitra Commodities (P) Ltd is an emerging commodity broking firm. We
are trading cum clearing member of Multi Commodity Exchange of India
Limited (MCX).
 Their vision is to educate our clients in and provide opportunities for
trading and hedging in futures market.
 They offer ONLINE TRADING in more than 55 commodity future contracts.
 This firm equipped with:
1. A Knowledgeable and professionally qualified team.
2. A Proactive and Customer Centric Support Team.
 They Provide:
1. Education & Awareness into the Commodities Future Markets.
2. Dedicated Customer Centric team to handle customer Queries.
3. Research on Base Metals, Precious Metals, Energy products.
MAJOR PRODUCTS IN TRADING
BULLIONS
•Gold
•Silver M
•Gold HNI
•Gold M
•Platinum
•Silver
•Silver HNI
•Gold Guinea
OIL & OIL SEEDS
1.Crude Palm Oil
2.Kapasia Khalid
3.Soya Bean
4.Refined Soya Oil
CEREALS
• Barley
•Wheat
•Maize-Feed / Industrial
Grade
Products cont.…
METALS
• Aluminum
• Copper
• Lead
• Zinc Mini
• Nickel
• Tin
• Zinc
• Lead Mini
PLANTATIONS
•Rubber
• FIBER
•Kapas
• SPICES
•Cardamom
•Turmeric
•Coriander
PULSES
•Chaos
• ENERGY
•ATF
•Crude Oil
•Natural Gas
•Gasoline
•Heating Oil
•Imported Thermal Coal
•Electricity Monthly &
Weekly
WEATHER
•Carbon(CER)
•Carbon(CFI)
•OTHERS
•Almond
•Gaur Seed
•Potato (Agra)
•Menthe Oil
•Melted
Menthol Flakes
INTRODUCTION
TO THE TOPIC
DEFINITION AND MEANING
• Commodity includes all kinds of goods.
• FCRA defines “commodity goods” as “every kind of movable
property other than actionable claims, money and securities”.
• Futures trading is organized in such goods are commodities as
are permitted by the central Government.
• At present all goods and products of agricultural including
plantation, mineral and fossil origin are allowed for futures
trading under the auspices of the commodity exchanges
recognized under the FCRA.
• Commodities include precious (gold and silver) and non-ferrous
metals; cereals and pulses; ginned and un-ginned cotton;
oilseeds, oils and oilcakes; raw jute and jute goods; sugar and
guar; potatoes and onions; coffee and tea; rubber and spices
COMMODITY DERIVATIVES
• Derivatives as a tool for managing risk first originated in
the commodities markets.
• In India, trading in commodity futures has been in
existence from the 19th century with organized trading in
cotton through the establishment of Cotton Trade
Association in 1875.
• Over a period of time, other commodities like crude oil
were permitted to be traded in futures exchanges.
• Regulatory constraints in 1960s resulted in virtual
dismantling of the commodities future markets.
• It is only in the last decade that crude oil trading in
commodity future exchanges have been actively
encouraged.
WHY TRADE IN COMMODITIES?
1. No need to study of “ balance sheet, P&L statement, EBITDA and reading between the
lines”.
2. Commodity trading is about the simple economics of supply and demand.
3. Supports are known, only resistance matters! Minimum support price acts as a
statutory support for many commodities.
4. No Dollar-Rupee premiums/discounts.
5. No hedging on the NYMEX.
6. Indian commodity derivatives hedge both forex and commodity specific risk, at a
single cost.
7. No brainstorming over market direction.
8. The Seasonality patterns quiet often provide a clue to both short- and long-term
players.
9. No scam, no price rigging.
10. Commodity trading comes with no insider trading information and company specific
risk.
 Trading of all the derivatives in India is carried over:
• Exchanges
• Over the counter
REVIEW OF LITERATURE
• This chapter is divided into two main parts: explanations of terms and concepts
found later in the literature reviews and a survey of literature reviews on
candlesticks and RSI ANALYSIS.
• Olson (2014) finds different results on the profitability of the moving average trading,
CANDLESTICKS rules. He finds that trading rule returns decline over time after 1970’s, to
approximately zero by the 1990s.
• Olson also find that candlestick pattern is one of the best trading strategies for short term
investments as well as long term.
• crudeoil has plummeted below 76.4% Fibonacci retracement level. More bearishness to be
witnessed over intraday basis due to the candlestick formations and failure to breach
54.20 initial resistance.
• Longworth (1981) uses CAD/USD spot and forward rates from July 1970 to
October 1976.
 He finds that forward rates can be predicted using spot reference rates,
concluding that markets are inefficient.
 The results show that technical analysis is applied mainly for the shorter time
frames for entry and exit timings. Moreover, technical analysis tools are found
to be the best tools for trading currencies.
 The survey results also reveal that fundamentals are reliable for the long term
picture, whereas others rely on both fundamental and technical analyses in
taking trading decisions.
• Brock, Lakonishok and LeBaron (1992) examine two simple, common trading
rules: moving averages and range breakouts in the DJIA, from 1897 to 1986.
I. He had applied a standard statistical analysis of the bootstrap method,
II. the results reveal strong evidence of the technical trading strategies applied.
III. The Buy signals are found to constantly produce higher returns than sell
signals. Also, the returns following buy signals are less volatile compared with
the returns generated by sell signals.
• Levich and Thomas (1994) examine the “impact of technical trading strategies in the
foreign exchange market.” by using futures contracts of a 15-year time span. Their
data sample covers the years from 1976 to 1990.
 After applying bootstrap methodology, and a statistical approach, thousands of
new exchange rate series are randomly generated; each tested series’ profitability is
examined using a technical analysis approach.
 The empirical results of profit significance in both original series and randomly
generated series are compared.
 The findings reveal that technical trading systems are significantly profitable.
Although some profits declined during the five years of 1986-90, on an average, the
profiles are found still positive and significant in some periods.
 Thus, these results provide evidence of profitability and statistical evidence of how
technical trading systems are profitable in the foreign exchange market.
• Silber (1995) is among the first researchers who examine the profitability of simple
trading strategies in foreign exchange markets in presence of central banks
interventions.
 His sample covers the German mark, Swiss franc, Japanese yen, British pound and
Canadian dollar.
 He uses simple moving averages as trading rules. He finds evidence that technical
rules can be valuable in markets where governments are found big players.
 The results show that government interventions provide speculators with an
opportunity to generate abnormal returns by applying simple technical trading
strategies.
• Gencay (1997) also finds strong evidence of profitable simple technical trading rules in daily Dow
Jones Industrial Average Index.
1. He had examined linear and nonlinear predictability of stock market return using historical buy
and sell signals of the moving average rules.
2. the result shows evidence of nonlinear predictability in the US stock markets, supporting the
results found by Brock, Lakonishok and LeBaron (1992).
• LeBaron (1998) reviews some evidence that shows predictive value over future foreign
exchange prices.
1. He analyses the profitability of simple trading rules in relation with central bank activity, using
intervention information from the Fed.
2. His forecasts are assessed over one day and one week periods.
3. His sample uses weekly and daily foreign exchange rates of Deusche mark (DM) and Japanese
yen (JP) from January 1979 to December 1992.
4. The interest rate series used is one week Euro rates. The trading rules compare the current
price with a moving average of historical prices.
5. He finds that the predictability of exchange rates diminishes during the periods when the Fed is
inactive.
• Osler (2000) examines the technical trading rules of support and resistance levels provided by
six foreign exchange trading companies.
 The data sample covers the period from 1996 to 1998.
 The statistical test of the bootstrap technique is used.
 The results show that signals are very successful in forecasting trend interruptions or reversals.
 The findings also show that some companies are more accurate in identifying turning points in
exchange rate trends.
• Saacke (2002) Moreover, analyzing daily exchange rates of USD/DEM as well as daily USD and DEM overnight
Euro rates, from January 1979 to July 1994, provides further evidence of the unusual profitability of applying
technical trading strategies on days when the Fed and Bundesbank interventions take place.
• The central banks are found to gain returns when they intervene in foreign exchange markets and with the
usefulness of technical analysis.
• Intervention returns and trading rule profitability are evaluated during horizons and post interventions.
• Exchange rates are found to react in the opposite direction of central banks’ intentions in the short term, but
in line with their targets in the long term.
• The researchers find that the trading rules of using moving averages are considerably profitable on the days
when the central banks interfere.
• The findings also reveal that trading rules returns are still high on days in which interventions did not take
place or on preceding days.
• Osker (2003) examines clustering of foreign currency stop-loss orders as well as take profit orders as they are
considered main orders when placing trading orders.
 His data covers 9,655 orders with a total of more than $55 billion, from August 1, 1999, to April 11, 2000.
 His sample covers three foreign currencies: USD/JPY, EUR/USD and GBP/USD.
 He uses the crowded orders to provide an explanation for two common predictions of technical analysis.
 First, trends are likely to reverse directions at support and resistance areas.
 Second, trends are likely to move faster after prices penetrate such levels.
 He finds that take-profit orders gather at round numbers, explaining the first profit forecasting, whereas stop-
loss orders concentrate heavily just after round numbers; this explains the reason behind the second
forecasting.
 These findings are obtained based on the closing rates of both orders placed at the famous dealing bank of
National Westminster. The order clustering phenomenon is due to different common reasons; round numbers
are easy to remember and to place orders at as they are the first to come to anyone’s mind. The final results
show that technical trading rules can be profitable for market participants.
• Stephen (2008) examines the profitability of using technical models of moving averages
and momentum that add up to 1024 technical trading rules in DM/USD.
 He finds that all the trading rules are profitable.
 The profitability is mainly because of the exploitation of exchange rate trends; the result
stay valid even with sub-periods trading and declining profit during late 1980s.
 Krishnan and Menon (2009) study the influence of foreign currencies, technical indicators
and time frames on trading profits.
 The research covers the period from September 2006 to October 2008 with 1,400
observations in the sample and two durations: one year and three months. The currency
pairs include EUR/USD, GBP/USD, USD/CHF and USD/JPY.
 The time frames cover five minutes, 15 minutes, 30 minutes, one hour, four hours and
one day. The technical indicators used are five leading and five lagging.
 The findings reveal that using technical analysis in foreign currency trading activities is
profitable; all of the currencies.
 The findings also show that short–term trading is riskier and of low liquidity, compared to
the long-term trading.
• Cekirdekci and Iliev (2010):
• The research examines a technical trading system using and back tests of around 250
stocks from various industry sectors, from April 2005 to April 2010.
• The initial tested set ups include buy and sell filters, inside bar, simple and exponential
moving averages, a volume indicator, per cent trailing exist, overbought and oversold
areas of Relative Strength Index and candlesticks.
• The results show that, when combining buy and sell signals with other indicators, such as
the volume indicator, the opening range is a powerful model; it generates significant
returns when traded with the correct stock.
• Holmberg, Lönnbark and Lundström (2012) test the profitability of the trading strategy
of the “Open Range Breakout (ORB), but in the US crude oil futures prices from March,
1983 to January, 2011.
• The ORB is a trading rule that signals entry and exit rules once the price moves beyond
predefined boundaries. Using the joint distribution of low, high, open and close prices
over a period of time, the researchers find that their ORB trading rule significantly
generates high returns
• Other researchers in 2014-2015 delivered results of
patterns :
• The long position should be closed when: The RSI reading
falls below the 50.00 level, or the market reaches and
stagnates at a major level of resistance, trend line or
other level of significance, or a Shooting Star/Bearish
Engulfing formation appears.
• A trader will look to go short when: The RSI reading is
below the 50.00 level; second, a candlestick pattern such
as a Shooting Star, or a Bearish Engulfing formation
confirms the movement to the downside. The protective
stop needs to be placed at the closest level of resistance.
• The short position should be closed when: The RSI
reading jumps above the 50.00 level, or the market
reaches and stagnates at a major level of support, trend
line or other level of significance, or a Hammer/Bullish
Engulfing formation appears.
RESEARCH
METHODOLOGY
RESEARCH OBJECTIVE
• To analyze the COMPARATIVE
STUDY OF SUCCESS RATES IN TWO
TECHNICAL INDICATORS PERTAINING
TO CRUDE OIL TRADING.
SAMPLING DESIGN
• Sampling Area : global commodity market
• Sample collection : 50 each technical indicator
• Sample Size : 200
METHODS
 Primary Data : Primary data collected through live trading
system of Multi Commodity Exchange
 Secondary data : The secondary data is mostly collected
from Websites, Books, Journals and
Commodity broking companies
 Research method : Correlational research
 Sampling method : Stratified sampling
RESEARCH DESIGN
• Research : Descriptive & Objective
• Data Source : primary source, Secondary data
• Research Method : Survey Method
• Research Technique : random sampling technique
• Research tools :
1.candlesticks(Doji, Hammer, Inverse hammer).
2.Relative strength index
• Data collection tools : mt4,mt5 soft wares.
Types of candlesticks used …
Data collection process
candlesticks
Doji
Inverse
hammerhammer
DATA
ANALYSIS
Categories in data analysis
Candlesticks
Inverse
hammer
Hammer
doji
Analysis
candlesticks
Relative
strength
index
Candlestick analysis
GROSS PROFIT GROSS LOSS NET PROFIT
24277.4354 -8558.2525 15719.1829
-10000
-5000
0
5000
10000
15000
20000
25000
GROSS PROFIT GROSS LOSS NET PROFIT
SERIES1 24277.4354 -8558.2525 15719.1829
24277.4354
-8558.2525
15719.1829
Doji
0
10
20
30
40
50
60
70
80
TOTAL NO.OF
SAMPLES
NO.OF SUCCESS NO.OF
FAILURES
SUCCESS %
50
39
11
78%
Doji
TOTAL NO.OF
SAMPLES
NO.OF SUCCESS NO.OF
FAILURES
SUCCESS
%
50 39 11 78
Candlestick analysis
GROSS PROFIT GROSS LOSS NET PROFIT
33901.56 11303.92 22597.64
0
5000
10000
15000
20000
25000
30000
35000
GROSS PROFIT GROSS LOSS NET PROFIT
SERIES1 33901.56 11303.92 22597.64
33901.56
11303.92
22597.64
VALUEINRUPEES
HAMMER
Candlestick analysis
TOTAL NO.OF SAMPLES NO.OF SUCCESS NO.OF FAILURES SUCCESS %
50 40 10 80
Candlestick analysis
GROSS PROFIT GROSS LOSS NET PROFIT
29063.03 -11152.13 17910.9
-15000
-10000
-5000
0
5000
10000
15000
20000
25000
30000
GROSS PROFIT GROSS LOSS NET PROFIT
Series1 29063.03 -11152.13 17910.9
29063.03
-11152.13
17910.9
Gross profit/loss in Inverse Hammer candlestick
Candlestick analysis
TOTAL NO.OF SAMPLES NO.OF
SUCCESS
NO.OF FAILURES SUCCESS %
50 35 15 70
0
10
20
30
40
50
60
70
TOTAL NO.OF
SAMPLES
NO.OF
SUCCESS
NO.OF
FAILURES
SUCCESS %
Series1 50 35 15 70
50
35
15
70%
Successes &failures in Inverse Hammer
Candlestick analysis
successrate=(totalnumberofsuccesshappened/totalsamplevalue)
success rate of doji success rate of hammer success rate of inverse hammer
78% 82% 70%
64%
66%
68%
70%
72%
74%
76%
78%
80%
82%
success rate of doji success rate of
hammer
success rate of
inverse hammer
Series1 78% 82% 70%
78%
80%
70%
success rates of candlesticks
RSI ANALYSIS
-30000
-20000
-10000
0
10000
20000
30000
40000
SN
O
1 2 3 4 5 6 7 8 9 10 11 12 13 14 15 16 17 18 19 20 21 22 23 24 25 26 27 28 29 30 31 32 33 34 35 36 37 38 39 40 41 42 43 44 45 46 47 48 49 50
PROFIT/LOSS 0 33 66 27 75 85 77 14 -2 -2 -2 10 -5 43 49 26 -1 37 18 25 67 10 20 -2 -2 -1 56 90 15 18 23 39 -3 -8 18 23 45 82 16 22 44 50 92 10 20 -1 -4 55 -3 27 12
SELL VALUE AT $70 0 48 47 48 48 48 48 49 46 46 46 46 46 46 46 45 45 45 45 45 45 46 48 48 48 49 51 51 51 51 52 54 51 51 52 51 52 52 53 53 50 50 50 50 52 52 52 52 52 52 53
BUY VALUE AT $30 0 48 47 47 47 47 47 46 46 46 46 46 46 45 45 44 45 45 45 45 44 44 44 51 51 51 50 50 49 48 48 48 51 51 51 51 51 50 50 50 50 49 49 49 48 52 53 51 52 52 51
VALUESINRUPEES
RSI ANALYSIS PERTAINING TO US OIL TRADING
GROSS PROFIT GROSS LOSS NET PROFIT
335276.0115 -75280.6112 259995.4003
-100000
-50000
0
50000
100000
150000
200000
250000
300000
350000
GROSS PROFIT GROSS LOSS NET PROFIT
Series1 335276.0115 -75280.6112 259995.4003
335276.0115
-75280.6112
259995.4003
RSI ANALYSIS
TOTAL NO.OF SAMPLES NO.OF
SUCCESS
NO.OF
FAILURES
SUCCESS %
50 37 13 74
0
10
20
30
40
50
60
70
80
TOTAL NO.OF
SAMPLES
NO.OF
SUCCESS
NO.OF
FAILURES
SUCCESS %
Series1 50 37 13 74
50
37
13
74%
RSI SUCCESS RATE
COMPARISION OF CRUDE OIL
SUCCESS RATES IN DISTINCT
CANDLESTICKS WITH RSI INDEX
DOJI
HAMMER
INVERSE
HAMMER
DOJIHAMMER
INVERSE
HAMMER RSI
DOJI VS RSI
TOTAL NO.OF SAMPLES
SUCCESS percentage of DOJI SUCCESS percentage of RSI
50
78 74
0
10
20
30
40
50
60
70
80
TOTAL NO.OF SAMPLES SUCCESS percentage of DOJI SUCCESS percentage of RSI
DOJI VS RSI
Series1 50 78 74
50
78% 74%
DOJI Vs RSI
HAMMER Vs. RSI
TOTAL NO.OF SAMPLES
SUCCESS percentage of HAMMER SUCCESS percentage of RSI
50
80 74
0
10
20
30
40
50
60
70
80
TOTAL NO.OF SAMPLES SUCCESS percentage of
HAMMER
SUCCESS percentage of
RSI
HAMMER Vs RSI
Series1 50 80 74
50
80%
74%
HAMMER Vs RSI
INVERSE HAMMER Vs. RSI
TOTAL NO.OF SAMPLES
SUCCESS percentage of INVERSE HAMMER SUCCESS percentage of RSI
50
70 74
0
10
20
30
40
50
60
70
80
TOTAL NO.OF SAMPLES SUCCESS percentage of
INVERSE HAMMER
SUCCESS percentage of RSI
INVERSE HAMMER Vs RSI
Series1 50 80 74
50
70%
74%
INVERSE HAMMER Vs RSI
FINDINGS
1. From the study it is found that the success rate of hammer
is much more than doji and invertible hammer when
trading of crude oil in global commodity market
2. From the study it is found that Doji formation in
candlesticks has given higher success rate than invertible
hammer, but invertible hammer has given return in terms
of rupees.
3. From the study it is found that the risk percentage in RSI is
much more than candlestick
4. From the study it is found that RSI has given higher returns
than candlesticks when trading global commodity market
RECOMMENDATIONS
1. I recommend the trader to use either candlestick or RSI for his
intraday trading based on his risk taking capabilities.
2. The trader with lesser risk taking capabilities to use candlesticks
for his intraday trading.
3. The trader who is expecting higher returns to use RSI for his
intraday trading.
4. The trader who is using RSI to maintain proper amount in his
DEMAT account /trading account.
 Since the study is in short term the investors should be enable
optimistic thinking and move on further.
 I also strongly recommend that investors should not always
depends on only one technical indicator in fluctuated market.
SUGGESTIONS
• I suggest that investors who should capturing the crude oil
trading in commodity market to make a sense of candlestick like
hammer and inverse hammers trend points.
• Investors rather optioned for RSI with long term changes in
movement of values better to make use of simplified technique
like Japanese candlestick trends.
• In random walk study also prefer in Japanese
analysis(candlestick).
• Japanese candlestick is most contingency than other technical
indicators & also simple to understand the short and long
position variances in market conditions.
• Investors should
CONCLUSIONS
• The candlesticks and relative strength index techniques for trading
crude oil in global commodity market is having moderate success rates
which gives a result greets towards investors to invest especially in
commodities like crude oil.
• The Exchange will continue to minimize the adverse effects of price
volatilities; providing commodity ecosystem participants with neutral,
secure and transparent trade mechanisms.
• The risk averse capacity of investors should be OPTIMIZED and their
level of satisfied results with candlestick techniques used in their early
investments.
REFERENCES
1. http://www.mcxindia.com/
2. http://www.mt4.com/
3. http://www.mt5.com/
4. http://www.investing.com/commodi
ties/crude-oil-candlestick
5. http://www.tradingportalen.com/
6. http://www.rb-
trading.com/article9.html
7. http://www.candlecharts.com/candl
estick-charting-glossary.htm
Q?&A.
THANK
YOU.!!!FOR YOUR KIND ATTENTION & PATIENCE!!!!

mba finance Project final ppt

  • 1.
    Project Report on COMPARATIVE STUDYON SUCCESS RATE OF TWO TECHNICAL INDICATORS PERTAINING TO CRUDE OIL TRADING Project Report submitted by: D . SREEMANNARAYANA ROLL NO:13781E00C2 MBA STUDENT SVCET RVS NAGAR CHITTOOR.
  • 2.
    SUBMITTED BY: -SUBMITTED TO GUIDE:- SRIMANNARAYANA 13781E00C2 MBA 4RD SEM DR . E . LOKANATHREDDY (VICE PRINCIPAL) PROJECT CONCLUDED AT: BRANCH, CHENNAI. Submitted in partial fulfillment for the Award of degree of Master of Business Administration Academic Year 2013-2015
  • 3.
    OBJECTIVES OF THEPROJECT • To analyze the candlestick, relative strength index operations on crude oil trading globally. (Through MAITRACOMMODITIES PVT LTD). • To make a subjective approach on hammer, reverse hammer, Doji candlesticks with the respective samples in global commodity market (mt4, mt5 software’s). • To ensure the success rate and failure rate of candlestick and relative strength index at their appropriate points. • To compute and compare the RSI INDEX using formulae, candlestick values and processing. • To provide a precise summary and conclusion to crude oil trading in commodity market
  • 4.
    LIMITATIONS OF THESTUDY • Time constraint is there for the intraday study. • The estimated results that are drawn are subject to uncertainty. Hence , it does not give any guarantee for future profits. • Only few Commodities were studied through Candlestick.
  • 5.
  • 7.
    • In Indiacommodity markets have been in existence for decades. However in 1975 the Government banned forward contracts on commodities. Later in 2003 the Government of India again allowed forward contracts in commodities. There have been over 20 exchanges existing for commodities all over the country. • In the mid-19th century, grain markets were established and a central marketplace was created for farmers to bring their commodities and sell them either for immediate delivery (spot trading) or for forward delivery. The latter contracts, forwards contracts, were the fore-runners to today's futures • There have been over 20 exchanges existing for commodities all over the country. • They are of national level multi commodity exchanges. • They are – Multi Commodity Exchange (MCX) – National Commodities Derivatives Exchange (NCDEX) – National Multi Commodity Exchange (NMCE)
  • 8.
    STRUCTURE OF COMMODITYMARKET Ministry of Consumer Affairs FMC Commodity Exchanges National Exchanges MCX NCDEX NMCE Regional Exchanges NBOT 20 Other Regional Exchanges SEBI (controls FMC)
  • 9.
  • 10.
    • MCX offersfutures trading in Agricultural Commodities, Bullion, Ferrous & Non-ferrous metals, Pulses, Oils & Oilseeds, Energy, Plantations, Spices and other soft commodities. • Multi Commodity Exchange (MCX) is an independent commodity exchange based in India. It was established in 2003 and is based in Mumbai. • MCX is a demutualized nationwide electronic multi commodity futures exchange set up by Financial Technologies with permanent recognition from Government of India for facilitating online trading, clearing & settlement operations for futures market across the country. • The exchange started operations in November 2003. • MCX has also setup in joint venture the National Spot Exchange a purely agricultural commodity exchange and National Bulk Handling Corporation (NBHC) which provides bulk storage and handling of agricultural products. • MCX is India's No. 1 commodity exchange with 84% Market share in 2008.
  • 11.
    VISION: MCX envision aunified Indian commodity market that is driven by market forces and continually provides a level playfield for all stakeholders ranging from the primary producer to the end-consumer; corrects historical aberrations in the system; leverages technology to achieve exceptional efficiencies and ultimately lead to a common world market. We also envision a brand image for MCX that identifies it as the Exchange of Choice not only by direct participants in the commodity ecosystem but also by the general public. MISSION: MCX shall accomplish the above vision by relentlessly endeavoring to enhance awareness and understanding of exchange-enabled trade in commodity derivatives. The Exchange will continue to minimize the adverse effects of price volatilities; providing commodity ecosystem participants with neutral, secure and transparent trade mechanisms; formulating quality parameters and trade regulations in conjunction with the regulatory authority. Moreover, it will continue to enforce a zero-tolerance policy toward unethical trade practices-attempted or real-by any participant/s; and invest in the all-round development of the commodity ecosystem.
  • 12.
    Board of directors BOARD OF DIRECTORS:  Mr. Venkat Chary - Chairman  Mr. Jignesh Shah - Vice Chairman  Mr. V. Hariharan - Non Executive Director  Mr. Joseph Massey - Non Executive Director  Mr. P. G. Kakodkar - Non Executive Director  Mr. Paras Ajmera - Non Executive Director  Mr. C. M. Maniar - Independent Director  Mr. Shvetal S. Vakil - Independent Director  Mr. Anupam Mishra - Independent Director, FMC Nominee  Mr. R. M. Premkumar - Independent Director, FMC Nominee  Prof. (Mr.) K. T. Chacko - Independent Director, FMC Nominee  Prof. (Ms.) Ashima Goyal - Independent Director, FMC Nominee  Mr. S. Balan - Independent Director, NABARD Nominee  Mr. B. Sriram - Independent Director, SBI Nomine  Mr. Lambertus Rutten - Managing Director& CEO, MCX
  • 13.
    NATIONAL COMMODITY &DERIVATIVE EXCHANGE INTRODUCTION TO
  • 14.
     NCDEX isa public limited company incorporated on April 23, 2003 under the Companies Act, 1956.  It has commenced its operations on December 15, 2003.  National Commodity & Derivatives Exchange Limited (NCDEX) is a professionally managed on-line multi-commodity exchange.  NCDEX is the only commodity exchange in the country promoted by national level institutions.  NCDEX is regulated by Forward Markets Commission.  NCDEX is located in Mumbai and offers facilities to its members about 550 centers throughout India.  The reach will gradually be expanded to more centers.  NCDEX currently facilitates trading of 57 commodities.  National Multi-Commodity Exchange of India Limited (NMCE), the first De-Mutualized Electronic Multi- Commodity Exchange of India granted the National status on a permanent basis by the Government of India and operational since 26th November 2002.  It is the only Commodity Exchange in the world to have received ISO 9001:2000 certification from British Standard Institutions (BSI).  Innovation is the way of life at NMCE.  NMCE commenced futures trading in 24 commodities on 26th November, 2002 .  NMCE was the first exchange to take up the issue of differential treatment of speculative loss.
  • 15.
  • 16.
     National Multi-CommodityExchange of India Limited (NMCE), the first De-Mutualized Electronic Multi-Commodity Exchange of India granted the National status on a permanent basis by the Government of India and operational since 26th November 2002.  It is the only Commodity Exchange in the world to have received ISO 9001:2000 certification from British Standard Institutions (BSI) Innovation is the way of life at NMCE.  NMCE commenced futures trading in 24 commodities on 26th November, 2002 on a national scale and the basket of commodities has grown substantially since then to include cash crops, food grains, plantations, spices, oil seeds, metals & bullion among others.  NMCE was the first exchange to take up the issue of differential treatment of speculative loss.  It was also the first exchange to enroll participation of high net-worth corporate securities brokers in commodity derivatives market.
  • 17.
  • 18.
    1. Forward MarketsCommission (FMC) headquartered at Mumbai, is a regulatory authority which is overseen by the Ministry of Consumer Affairs, Food and Public Distribution, Govt. of India. 2. It is a statutory body set up in 1953 under the Forward Contracts (Regulation) Act, 1952. 3. " The Act provides that the Commission shall consist of not less than two but not exceeding four members appointed by the Central Government out of them being nominated by the Central Government to be the Chairman.” 4. Currently Commission comprises three members among whom Shri B.C. Khatua, IAS, is the Chairman, Shri Rajeev Kumar Agarwal, IRS and Shri D.S.Kolamkar, IES are the Members of the Commission 5. But in latest news (2015) it is decided and declared by ministry of finance (MOF), ministry of commerce (MOC) to make the control of FMC is under Control of SEBI only.
  • 19.
  • 20.
  • 21.
    INTRODUCTION TO COMPANY Maitra Commodities (P) Ltd is an emerging commodity broking firm. We are trading cum clearing member of Multi Commodity Exchange of India Limited (MCX).  Their vision is to educate our clients in and provide opportunities for trading and hedging in futures market.  They offer ONLINE TRADING in more than 55 commodity future contracts.  This firm equipped with: 1. A Knowledgeable and professionally qualified team. 2. A Proactive and Customer Centric Support Team.  They Provide: 1. Education & Awareness into the Commodities Future Markets. 2. Dedicated Customer Centric team to handle customer Queries. 3. Research on Base Metals, Precious Metals, Energy products.
  • 22.
    MAJOR PRODUCTS INTRADING BULLIONS •Gold •Silver M •Gold HNI •Gold M •Platinum •Silver •Silver HNI •Gold Guinea OIL & OIL SEEDS 1.Crude Palm Oil 2.Kapasia Khalid 3.Soya Bean 4.Refined Soya Oil CEREALS • Barley •Wheat •Maize-Feed / Industrial Grade
  • 23.
    Products cont.… METALS • Aluminum •Copper • Lead • Zinc Mini • Nickel • Tin • Zinc • Lead Mini PLANTATIONS •Rubber • FIBER •Kapas • SPICES •Cardamom •Turmeric •Coriander PULSES •Chaos • ENERGY •ATF •Crude Oil •Natural Gas •Gasoline •Heating Oil •Imported Thermal Coal •Electricity Monthly & Weekly WEATHER •Carbon(CER) •Carbon(CFI) •OTHERS •Almond •Gaur Seed •Potato (Agra) •Menthe Oil •Melted Menthol Flakes
  • 24.
  • 25.
    DEFINITION AND MEANING •Commodity includes all kinds of goods. • FCRA defines “commodity goods” as “every kind of movable property other than actionable claims, money and securities”. • Futures trading is organized in such goods are commodities as are permitted by the central Government. • At present all goods and products of agricultural including plantation, mineral and fossil origin are allowed for futures trading under the auspices of the commodity exchanges recognized under the FCRA. • Commodities include precious (gold and silver) and non-ferrous metals; cereals and pulses; ginned and un-ginned cotton; oilseeds, oils and oilcakes; raw jute and jute goods; sugar and guar; potatoes and onions; coffee and tea; rubber and spices
  • 26.
    COMMODITY DERIVATIVES • Derivativesas a tool for managing risk first originated in the commodities markets. • In India, trading in commodity futures has been in existence from the 19th century with organized trading in cotton through the establishment of Cotton Trade Association in 1875. • Over a period of time, other commodities like crude oil were permitted to be traded in futures exchanges. • Regulatory constraints in 1960s resulted in virtual dismantling of the commodities future markets. • It is only in the last decade that crude oil trading in commodity future exchanges have been actively encouraged.
  • 27.
    WHY TRADE INCOMMODITIES? 1. No need to study of “ balance sheet, P&L statement, EBITDA and reading between the lines”. 2. Commodity trading is about the simple economics of supply and demand. 3. Supports are known, only resistance matters! Minimum support price acts as a statutory support for many commodities. 4. No Dollar-Rupee premiums/discounts. 5. No hedging on the NYMEX. 6. Indian commodity derivatives hedge both forex and commodity specific risk, at a single cost. 7. No brainstorming over market direction. 8. The Seasonality patterns quiet often provide a clue to both short- and long-term players. 9. No scam, no price rigging. 10. Commodity trading comes with no insider trading information and company specific risk.  Trading of all the derivatives in India is carried over: • Exchanges • Over the counter
  • 28.
    REVIEW OF LITERATURE •This chapter is divided into two main parts: explanations of terms and concepts found later in the literature reviews and a survey of literature reviews on candlesticks and RSI ANALYSIS. • Olson (2014) finds different results on the profitability of the moving average trading, CANDLESTICKS rules. He finds that trading rule returns decline over time after 1970’s, to approximately zero by the 1990s. • Olson also find that candlestick pattern is one of the best trading strategies for short term investments as well as long term. • crudeoil has plummeted below 76.4% Fibonacci retracement level. More bearishness to be witnessed over intraday basis due to the candlestick formations and failure to breach 54.20 initial resistance.
  • 29.
    • Longworth (1981)uses CAD/USD spot and forward rates from July 1970 to October 1976.  He finds that forward rates can be predicted using spot reference rates, concluding that markets are inefficient.  The results show that technical analysis is applied mainly for the shorter time frames for entry and exit timings. Moreover, technical analysis tools are found to be the best tools for trading currencies.  The survey results also reveal that fundamentals are reliable for the long term picture, whereas others rely on both fundamental and technical analyses in taking trading decisions. • Brock, Lakonishok and LeBaron (1992) examine two simple, common trading rules: moving averages and range breakouts in the DJIA, from 1897 to 1986. I. He had applied a standard statistical analysis of the bootstrap method, II. the results reveal strong evidence of the technical trading strategies applied. III. The Buy signals are found to constantly produce higher returns than sell signals. Also, the returns following buy signals are less volatile compared with the returns generated by sell signals.
  • 30.
    • Levich andThomas (1994) examine the “impact of technical trading strategies in the foreign exchange market.” by using futures contracts of a 15-year time span. Their data sample covers the years from 1976 to 1990.  After applying bootstrap methodology, and a statistical approach, thousands of new exchange rate series are randomly generated; each tested series’ profitability is examined using a technical analysis approach.  The empirical results of profit significance in both original series and randomly generated series are compared.  The findings reveal that technical trading systems are significantly profitable. Although some profits declined during the five years of 1986-90, on an average, the profiles are found still positive and significant in some periods.  Thus, these results provide evidence of profitability and statistical evidence of how technical trading systems are profitable in the foreign exchange market. • Silber (1995) is among the first researchers who examine the profitability of simple trading strategies in foreign exchange markets in presence of central banks interventions.  His sample covers the German mark, Swiss franc, Japanese yen, British pound and Canadian dollar.  He uses simple moving averages as trading rules. He finds evidence that technical rules can be valuable in markets where governments are found big players.  The results show that government interventions provide speculators with an opportunity to generate abnormal returns by applying simple technical trading strategies.
  • 31.
    • Gencay (1997)also finds strong evidence of profitable simple technical trading rules in daily Dow Jones Industrial Average Index. 1. He had examined linear and nonlinear predictability of stock market return using historical buy and sell signals of the moving average rules. 2. the result shows evidence of nonlinear predictability in the US stock markets, supporting the results found by Brock, Lakonishok and LeBaron (1992). • LeBaron (1998) reviews some evidence that shows predictive value over future foreign exchange prices. 1. He analyses the profitability of simple trading rules in relation with central bank activity, using intervention information from the Fed. 2. His forecasts are assessed over one day and one week periods. 3. His sample uses weekly and daily foreign exchange rates of Deusche mark (DM) and Japanese yen (JP) from January 1979 to December 1992. 4. The interest rate series used is one week Euro rates. The trading rules compare the current price with a moving average of historical prices. 5. He finds that the predictability of exchange rates diminishes during the periods when the Fed is inactive. • Osler (2000) examines the technical trading rules of support and resistance levels provided by six foreign exchange trading companies.  The data sample covers the period from 1996 to 1998.  The statistical test of the bootstrap technique is used.  The results show that signals are very successful in forecasting trend interruptions or reversals.  The findings also show that some companies are more accurate in identifying turning points in exchange rate trends.
  • 32.
    • Saacke (2002)Moreover, analyzing daily exchange rates of USD/DEM as well as daily USD and DEM overnight Euro rates, from January 1979 to July 1994, provides further evidence of the unusual profitability of applying technical trading strategies on days when the Fed and Bundesbank interventions take place. • The central banks are found to gain returns when they intervene in foreign exchange markets and with the usefulness of technical analysis. • Intervention returns and trading rule profitability are evaluated during horizons and post interventions. • Exchange rates are found to react in the opposite direction of central banks’ intentions in the short term, but in line with their targets in the long term. • The researchers find that the trading rules of using moving averages are considerably profitable on the days when the central banks interfere. • The findings also reveal that trading rules returns are still high on days in which interventions did not take place or on preceding days. • Osker (2003) examines clustering of foreign currency stop-loss orders as well as take profit orders as they are considered main orders when placing trading orders.  His data covers 9,655 orders with a total of more than $55 billion, from August 1, 1999, to April 11, 2000.  His sample covers three foreign currencies: USD/JPY, EUR/USD and GBP/USD.  He uses the crowded orders to provide an explanation for two common predictions of technical analysis.  First, trends are likely to reverse directions at support and resistance areas.  Second, trends are likely to move faster after prices penetrate such levels.  He finds that take-profit orders gather at round numbers, explaining the first profit forecasting, whereas stop- loss orders concentrate heavily just after round numbers; this explains the reason behind the second forecasting.  These findings are obtained based on the closing rates of both orders placed at the famous dealing bank of National Westminster. The order clustering phenomenon is due to different common reasons; round numbers are easy to remember and to place orders at as they are the first to come to anyone’s mind. The final results show that technical trading rules can be profitable for market participants.
  • 33.
    • Stephen (2008)examines the profitability of using technical models of moving averages and momentum that add up to 1024 technical trading rules in DM/USD.  He finds that all the trading rules are profitable.  The profitability is mainly because of the exploitation of exchange rate trends; the result stay valid even with sub-periods trading and declining profit during late 1980s.  Krishnan and Menon (2009) study the influence of foreign currencies, technical indicators and time frames on trading profits.  The research covers the period from September 2006 to October 2008 with 1,400 observations in the sample and two durations: one year and three months. The currency pairs include EUR/USD, GBP/USD, USD/CHF and USD/JPY.  The time frames cover five minutes, 15 minutes, 30 minutes, one hour, four hours and one day. The technical indicators used are five leading and five lagging.  The findings reveal that using technical analysis in foreign currency trading activities is profitable; all of the currencies.  The findings also show that short–term trading is riskier and of low liquidity, compared to the long-term trading.
  • 34.
    • Cekirdekci andIliev (2010): • The research examines a technical trading system using and back tests of around 250 stocks from various industry sectors, from April 2005 to April 2010. • The initial tested set ups include buy and sell filters, inside bar, simple and exponential moving averages, a volume indicator, per cent trailing exist, overbought and oversold areas of Relative Strength Index and candlesticks. • The results show that, when combining buy and sell signals with other indicators, such as the volume indicator, the opening range is a powerful model; it generates significant returns when traded with the correct stock. • Holmberg, Lönnbark and Lundström (2012) test the profitability of the trading strategy of the “Open Range Breakout (ORB), but in the US crude oil futures prices from March, 1983 to January, 2011. • The ORB is a trading rule that signals entry and exit rules once the price moves beyond predefined boundaries. Using the joint distribution of low, high, open and close prices over a period of time, the researchers find that their ORB trading rule significantly generates high returns
  • 35.
    • Other researchersin 2014-2015 delivered results of patterns : • The long position should be closed when: The RSI reading falls below the 50.00 level, or the market reaches and stagnates at a major level of resistance, trend line or other level of significance, or a Shooting Star/Bearish Engulfing formation appears. • A trader will look to go short when: The RSI reading is below the 50.00 level; second, a candlestick pattern such as a Shooting Star, or a Bearish Engulfing formation confirms the movement to the downside. The protective stop needs to be placed at the closest level of resistance. • The short position should be closed when: The RSI reading jumps above the 50.00 level, or the market reaches and stagnates at a major level of support, trend line or other level of significance, or a Hammer/Bullish Engulfing formation appears.
  • 36.
  • 37.
    RESEARCH OBJECTIVE • Toanalyze the COMPARATIVE STUDY OF SUCCESS RATES IN TWO TECHNICAL INDICATORS PERTAINING TO CRUDE OIL TRADING.
  • 38.
    SAMPLING DESIGN • SamplingArea : global commodity market • Sample collection : 50 each technical indicator • Sample Size : 200 METHODS  Primary Data : Primary data collected through live trading system of Multi Commodity Exchange  Secondary data : The secondary data is mostly collected from Websites, Books, Journals and Commodity broking companies  Research method : Correlational research  Sampling method : Stratified sampling
  • 39.
    RESEARCH DESIGN • Research: Descriptive & Objective • Data Source : primary source, Secondary data • Research Method : Survey Method • Research Technique : random sampling technique • Research tools : 1.candlesticks(Doji, Hammer, Inverse hammer). 2.Relative strength index • Data collection tools : mt4,mt5 soft wares.
  • 40.
  • 41.
  • 47.
  • 48.
    Categories in dataanalysis Candlesticks Inverse hammer Hammer doji Analysis candlesticks Relative strength index
  • 49.
    Candlestick analysis GROSS PROFITGROSS LOSS NET PROFIT 24277.4354 -8558.2525 15719.1829 -10000 -5000 0 5000 10000 15000 20000 25000 GROSS PROFIT GROSS LOSS NET PROFIT SERIES1 24277.4354 -8558.2525 15719.1829 24277.4354 -8558.2525 15719.1829 Doji
  • 50.
    0 10 20 30 40 50 60 70 80 TOTAL NO.OF SAMPLES NO.OF SUCCESSNO.OF FAILURES SUCCESS % 50 39 11 78% Doji TOTAL NO.OF SAMPLES NO.OF SUCCESS NO.OF FAILURES SUCCESS % 50 39 11 78 Candlestick analysis
  • 51.
    GROSS PROFIT GROSSLOSS NET PROFIT 33901.56 11303.92 22597.64 0 5000 10000 15000 20000 25000 30000 35000 GROSS PROFIT GROSS LOSS NET PROFIT SERIES1 33901.56 11303.92 22597.64 33901.56 11303.92 22597.64 VALUEINRUPEES HAMMER Candlestick analysis
  • 52.
    TOTAL NO.OF SAMPLESNO.OF SUCCESS NO.OF FAILURES SUCCESS % 50 40 10 80 Candlestick analysis
  • 53.
    GROSS PROFIT GROSSLOSS NET PROFIT 29063.03 -11152.13 17910.9 -15000 -10000 -5000 0 5000 10000 15000 20000 25000 30000 GROSS PROFIT GROSS LOSS NET PROFIT Series1 29063.03 -11152.13 17910.9 29063.03 -11152.13 17910.9 Gross profit/loss in Inverse Hammer candlestick Candlestick analysis
  • 54.
    TOTAL NO.OF SAMPLESNO.OF SUCCESS NO.OF FAILURES SUCCESS % 50 35 15 70 0 10 20 30 40 50 60 70 TOTAL NO.OF SAMPLES NO.OF SUCCESS NO.OF FAILURES SUCCESS % Series1 50 35 15 70 50 35 15 70% Successes &failures in Inverse Hammer Candlestick analysis
  • 55.
    successrate=(totalnumberofsuccesshappened/totalsamplevalue) success rate ofdoji success rate of hammer success rate of inverse hammer 78% 82% 70% 64% 66% 68% 70% 72% 74% 76% 78% 80% 82% success rate of doji success rate of hammer success rate of inverse hammer Series1 78% 82% 70% 78% 80% 70% success rates of candlesticks
  • 56.
    RSI ANALYSIS -30000 -20000 -10000 0 10000 20000 30000 40000 SN O 1 23 4 5 6 7 8 9 10 11 12 13 14 15 16 17 18 19 20 21 22 23 24 25 26 27 28 29 30 31 32 33 34 35 36 37 38 39 40 41 42 43 44 45 46 47 48 49 50 PROFIT/LOSS 0 33 66 27 75 85 77 14 -2 -2 -2 10 -5 43 49 26 -1 37 18 25 67 10 20 -2 -2 -1 56 90 15 18 23 39 -3 -8 18 23 45 82 16 22 44 50 92 10 20 -1 -4 55 -3 27 12 SELL VALUE AT $70 0 48 47 48 48 48 48 49 46 46 46 46 46 46 46 45 45 45 45 45 45 46 48 48 48 49 51 51 51 51 52 54 51 51 52 51 52 52 53 53 50 50 50 50 52 52 52 52 52 52 53 BUY VALUE AT $30 0 48 47 47 47 47 47 46 46 46 46 46 46 45 45 44 45 45 45 45 44 44 44 51 51 51 50 50 49 48 48 48 51 51 51 51 51 50 50 50 50 49 49 49 48 52 53 51 52 52 51 VALUESINRUPEES RSI ANALYSIS PERTAINING TO US OIL TRADING
  • 57.
    GROSS PROFIT GROSSLOSS NET PROFIT 335276.0115 -75280.6112 259995.4003 -100000 -50000 0 50000 100000 150000 200000 250000 300000 350000 GROSS PROFIT GROSS LOSS NET PROFIT Series1 335276.0115 -75280.6112 259995.4003 335276.0115 -75280.6112 259995.4003 RSI ANALYSIS
  • 58.
    TOTAL NO.OF SAMPLESNO.OF SUCCESS NO.OF FAILURES SUCCESS % 50 37 13 74 0 10 20 30 40 50 60 70 80 TOTAL NO.OF SAMPLES NO.OF SUCCESS NO.OF FAILURES SUCCESS % Series1 50 37 13 74 50 37 13 74% RSI SUCCESS RATE
  • 59.
    COMPARISION OF CRUDEOIL SUCCESS RATES IN DISTINCT CANDLESTICKS WITH RSI INDEX DOJI HAMMER INVERSE HAMMER DOJIHAMMER INVERSE HAMMER RSI
  • 60.
    DOJI VS RSI TOTALNO.OF SAMPLES SUCCESS percentage of DOJI SUCCESS percentage of RSI 50 78 74 0 10 20 30 40 50 60 70 80 TOTAL NO.OF SAMPLES SUCCESS percentage of DOJI SUCCESS percentage of RSI DOJI VS RSI Series1 50 78 74 50 78% 74% DOJI Vs RSI
  • 61.
    HAMMER Vs. RSI TOTALNO.OF SAMPLES SUCCESS percentage of HAMMER SUCCESS percentage of RSI 50 80 74 0 10 20 30 40 50 60 70 80 TOTAL NO.OF SAMPLES SUCCESS percentage of HAMMER SUCCESS percentage of RSI HAMMER Vs RSI Series1 50 80 74 50 80% 74% HAMMER Vs RSI
  • 62.
    INVERSE HAMMER Vs.RSI TOTAL NO.OF SAMPLES SUCCESS percentage of INVERSE HAMMER SUCCESS percentage of RSI 50 70 74 0 10 20 30 40 50 60 70 80 TOTAL NO.OF SAMPLES SUCCESS percentage of INVERSE HAMMER SUCCESS percentage of RSI INVERSE HAMMER Vs RSI Series1 50 80 74 50 70% 74% INVERSE HAMMER Vs RSI
  • 63.
    FINDINGS 1. From thestudy it is found that the success rate of hammer is much more than doji and invertible hammer when trading of crude oil in global commodity market 2. From the study it is found that Doji formation in candlesticks has given higher success rate than invertible hammer, but invertible hammer has given return in terms of rupees. 3. From the study it is found that the risk percentage in RSI is much more than candlestick 4. From the study it is found that RSI has given higher returns than candlesticks when trading global commodity market
  • 64.
    RECOMMENDATIONS 1. I recommendthe trader to use either candlestick or RSI for his intraday trading based on his risk taking capabilities. 2. The trader with lesser risk taking capabilities to use candlesticks for his intraday trading. 3. The trader who is expecting higher returns to use RSI for his intraday trading. 4. The trader who is using RSI to maintain proper amount in his DEMAT account /trading account.  Since the study is in short term the investors should be enable optimistic thinking and move on further.  I also strongly recommend that investors should not always depends on only one technical indicator in fluctuated market.
  • 65.
    SUGGESTIONS • I suggestthat investors who should capturing the crude oil trading in commodity market to make a sense of candlestick like hammer and inverse hammers trend points. • Investors rather optioned for RSI with long term changes in movement of values better to make use of simplified technique like Japanese candlestick trends. • In random walk study also prefer in Japanese analysis(candlestick). • Japanese candlestick is most contingency than other technical indicators & also simple to understand the short and long position variances in market conditions. • Investors should
  • 66.
    CONCLUSIONS • The candlesticksand relative strength index techniques for trading crude oil in global commodity market is having moderate success rates which gives a result greets towards investors to invest especially in commodities like crude oil. • The Exchange will continue to minimize the adverse effects of price volatilities; providing commodity ecosystem participants with neutral, secure and transparent trade mechanisms. • The risk averse capacity of investors should be OPTIMIZED and their level of satisfied results with candlestick techniques used in their early investments.
  • 67.
    REFERENCES 1. http://www.mcxindia.com/ 2. http://www.mt4.com/ 3.http://www.mt5.com/ 4. http://www.investing.com/commodi ties/crude-oil-candlestick 5. http://www.tradingportalen.com/ 6. http://www.rb- trading.com/article9.html 7. http://www.candlecharts.com/candl estick-charting-glossary.htm
  • 68.
  • 69.
    THANK YOU.!!!FOR YOUR KINDATTENTION & PATIENCE!!!!