WHAT IS
DATA?
Data areseparate fragments of
factual information collected
from various sources.
3.
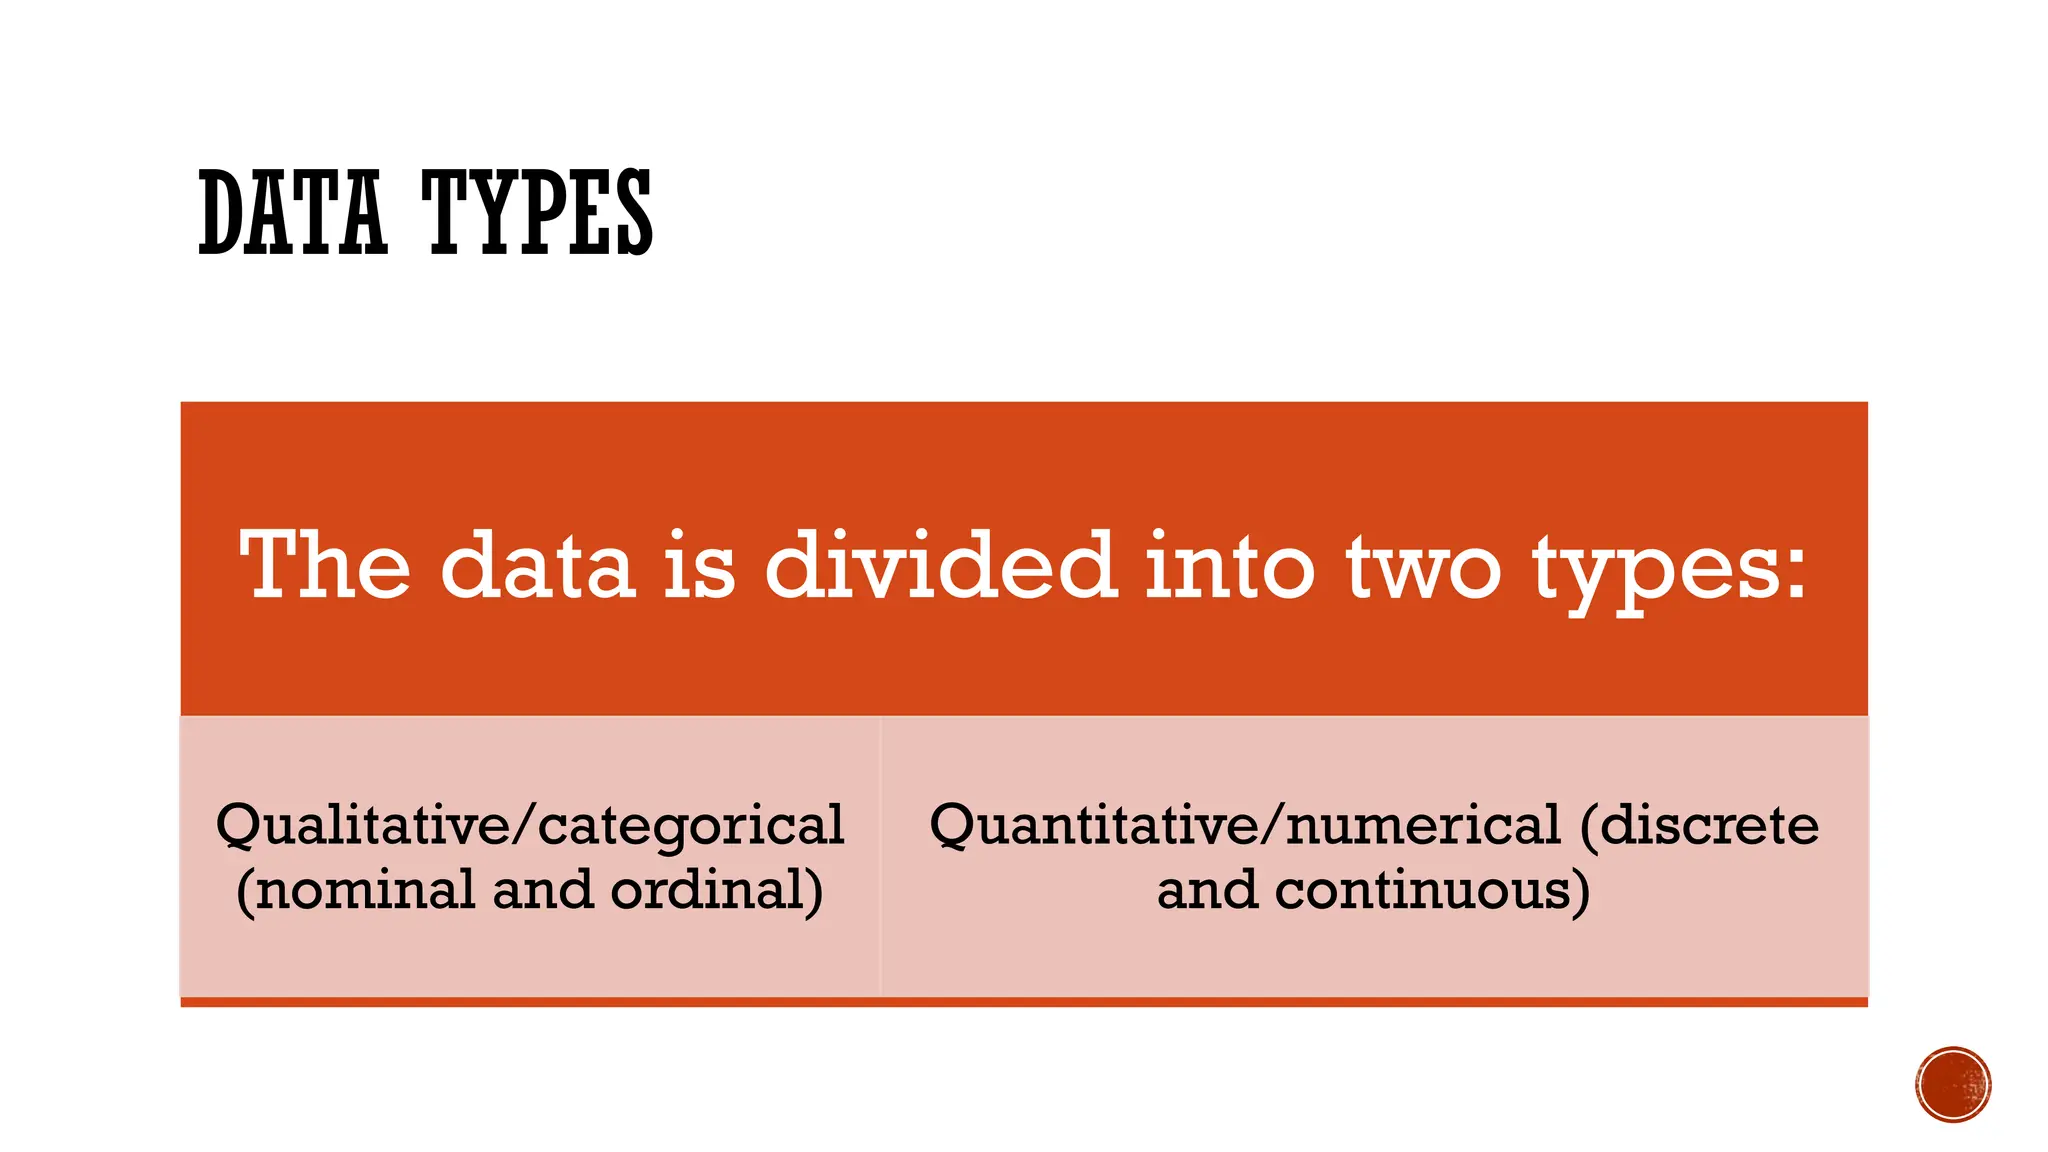
DATA TYPES
The datais divided into two types:
Qualitative/categorical
(nominal and ordinal)
Quantitative/numerical (discrete
and continuous)
4.
QUALITATIVE/CATEGORICAL
Nominal
1Nominalprovide data without a
measurable value (country, gender,
race, hair color). It's like a true-false
setup
Ordinal
Ordinal is categorical data with a
given order or scale (salary range,
movie rating)
5.
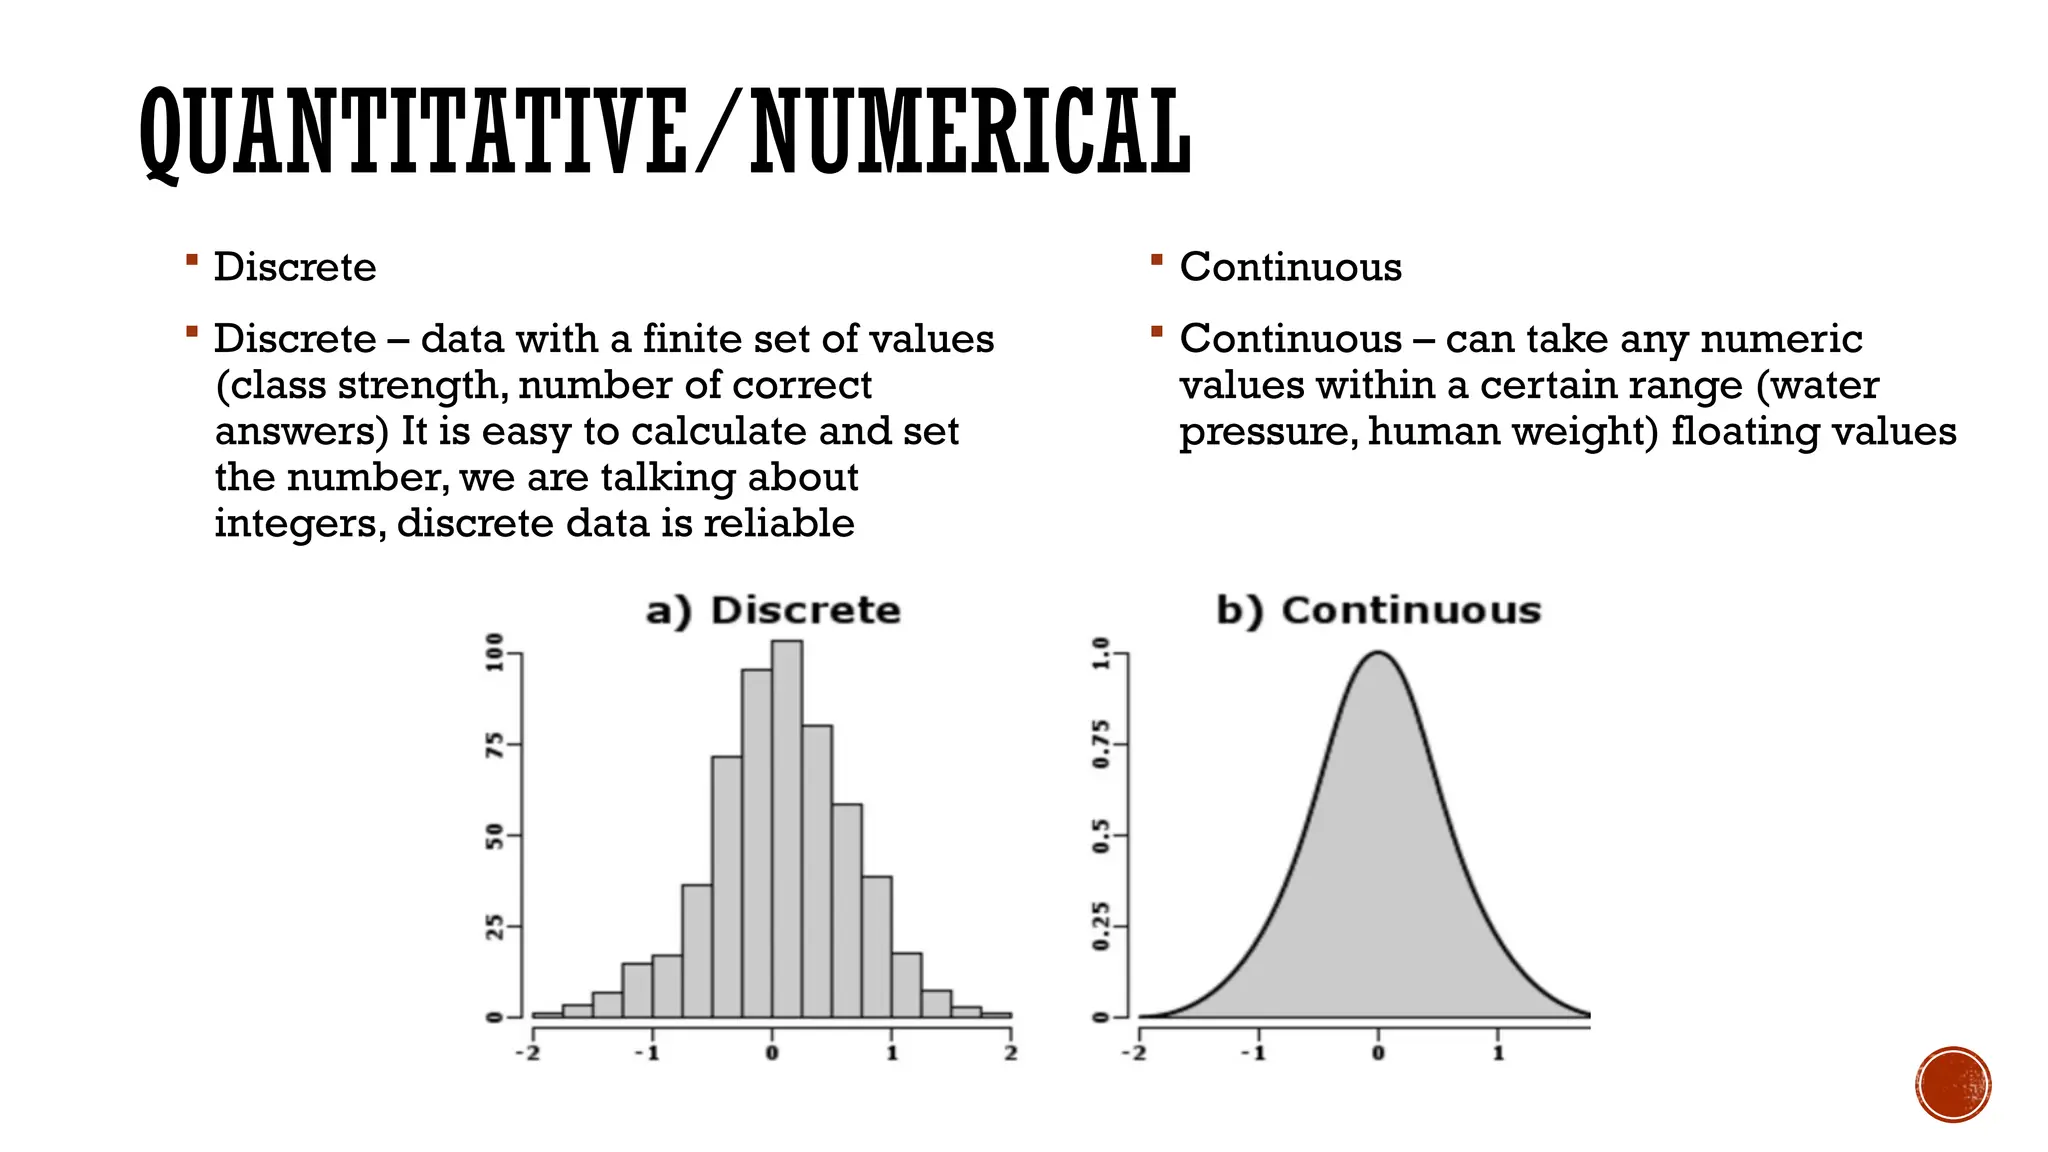
QUANTITATIVE/NUMERICAL
Discrete
Discrete– data with a finite set of values
(class strength, number of correct
answers) It is easy to calculate and set
the number, we are talking about
integers, discrete data is reliable
Continuous
Continuous – can take any numeric
values within a certain range (water
pressure, human weight) floating values
6.
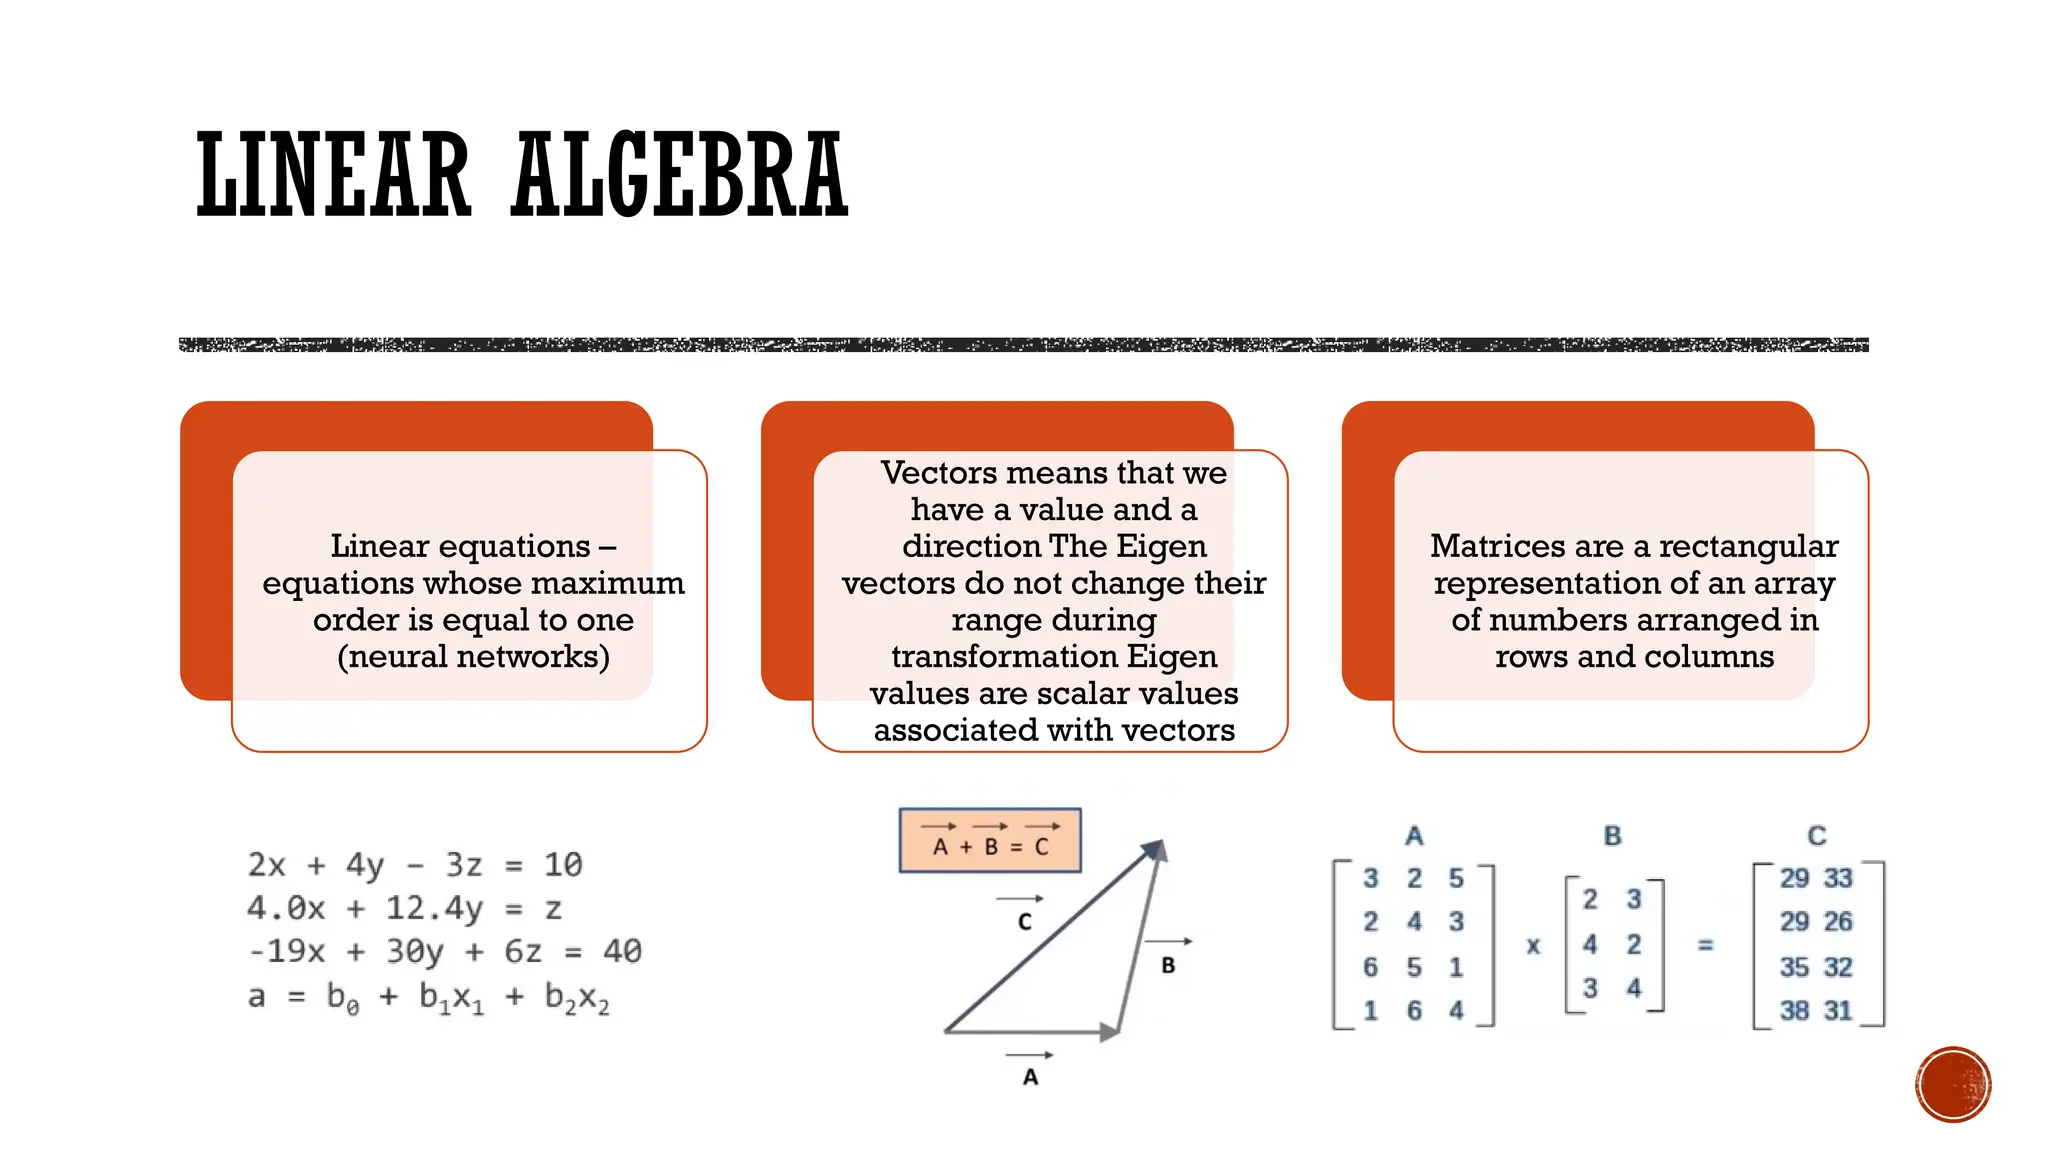
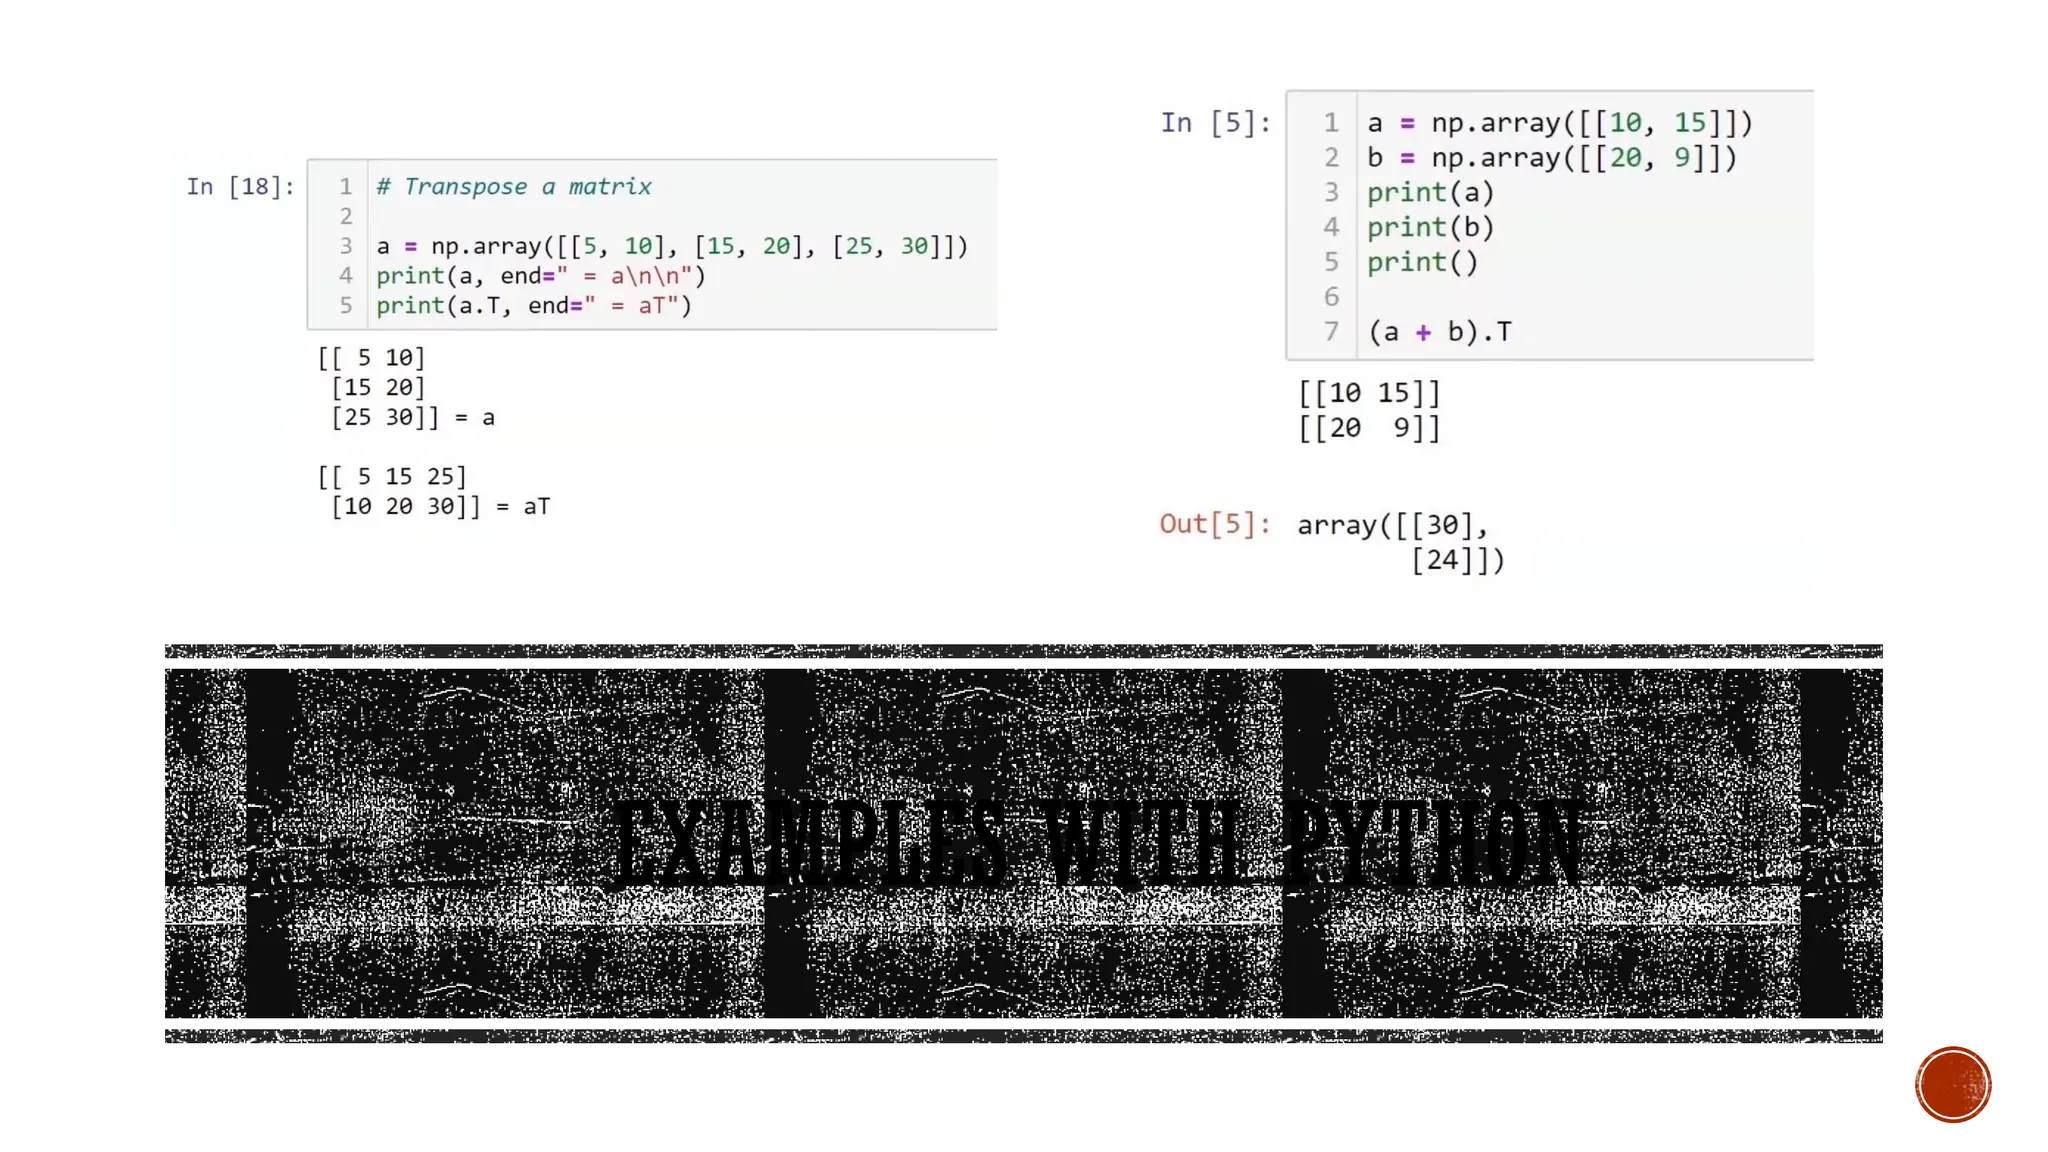
LINEAR ALGEBRA
Linear equations–
equations whose maximum
order is equal to one
(neural networks)
Vectors means that we
have a value and a
direction The Eigen
vectors do not change their
range during
transformation Eigen
values are scalar values
associated with vectors
Matrices are a rectangular
representation of an array
of numbers arranged in
rows and columns
DIFFERENTIATION
Helps to calculatethe spontaneous
rate of change
Suppose we plot a graph of the
speed of a car with respect to time
The rate of change of speed with
respect of time is nothing but
acceleration
The acceleration is the area
between the start point x and end
point delta 4 x
9.
MATHEMATICAL
ANALYSIS
Divide thetime interval into 10 sections and
you can calculate the acceleration for each
time interval, and then make this space smaller
and smaller until the delta x becomes almost
infinitesimal, thus we get the function
We calculate this slope on smaller and smaller
samples. This is called mathematical analysis.
Matanalysis is an integral. The area under the
slope is the main integration process
10.
INTEGRATION
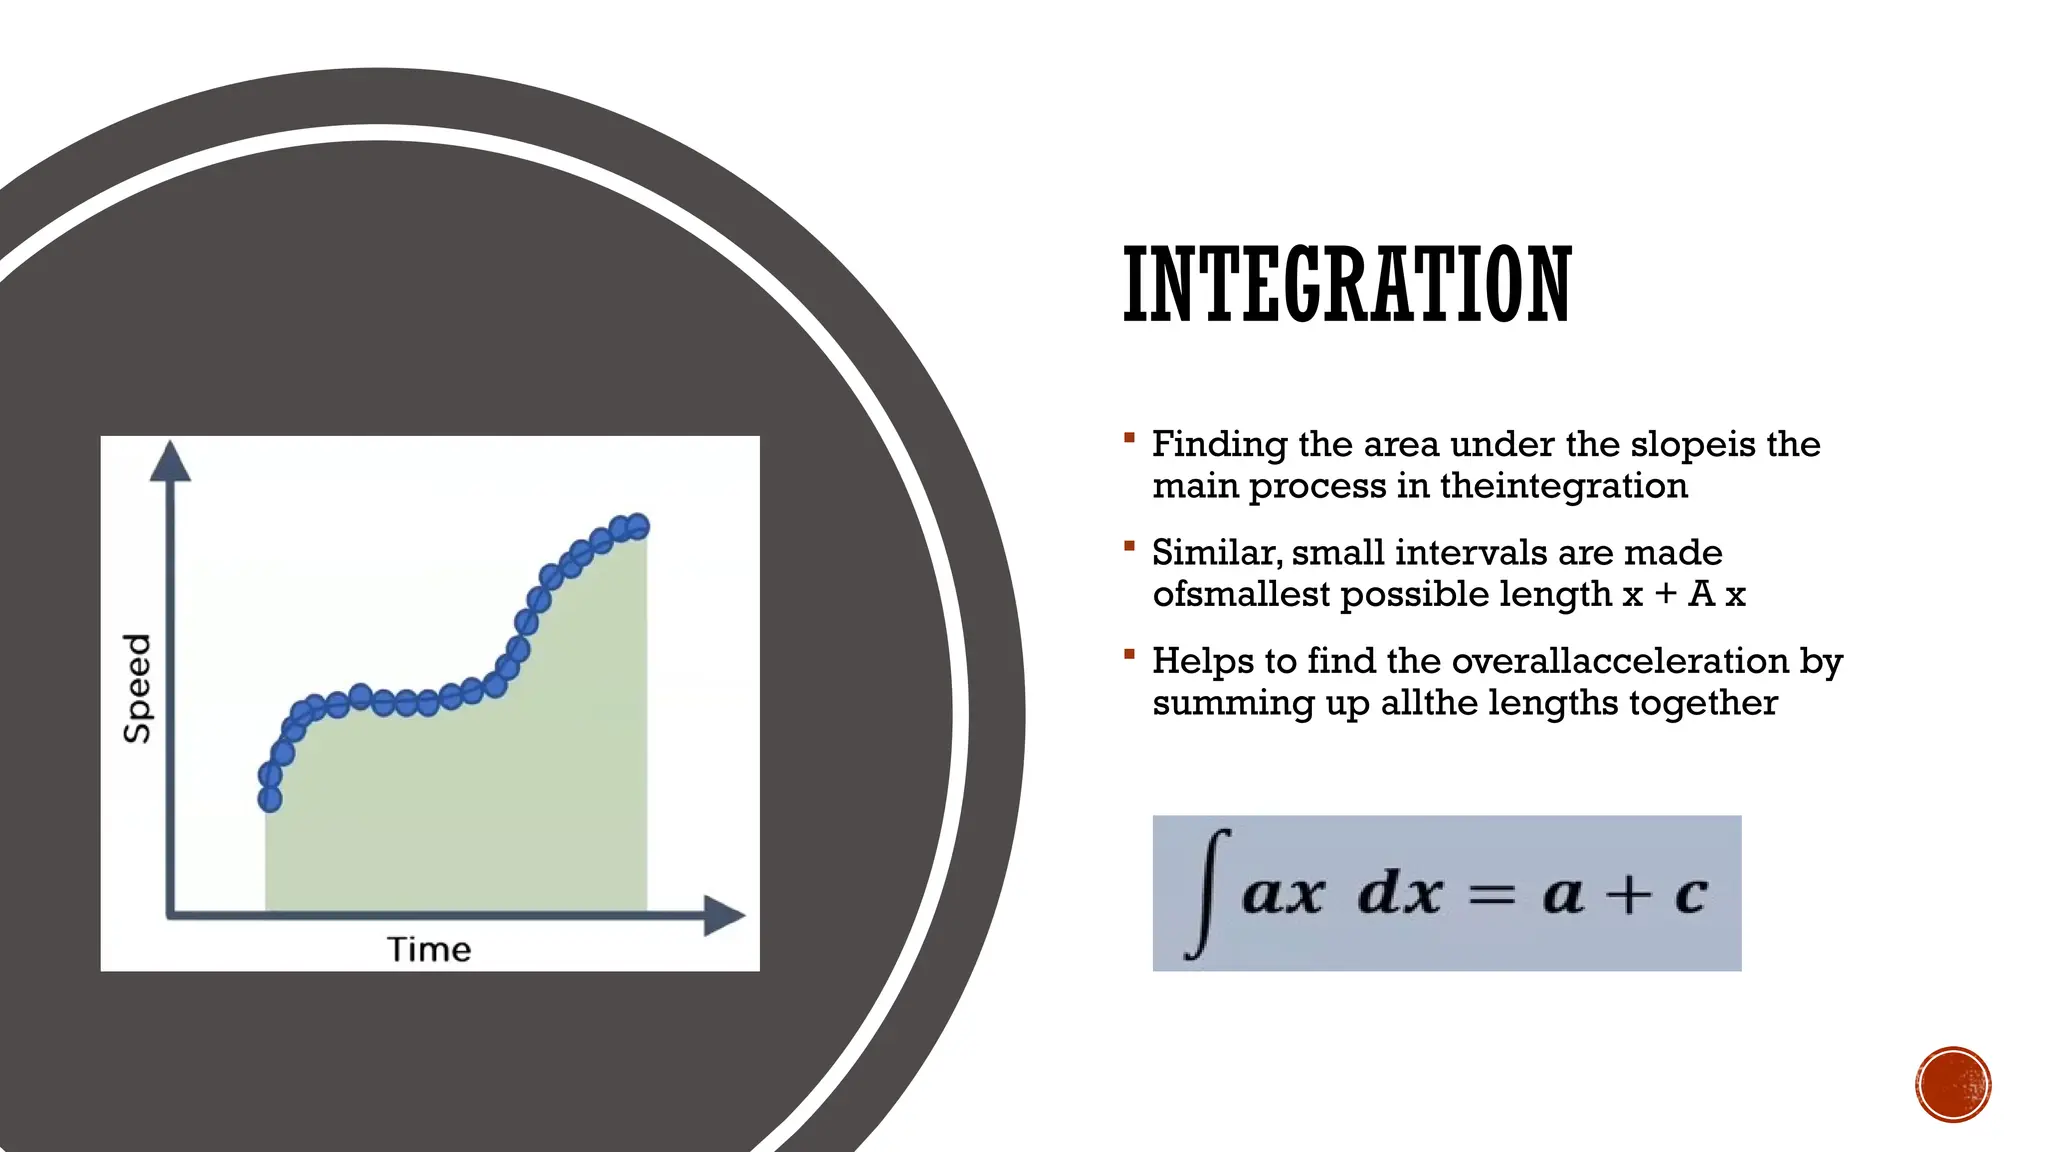
Finding thearea under the slopeis the
main process in theintegration
Similar, small intervals are made
ofsmallest possible length x + A x
Helps to find the overallacceleration by
summing up allthe lengths together
11.
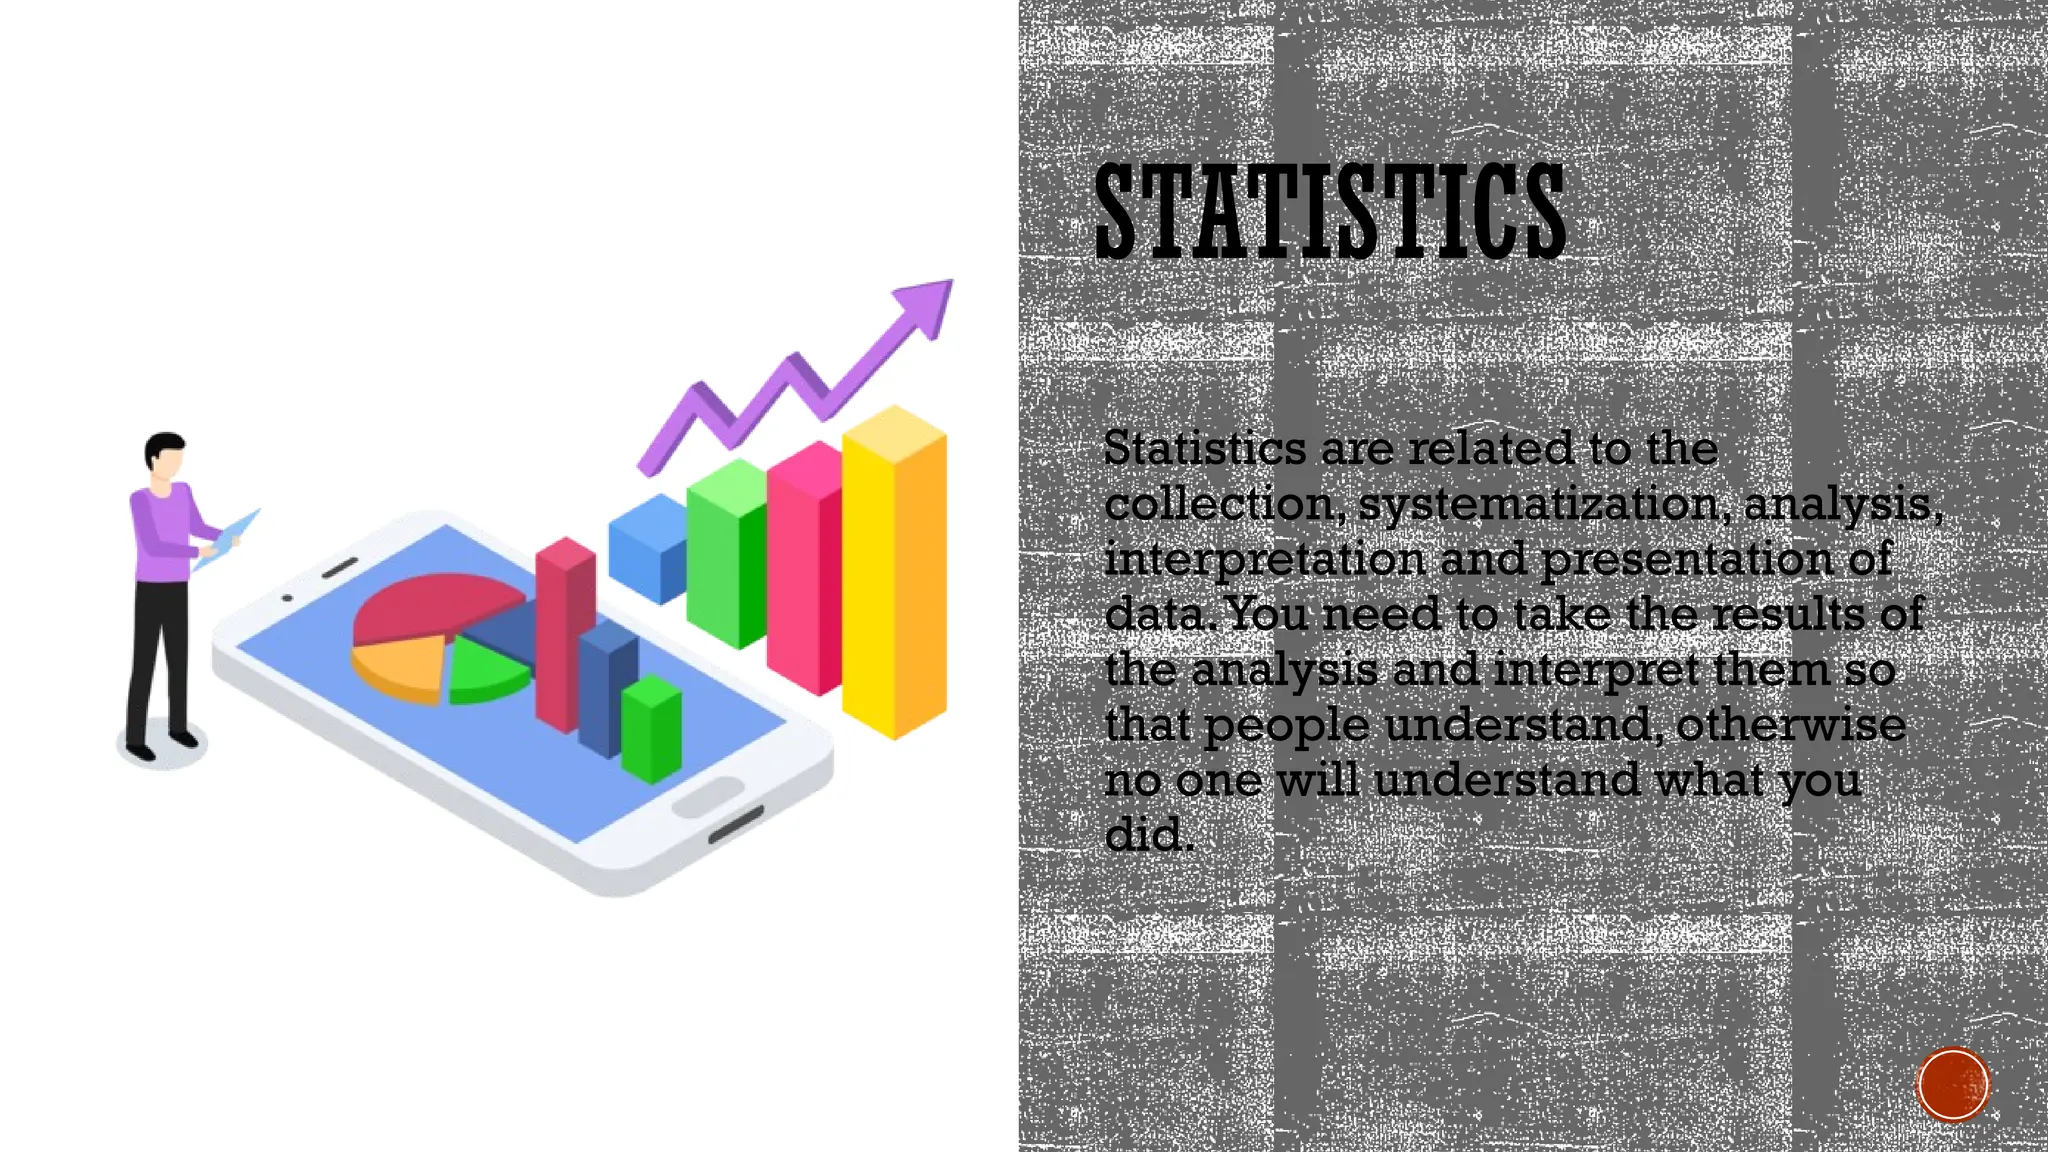
STATISTICS
Statistics are relatedto the
collection, systematization, analysis,
interpretation and presentation of
data.You need to take the results of
the analysis and interpret them so
that people understand, otherwise
no one will understand what you
did.
12.
IMPORTANT TERMINOLOGY
Population –all objects or dimensions whose
properties will be observed
Parameter – an indicator used to represent the
characteristics of the population
The sample is a subset of the studied population
A variable is an indicator of interest in each person or
object in the population
13.
TYPES OF SAMPLING
1.The probabilistic approach is to select samples from a large population using a
method based on probability theory
Random sampling – we select random-sized samples from a group or category. So
this is as random a sample as possible.
Systematic sampling – we select random-sized samples from a group or category
with a fixed or periodic interval
Stratified sampling – selects approximately equal-sized samples from different
groups or categories
2. Non-probabilistic approach – to choose samples based on the subjective
judgment of the investigator and not on random selection (very biased, you need to
be careful)