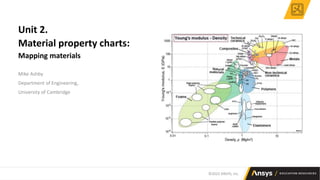
This document provides an overview of a lecture on material property charts. It discusses how charts can help visualize relationships between material properties and map families of materials. The lecture will cover creating different types of charts using Granta EduPack software, including bar charts and bubble charts, and using tools to annotate and customize charts. It also discusses using the software to generate reports and manage chart projects. The overall goal is for students to understand how to extract meaning and make selections from materials data using visualization and charts.
![©2022 ANSYS, Inc.
8
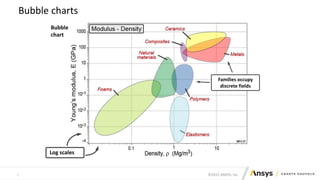
Bubbles chart created with Granta EduPack
Display Box:
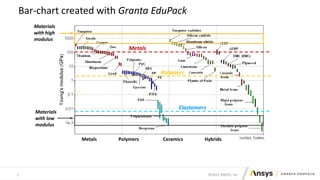
Materials with
high Modulus and
Density
Display line:
Materials
with constant
specific stiffness
[E/]](https://image.slidesharecdn.com/material-property-charts-lecture-unit-2-pptchaen22-230523214802-8e1b7ad5/85/material-property-charts-lecture-unit-2-pptchaen22-pptx-8-320.jpg)


![Module I MATERIAL TESTING AND EVALUATION [BTCVE506A]](https://cdn.slidesharecdn.com/ss_thumbnails/module-i-191020175247-thumbnail.jpg?width=640&height=640&fit=bounds)


