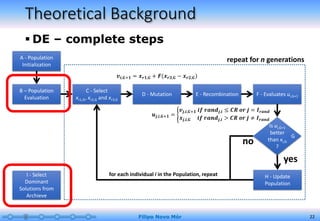
Downloaded 23 times
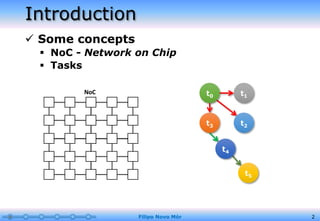
![Related Work
• J. R. Ku and S. G. Ku [34]
• Two phases:
• clustered high communicating tasks into partitions
• Used NSGA-II algorithm
• Mapped these partitions onto NoC processors.
• Tried to keep high communicating partitions close to each other
• Used a second version of the NSGA-II algorithm
• 15% more efficient then Physical Mapping Algorithm
• C. Deng et al. [41]
• Changed the classical DE
• Included a sorting step before chromosomes recombination
• For high-level task graphs, free of a target hardware architecture
Filipo Novo Mór 29](https://image.slidesharecdn.com/masterthesisfilipodefensev1publicavel-160901043353/85/Master-Thesis-Defense-30-320.jpg)
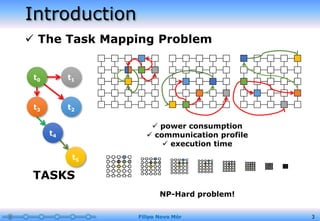
![Related Work
• Sen Zhao et al. [45]
• Proposed a MODE using an adaptative mutation operator.
• The strategy is changed during runtime to try achieving better solutions on the
fly
• The resulting vector is now compared with the whole population, not only with
your ’father’
• Tested using benchmark ZDT functions only
• D. Das, M. Verma and A. Das [58]
• Hardware/software partitioning problem using DE
• Objective functions: execution time, area cost and communication cost
• DE ran 16% faster than PSO
• Quality of acieved solutions were not described
• Zhuo Qingqi et al. [51]
• Solving Task Mapping problem combining two evolutionary algorithms (not DE)
• Parallel approach for searching the solution space
• MPEG-4 and VOPD (Video Objective Plane Decoder) benchmark applications
• Saves 13% on energy and is 3% more efficient in communication latency
Filipo Novo Mór 30](https://image.slidesharecdn.com/masterthesisfilipodefensev1publicavel-160901043353/85/Master-Thesis-Defense-31-320.jpg)
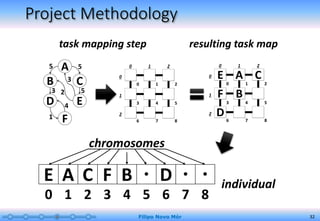
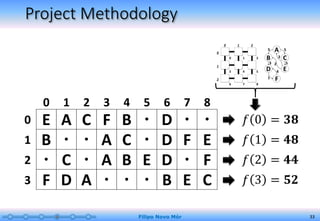
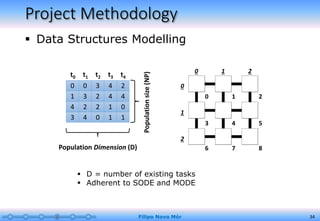
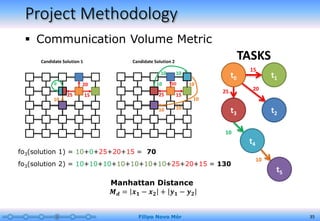
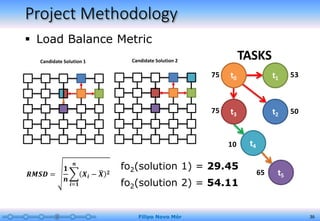

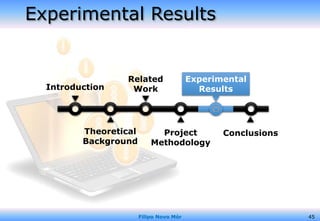
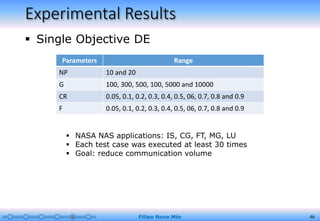
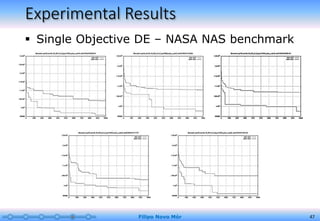

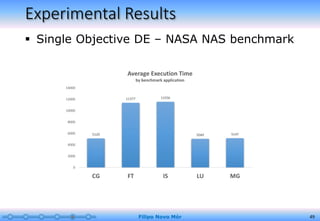

This document outlines the presentation for a master's thesis defense. It includes sections on the introduction, theoretical background, related work, project methodology, experimental results, and conclusions. The introduction discusses concepts like network-on-chip and the task mapping problem. The theoretical background section covers task mapping algorithms including differential evolution. The related work section summarizes previous research applying evolutionary algorithms to task mapping. The project methodology describes how the data is modeled and the metrics used to evaluate communication volume and load balance.


![[AIoTLab]attention mechanism.pptx](https://cdn.slidesharecdn.com/ss_thumbnails/aiotlabattentionmechanism-230406114603-e5ba0365-thumbnail.jpg?width=640&height=640&fit=bounds)


![[Paper review] BERT](https://cdn.slidesharecdn.com/ss_thumbnails/paperreviewbert-190507052754-thumbnail.jpg?width=640&height=640&fit=bounds)