This document provides revenue and cost estimates for the construction and first three years of operation of a proposed gaming and entertainment development called Marvel Gaming LLC. It is estimated to cost $235 million to construct over 24 months. In the first year of operation, it is estimated to generate $51.6 million in revenue for the City of Sumner and surrounding areas, with a $49.6 million surplus. Ongoing annual revenues are projected to be over $50 million with surpluses of tens of millions each year, providing substantial benefits to the local communities.
This document provides revenue and cost estimates for the construction and first three years of operation of a casino development project in multiple locations. It estimates revenues from gaming, property taxes, sales taxes and other sources over three years, and estimates costs to local and state governments for services. It shows the development generating a surplus for local governments each year, with deficits for one county's school district in years 1 and 3.
This document provides a fiscal impact analysis of a proposed development by Pinnacle Entertainment in Wyandotte County, Kansas. It estimates revenues and costs to state and local governments over 5 years of construction and operation. The analysis estimates total revenues to state and local governments of over $282 million in the first year of operation, with surpluses each year thereafter. It also notes voluntary contributions by the developer, including $4 million for infrastructure improvements from 2009-2011 and $2 million in charitable contributions.
This document provides a fiscal impact analysis of a proposed casino and resort development called Golden Heartland in Kansas. It summarizes estimated revenues and costs to different state and local governments over a 5-year period from the development's construction through its operation. Revenues come from gaming, property, sales, and other taxes. Costs include law enforcement, public works, education and other services. The analysis finds the development would generate significant financial surpluses for the state and local communities.
This document provides a fiscal impact analysis of a proposed Dodge City Resort & Gaming development conducted by Meridian Business Advisors in September 2008. It estimates revenues and costs to the state of Kansas, Ford County, Dodge City, and local schools over five years if the development is built. Construction is estimated to take 3 years with revenues and costs estimated for the construction period and first two full years of operation. Total estimated revenues to all entities over 5 years are over $150 million while total estimated costs are around $50 million, resulting in a net positive fiscal impact.
This document provides a fiscal impact analysis of the proposed Legends Sun development in Kansas over 5 years. It estimates revenues and costs to state and local governments from property, sales, gaming and other taxes. Revenues are projected to significantly exceed costs, generating millions in annual surpluses for the state and local communities. Voluntary contributions by the developer are also projected to support infrastructure and community services.
The document provides a budget and performance summary for Ekiti State of Nigeria for 2010. It shows:
- Revenue was estimated at N69.9 billion but actual performance was N42.4 billion, or 60.65% of estimate. Recurrent revenue was estimated at N40.6 billion but came in at N23.9 billion, or 58.83% of estimate.
- Expenditure was estimated at N69.9 billion but actual spending was N42.3 billion, or 60.42% of estimate. Recurrent expenditure was estimated at N31.9 billion and actual was N31.5 billion, or 98.66% of estimate.
- Key revenue sources
This document provides cost and revenue information for a proposed real estate development project. It includes a breakdown of acquisition costs totaling $74,155,266. It also provides projected annual gross rents totaling $7,877,537 for the first stabilized year. Estimated operating expenses are provided, resulting in a projected net operating income of -$683,066 for the first year. The document also includes calculations for tax payments, returns on investment, and a potential sale of the property in year 10 with a net cash to the seller of $247,533,050.
Tentative Amendments to the 2014 Executive Budget Recommendationcookcountyblog
This document contains two proposed amendments to Cook County's FY2014 budget. Amendment 1 proposes increasing funding for veterans assistance services by $100,000. Amendment 2 makes various technical adjustments to positions and salaries across multiple county departments while keeping the overall budget impact neutral. Both amendments require approval from the County Board.
The document is a budget execution report for revenues of the Municipality of Titirivi for the period of January 1, 2012 to December 31, 2012. It shows the initial budget appropriation, additions, collections from the period, definitive appropriation, total collections, balance to collect, and percentage of collection for different revenue items like taxes, rates and rights, fines, stamps, and transfers from other levels of government. The largest revenue items were the General System of Participation transfers from the national government for health, education, water and sanitation, and other purposes. Revenues were 18% lower than the definitive appropriation.
The document provides preliminary budget estimates for Cook County, Illinois for fiscal year 2014. It shows that revenues are projected to increase from the 2013 projected year-end amount of $2.262 billion to $2.395 billion in 2014. Expenditures are expected to rise from $2.281 billion in 2013 to $2.547 billion in 2014, resulting in an estimated ending balance shortfall of $152 million. The document includes details on projected revenues and expenditures by department for 2013 and 2014.
This document summarizes the budget expenditures as of December 31, 2017 for the Parish of Puembo. It shows the initial budget allocation, amounts committed, incurred, and paid for various line items such as personnel costs, goods and services, transfers, and investments. The largest expenditures were on personnel remuneration, food services, cultural and social events, and construction materials. At year-end, there were unspent balances totaling over $450,000 available to carry over into the new fiscal year.
This document provides a fiscal impact analysis of a proposed casino and entertainment development in Kansas. It estimates revenues and costs to state and local governments over a 5-year period. Revenues are projected from gaming, property, sales, income and other taxes. Costs include law enforcement, public works, education and fire protection. The analysis finds the development would generate a surplus for governments each year, with total projected revenue of over $500 million by year 5.
This document summarizes the budget size and performance of Ekiti State, Nigeria for the year ending December 2015. It shows the estimated and actual revenue and expenditure for both recurrent and capital budgets. The recurrent revenue was 78.4% of estimates while capital receipts exceeded estimates by 84.02%. Recurrent expenditure exceeded estimates by 35.14% while capital expenditure was 23.48% of the estimate. Overall, revenue was 94.27% of estimate and expenditure was 93.71% of the estimated budget.
This document summarizes the budget size, revenue, and expenditure for Ekiti State, Nigeria for 2013. It shows that the estimated budget was N101.5 billion while actual revenue was N73.5 billion, representing 72.45% performance. Estimated expenditure was N101.3 billion while actual was N77.4 billion, representing 76.42% performance. Recurrent revenue was estimated at N49.4 billion but actual was N41.5 billion, representing 83.96% performance. Capital receipts were estimated at N43.2 billion but actual was N32 billion, representing 74.17% performance.
The document provides budget and performance data for Ekiti State, Nigeria for 2014. Key points:
- Revenue was estimated at ₦55.3 billion but actual was ₦28.7 billion, only 52% of estimate. Major sources like IGR and sundry receipts underperformed significantly.
- Expenditure was estimated at ₦58.8 billion but actual was ₦53 billion, 90% of estimate. Capital expenditure severely underperformed at only 35% of estimate.
- As a result, the net cash balance increased to ₦5.2 billion in 2014 compared to a ₦1.1 billion balance in 2013, due to
This document provides budget execution information for revenues for the municipality of Titiriri from January to December 2010. It shows the initial budget appropriation, additions, revenues collected during the period, and the definitive budget appropriation. It also shows the amount collected, amount remaining to collect, and percentage collected for each revenue item. The revenues are grouped into current revenues, current revenues for special purpose, and transfers from the national government.
This document provides budget execution information for revenues for the municipality of Titirivi for the period of January 1, 2011 to December 31, 2011. It shows the initial budget appropriation, additions, revenues collected during the period, definitive appropriation, total revenues collected, balance left to collect, and percentage of revenues collected. It provides this information broken down by categories of current revenues from national, departmental, and local sources. Overall, revenues collected during the period represented 8% of the definitive appropriation, with 96% still left to collect.
This document summarizes revenue and expenditure estimates and actual performance for Ekiti State of Nigeria for 2016. Key points:
- Total estimated revenue was 71.3 billion naira but actual revenue was 70.6 billion naira, achieving 99.1% of target. Independent revenue exceeded target, while statutory allocations underperformed.
- Total estimated expenditure was 71.3 billion naira but actual expenditure was 64 billion naira, achieving only 89.8% of target. Recurrent expenditure achieved 101.7% of target while capital expenditure significantly underperformed at 64.2% of target.
- The opening cash balance was 6.9 billion naira. After accounting for
This document summarizes the budget size and actual performance of revenue and expenditure for Ekiti State, Nigeria in 2012. It shows that revenue was 70.85% of the estimate while expenditure was 94.30% of the estimate. Recurrent revenue was 82.01% of the estimate while capital receipts were 57.56% of the estimate. Recurrent expenditure was 118.44% of the estimate while capital expenditure was 66.41% of the estimate.
This document provides a fiscal impact analysis of a proposed casino development by Butler National Service Corporation in Dodge City, Ford County, Kansas. It includes estimates of annual revenue and costs to state and local governments over a 5-year period from 2009 to 2013. Revenue includes gaming revenue sharing, property taxes, sales taxes, and other sources. Costs include estimates for law enforcement, public works, education, fire protection and other services. The analysis finds the development would generate a surplus for state and local governments each year, with the largest surpluses occurring in the earlier years of temporary operations and construction.
This document provides revenue and cost estimates for the proposed Harrah's Kansas casino and resort over a three year period from construction through the first full year of operation. It estimates that construction will take 24 months, with the opening date in August 2010. During construction in years 1 and 2, it estimates revenues from gaming revenue sharing and developer contributions, along with costs for law enforcement, public works, fire protection and EMS. In the first full year of operation, it estimates higher revenues from gaming, property taxes, sales taxes and income taxes, along with increased costs for law enforcement and other services. Over the three year period it estimates the project will generate millions in revenues for the local communities and surplus funds.
This document summarizes the fiscal impact findings of a proposed casino development with two phases. It provides estimates of construction costs, permanent and construction jobs, annual visitors, gaming revenue, and projected 7-year revenue and costs for state, local and school governments. Revenues are estimated to significantly exceed costs, generating millions in surpluses for state, county and school budgets. The developer will also make voluntary contributions to local organizations.
This document provides revenue and cost estimates for a proposed casino development over three years of construction and operations. It estimates that in year two, during construction, the development will generate over $2 million in state sales tax revenue and $566,766 in county sales tax revenue from building materials purchases and FF&E. In year three of operations, it estimates over $1.7 million in taxable retail sales will generate $91,255 in state sales tax and $25,827 in county sales tax revenue. The development is also projected to provide millions of dollars in annual property tax revenue for local governments.
This document provides a 3-year summary of estimated revenues and costs for several jurisdictions related to a new construction project. In year 1, revenues are estimated at $58.5 million with costs of $10.1 million, resulting in a surplus of $48.4 million. Year 2 estimates revenues of $60.5 million and costs of $10.1 million for a surplus of $50.5 million. The revised consultant estimates for year 3 show total revenues across jurisdictions of $36.1 million and total costs of $13.3 million, resulting in a combined surplus of $22.8 million over the 3-year period.
Daycare: Urban Land Development ProjectAshley Garvey
This document summarizes a proposed daycare center project located in Goddard, Kansas. It includes a description of the property, market analysis showing demand for childcare, and financial projections for developing a 4,000 square foot building. The projections estimate development costs of $677,078, annual operating income of $51,500, and annual cash flow after taxes of over $10,000. The projections also include a potential sale of the property in year 10 for $861,438 to $984,500.
The document analyzes the fiscal impact of two proposed gaming facilities in Kansas. For Global Gaming in Wellington, it estimates annual revenues of $200 million for the state and surpluses for other entities. For Peninsula Gaming in Mulvane, it estimates annual revenues of $289 million for the state and surpluses for other entities except the city of Mulvane which would have a deficit. The analysis also compares the applicants' estimates to the consultant's estimates.
The document is the 2017 approved budget for Ekiti State, Nigeria. It provides a summary of the overall budget, internally generated revenue, personnel costs, grants to parastatals, consolidated revenue fund charges, capital allocations, projects, and transfers to other funds. The budget totals 94.456 billion naira in revenue and expenditures.
This document contains tables summarizing land management revenues, expenses, employment and output for Idaho and several other states over a five year period from 2008-2012. It also contains tables comparing these metrics across multiple states and estimating potential revenues, expenses and employment if Nevada were to manage additional public lands using models from other states. Revenues come from activities like grazing, agriculture/residential leases, timber, minerals and more.
The document outlines Seattle Girls' School's strategic financial plan from 2012-2015. It projects income and expenses over this period, anticipating a slight surplus each year. Major sources of income are tuition, fundraising events, and endowment payments. Expenses are primarily personnel costs. The plan also details a multi-year campus campaign to fund building renovations, targeting a total of $895,074 from various sources including annual fundraising, a family campaign, and endowment growth.
The quarterly financial report summarizes the city's finances as of June 30, 2021. For the general fund, revenues were at 85% of budget while expenditures were at 64% of budget, leaving the fund with a positive operating balance. Property tax collections reached 96% of budget and sales tax revenues were at 79% of budget. The utility fund revenues were at 84% of budget and expenditures were at 57% of budget, also leaving a positive operating balance. Overall, the city's financial position remains positive at the end of the third quarter.
This document provides a quarterly financial report for the city as of March 31, 2023. It summarizes revenues and expenditures for the general fund and utility fund. For the general fund, property tax collections are at 91% of budget and revenues are at 76% of budget while expenditures are at 45% of budget. The investment portfolio totaled $32.2 million with a weighted average maturity of 161 days and an average yield of 4.05%. Overall, the city's financial position is positive at the halfway point of the fiscal year.
This document provides financial projections for a two-year period for a venue called 2Live Venue. It includes projections for net sales, expenses, profits, and cash flow on a quarterly basis. Key figures include projected net income of $277,745 in Year 1 and $569,930 in Year 2, with a two-year total net profit of $847,675. Capital expenses of $353,484 are required pre-launch, with total capital raised of $626,645 including $200,000 from an outside investor for 15% equity in the business.
Ut intertech-preliminary-draft-public-land-mgmt-task-force-report-tablesAmerican Lands Council
This document contains tables summarizing revenues, expenditures, employment, and land management over five years for the Bureau of Land Management nationwide. It shows that from 2008 to 2012, BLM revenues increased from $5.9 billion to $5 billion while expenditures increased from $2.2 billion to $2.4 billion. The number of acres managed also increased slightly over this period. Key metrics like revenue, expenditures, and net revenue per acre fluctuated over the five years.
The document discusses the city's proposed 2012-2013 budget, including allocating $1.7 million for capital projects, exploring additional borrowing capacity of up to $47.6 million, and identifying solutions like increasing fees and taxes to address an $1.7 million gap in the operating budget. It also provides details on revenues and expenses for various city departments and services.
This document contains projected income and expenses for a restaurant for the year 2019. It projects monthly and yearly sales for food, beverages and total gross sales. It also projects monthly and yearly costs for cost of goods sold, general and administrative expenses including employee salaries, rent, utilities and other fixed costs. The projections show a controllable monthly profit of over $21,000 and yearly profit of over $241,000 after accounting for all expenses. A schedule is also included showing projected staffing needs by position and hours to support the anticipated sales volumes.
This document provides an overview and agenda for the City of College Station's budget workshops for the General Fund O&M. It discusses the budget process and timeline, strategic plan objectives focused on financial sustainability, revenue assumptions including decreases in property values, sales tax, and population growth, and proposed expenditure reductions through position cuts and decreased departmental expenses. While the FY2021 budget is balanced, future year forecasts project declining revenues that may require further service reductions if mitigation strategies are not sufficient.
The quarterly financial report summarizes the city's finances for the second quarter of the fiscal year ending March 31, 2022. Overall revenues are meeting or exceeding budget for most funds. The general fund revenues are 72% of budget while expenditures are 46% of budget, leaving a positive balance. Property tax collections are at 90% of budget. The utility fund revenues are 48% of budget and expenditures are under budget at 35%, also leaving a positive balance. The investment portfolio increased over the quarter and continues to comply with city investment policies.
The memorandum analyzes three development alternatives for a historic property site: new construction, full historic rehabilitation, and a hybrid option. A pro forma analysis shows the historic rehabilitation option has the highest internal rate of return at 20.5% and peaks within 5 years, making it the recommended choice as it provides an acceptable return for the developer while supporting local historic preservation goals. The city should be aware the developer may sell the property within 8 years when the IRR begins to decline and use this as leverage to ensure high tenant performance if new ownership takes over.
This group of experienced regional casino developers and operators proposes to build Kansas Crossing casino and hotel in southeast Kansas. The development is expected to generate $69 million in initial construction spending, create hundreds of jobs, and generate $10 million annually for state and local governments through taxes. As the largest entertainment venue in the region, Kansas Crossing aims to boost tourism by attracting out-of-state visitors and partnering with local organizations to promote southeast Kansas.
This document summarizes Douglas Walker's presentation on forecasting economic impacts and competitive impacts of casinos in southeast Kansas. Some key points:
- Walker estimates that a new casino would result in a 9.9% increase in employment, 3.4% increase in average weekly wages, and 1.7% increase in the number of establishments in the county. Crawford County is estimated to see larger gains due to its larger population.
- 14 casinos in northeast Oklahoma located within 25 miles of the Kansas border could competitively impact the proposed southeast Kansas casinos. Walker uses a model of competition among Missouri casinos to analyze these competitive effects.
- Location and distance between casinos may impact competition based on Hot
The document provides an analysis of the potential fiscal impacts of three proposed gaming facilities - Camptown Casino, Kansas Crossing Casino, and Castle Rock Casino - in southeast Kansas. It summarizes the methodology used, including adjustments made to the revenue estimates provided by the applicants. Revenue estimates over 5 years are provided for the state of Kansas, local counties and cities, school districts, and other impacted entities. Estimated costs to local and state governments to provide services to each facility are also summarized. The analysis finds differences between the revenue and cost estimates provided by EEC and the original numbers submitted by the applicants.
Civic Economics (Dan Houston, Matt Cunningham)krgc
The document analyzes the potential economic impacts of three proposed gaming facility projects in Kansas: Camptown, Kansas Crossing, and Castle Rock. It finds that Castle Rock would have the largest economic impact during construction, supporting over 900 jobs and contributing $134.2 million to total economic output. During operations in 2019, Castle Rock is estimated to support 584 jobs and contribute $72.9 million to economic output, more than the other two proposals. The analysis examines impacts from construction spending, facility operations, gaming revenues, and local resident spending.
Union Gaming Analytics was commissioned by the Kansas Lottery Gaming Facility Review Board to evaluate three applicants for a gaming license in southeast Kansas. The analysis included projections for gross gaming revenue, visitation numbers, tax revenue, and economic impacts for each applicant. The methodology involved examining demographic data within drive time radii of the proposed sites, establishing a theoretical gaming market, and applying proprietary capture rates to project revenues and visitation from local, near-local, and regional populations. Consultants then evaluated the economic and fiscal impacts, amenities, and financial suitability of each applicant.
The document analyzes and evaluates the financial suitability of three applicants for a gaming license in Southeast Kansas: Frontenac Development, Castle Rock Casino Resort, and Kansas Crossing Casino. For each applicant, it summarizes the ownership structure, project budget, proposed financing sources, and Union Gaming's analysis and conclusion on their financial viability and ability to fund the projects. While Frontenac and Kansas Crossing were deemed sufficiently capitalized, Castle Rock's ability to obtain the required debt financing was called into question due to uncertainties around land valuation and high projected leverage.
The three proposed casino projects in Kansas Southeast Zone are similar in their Phase 1 concepts, having a minimum critical mass to win the bid but also achieve initial success. Camptown and Kansas Crossing propose smaller local casinos, while Castle Rock proposes a larger regional destination. All have similar potential for Phase 1 success despite different strengths and weaknesses. The key decision is whether to prefer two smaller local casinos or one larger regional casino. The regional casino has the greatest revenue potential but also the least room for error. The owner/team's ability to adapt may be more important than initial plans. However, the tax rate difference between Kansas and Oklahoma gives Oklahoma casinos an advantage in any marketing war.
This document provides an overview and analysis of projections for new casinos proposed in southeastern Kansas. It discusses the use of gravity models to project gaming revenues and financial performance based on location, size, competition and other factors. Specifically, it examines how spending declines with distance from a casino based on players' club and other data. Bigger casinos are generally better due to economies of scale. The presentation compares various existing casinos' "power ratings" which reflect their overall attractiveness based on revenues adjusted for location.
Camptown Casino will be located in Frontenac, Kansas. It will include 750 slot machines, 20 table games, a 62-room hotel, and Gilley's Saloon entertainment venue. Phil Ruffin, an experienced casino operator, will personally finance the $84 million project. It is projected to create 300 jobs and attract nearly 1 million visitors annually from Missouri, Kansas, and other nearby states. Camptown aims to open sooner than competing proposals and will donate $50,000 annually to the local school district.
2015 LGFRB Presentation Castle Rock Casino Resort krgc
This document provides details about the proposed Castle Rock Casino Resort development project. It outlines the developers, architects, management company, contractors, and legal consultants involved. It also provides information on the size and amenities of the casino, hotel, meeting space, and other facilities. Projected revenues, taxes, employment, and visitation are presented. The management and development experience of the casino operator, American Casino and Entertainment Company, is summarized.
Global Gaming KS, LLC presented to the Kansas Lottery Gaming Facility Review Board on their proposal for a gaming facility. They argued that their selected Exit 19 site is clean with infrastructure, has community support, and avoids legal issues. Their planned 260,000 square foot facility with hotel would open fully within 14 months. While an interim facility lacks appeal, their permanent destination-quality development would include restaurants, entertainment, and gaming expansion over time. They believe revenue differences between Exit 19 and 33 sites are negligible and addressed counterarguments.
The document discusses two proposed casino projects in Kansas - Kansas Star and WinSpirit. Kansas Star promises to invest $260 million, build amenities sooner including a 100,000 square foot event center and $25 million equestrian complex, and generate more gaming revenue, taxes, and jobs for the state. It argues Kansas Star's management team has more experience building and operating successful casino projects on time and on budget and will spend more on advertising to drive higher revenue. The document positions Kansas Star as the best and most lucrative choice for Kansas.
The document discusses the benefits of meditation for reducing stress and anxiety. Regular meditation practice can calm the mind and help prevent worrying thoughts. Meditation lowers stress levels in the body by reducing blood pressure and cortisol levels.
Dean Macomber summarizes his analysis of Global Gaming's proposal for a race track as a tourism generator. He finds that Global's projections of attracting a "Big Event" with 50,000-100,000 visitors are speculative given the limited number of comparable racing events and competition from existing tracks. Their projections of smaller events generating the remaining 50,000 visitors also seem aggressive. In contrast, an equestrian center like Peninsula proposes could attract equine, entertainment, and convention events more reliably as a tourism generator.
peninsula plans meet or exceed drainage standardskrgc
The document is a letter from Christopher Young, a civil engineering consultant, to the chairman of the Kansas Lottery Gaming Facility Review Board regarding a proposed drainage system for a proposed Kansas Star Casino development. Young serves as the City Engineer for Mulvane, Kansas and has reviewed drainage plans submitted by the developer. He concludes that the proposed drainage improvements, including a detention pond facility, will meet or exceed the City of Mulvane's stormwater drainage policy by having outflow rates less than existing conditions for 2-, 5-, 10-, and 100-year storm events.
This document is a response from Cummings Associates to submissions from Global Gaming Solutions regarding revenue projections and the effects of distance on revenues. Cummings disagrees with some of Global Gaming's assertions, such as that the revenue differential between two proposed casino sites is mostly due to attractiveness rather than distance. Cummings also argues that survey data is not an accurate predictor of economic behavior like casino spending. Overall, Cummings believes distance has a larger impact on revenues than Global Gaming suggests, based on Cummings' analysis of casino performance data from multiple markets.
The memorandum summarizes a request from the Kansas Lottery Gaming Facility Review Board for additional information about two competing casino applications in Kansas. Specifically, it provides details about 1) drainage and flooding issues at the proposed sites, 2) local approvals and endorsements for the sites, and 3) the experience of one applicant, Peninsula Gaming, with regulatory bodies in other states where criminal charges have been filed against the company and its executives related to campaign contributions. It concludes that the significant risks associated with approving Peninsula's application, including possible disqualification or inability to finance the project, outweigh any potential benefits over the other applicant, Global.
The marketing plan outlines a soft opening period followed by a grand opening 90 days later for a new casino in Sumner County, Kansas. The $1 million budget will be used for advertising, promotions, and community events to generate awareness and excitement. Key objectives include building a local player base within 100 miles, attracting travelers on Interstate 35, and establishing the casino as a new entertainment destination through gaming, restaurants, a hotel, and live entertainment events.
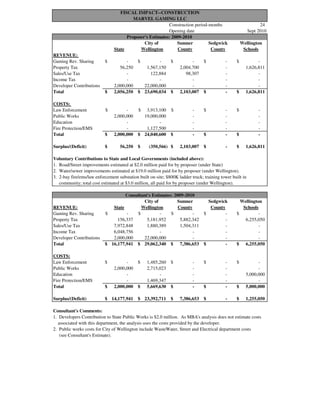
1. Construction period-months 24
Opening date Sept 2010
City of Sumner Sedgwick Wellington
State Wellington County County Schools
REVENUE:
Gaming Rev. Sharing -$ -$ -$ -$ -$
Property Tax 56,250 1,567,150 2,004,700 - 1,626,811
Sales/Use Tax - 122,884 98,307 - -
Income Tax - - - - -
Developer Contributions 2,000,000 22,000,000 - - -
Total 2,056,250$ 23,690,034$ 2,103,007$ -$ 1,626,811$
COSTS:
Law Enforcement -$ 3,913,100$ -$ -$ -$
Public Works 2,000,000 19,000,000 - - -
Education - - - - -
Fire Protection/EMS - 1,127,500 - - -
Total 2,000,000$ 24,040,600$ -$ -$ -$
Surplus/(Deficit) 56,250$ (350,566)$ 2,103,007$ -$ 1,626,811$
Voluntary Contributions to State and Local Governments (included above):
1. Road/Street improvements estimated at $2.0 million paid for by proposer (under State)
2. Water/sewer improvements estimated at $19.0 million paid for by proposer (under Wellington).
3. 2-bay fire/ems/law enforcement substation built on-site; $800K ladder truck; training tower built in
community; total cost estimated at $3.0 million, all paid for by proposer (under Wellington).
City of Sumner Sedgwick Wellington
REVENUE: State Wellington County County Schools
Gaming Rev. Sharing -$ -$ -$ -$ -$
Property Tax 156,337 5,181,952 5,882,342 - 6,255,050
Sales/Use Tax 7,972,848 1,880,389 1,504,311 - -
Income Tax 6,048,756 - - - -
Developer Contributions 2,000,000 22,000,000 - - -
Total 16,177,941$ 29,062,340$ 7,386,653$ -$ 6,255,050$
COSTS:
Law Enforcement -$ 1,485,260$ -$ -$ -$
Public Works 2,000,000 2,715,023 - - -
Education - - - - 5,000,000
Fire Protection/EMS - 1,469,347 - - -
Total 2,000,000$ 5,669,630$ -$ -$ 5,000,000$
Surplus/(Deficit) 14,177,941$ 23,392,711$ 7,386,653$ -$ 1,255,050$
Consultant's Comments:
1. Developers Contribution to State Public Works is $2.0 million. As MBA's analysis does not estimate costs
associated with this department, the analysis uses the costs provided by the developer.
2. Public works costs for City of Wellington include WasteWater, Street and Electrical department costs
(see Consultant's Estimate).
Proposer's Estimates: 2009-2010
Consultant's Estimates: 2009-2010
FISCAL IMPACT--CONSTRUCTION
MARVEL GAMING LLC
2. City of Sumner Sedgwick Wellington
State Wellington County County Schools
REVENUE:
Gaming Rev. Sharing 49,458,816$ 2,060,784$ 2,060,784$ 2,060,784$ -$
Property Tax 101,250 1,662,591 2,843,439 - 2,183,774
Sales/Use Tax - 307,210 245,768 - -
Income Tax - - - - -
Developer Contributions - - - - -
Total 49,560,066$ 4,030,585$ 5,149,991$ 2,060,784$ 2,183,774$
COSTS:
Law Enforcement -$ 697,000$ -$ -$ -$
Public Works - - - - -
Education - - - - 49,500
Fire Protection/EMS - 1,792,000 - - -
Total -$ 2,489,000$ -$ -$ 49,500$
Surplus/(Deficit) 49,560,066$ 1,541,585$ 5,149,991$ 2,060,784$ 2,134,274$
Voluntary Contributions to Communities and Governments (not included above):
1. Local community contributions in 1st year of operations of $1.0 million.
2. Sumner County economic growth fund, funded with 1.0% of GGR.
3. Contribute $2.3 million to Wellington Golf Club.
4. Committed to program to provide employees with matching funds of 5% of down payment on
house, not to exceed $7,500.
City of Sumner Sedgwick Wellington
REVENUE: State Wellington County County Schools
Gaming Rev. Sharing 31,810,920$ 1,325,455$ 1,325,455$ 1,325,455$ -$
Property Tax 115,275 3,820,893 4,337,323 - 4,612,138
Sales/Use Tax 2,237,656 527,749 422,199 - -
Income Tax 2,291,112 - - - -
Developer Contributions - - - - -
Total 36,454,962$ 5,674,096$ 6,084,977$ 1,325,455$ 4,612,138$
COSTS:
Law Enforcement -$ 595,322$ 1,008,959$ -$ -$
Public Works - 134,775 - - -
Education - - - - 1,580,158
Fire Protection/EMS - 1,033,572 - - -
Total -$ 1,763,669$ 1,008,959$ -$ 1,580,158$
Surplus/(Deficit) 36,454,962$ 3,910,428$ 5,076,018$ 1,325,455$ 3,031,979$
Consultant's Comments:
Marvel GGR Estimate 217,333,855$ Visitors/Day 8,250
Consultants' GGR Estimate 132,545,500$ Visitors/Day 4,955
Proposer's Estimates-1st Full Year
FISCAL IMPACT--12 MONTHS OPERATING
MARVEL GAMING LLC
Consultant's Estimates: 1st Full Year
3. * 2 Years Construction + 1 Year Operating
City of Sumner Sedgwick Wellington
State Wellington County County Schools
REVENUE:
Gaming Rev. Sharing 49,458,816$ 2,060,784$ 2,060,784$ 2,060,784$ -$
Property Tax 157,500 3,229,741 4,848,139 - 3,810,585
Sales/Use Tax - 430,094 344,075 - -
Income Tax - - - - -
Developer Contributions 2,000,000 22,000,000 - - -
Total 51,616,316$ 27,720,619$ 7,252,998$ 2,060,784$ 3,810,585$
COSTS:
Law Enforcement -$ 4,610,100$ -$ -$ -$
Public Works 2,000,000 19,000,000 - - -
Education - - - - 49,500
Fire Protection/EMS - 2,919,500 - - -
Total 2,000,000$ 26,529,600$ -$ -$ 49,500$
Surplus/(Deficit) 49,616,316$ 1,191,019$ 7,252,998$ 2,060,784$ 3,761,085$
City of Sumner Sedgwick Wellington
REVENUE: State Wellington County County Schools
Gaming Rev. Sharing 31,810,920$ 1,325,455$ 1,325,455$ 1,325,455$ -$
Property Tax 271,612 9,002,844 10,219,665 - 10,867,187
Sales/Use Tax 10,210,504 2,408,138 1,926,510 - -
Income Tax 8,339,868 - - - -
Developer Contributions 2,000,000 22,000,000
Total 52,632,903$ 34,736,437$ 13,471,630$ 1,325,455$ 10,867,187$
COSTS:
Law Enforcement -$ 2,080,582$ 1,008,959$ -$ -$
Public Works 2,000,000 2,849,798 - - -
Education - - - - 6,580,158
Fire Protection/EMS - 2,502,918 - - -
Total 2,000,000$ 7,433,298$ 1,008,959$ -$ 6,580,158$
Surplus/(Deficit) 50,632,903$ 27,303,138$ 12,462,671$ 1,325,455$ 4,287,029$
FISCAL IMPACT--3 YEAR SUMMARY*
MARVEL GAMING LLC
Proposer's Estimates
Consultant's Estimates
4. SQUARE FEET ESTIMATED ESTIM. CONSTR. FF&E
YEAR USE TYPE CONSTRUCTED CONSTR. COST MATERIALS COST PURCHASES
Year 1 Casino 29,283 23,805,297$ 6,048,891$ -$
Hotel 70,275 57,128,649 14,516,306 -
Restaurants 19,685 16,002,525 4,066,218 -
Entertainment 21,633 17,586,384 4,468,674 -
Health Club/Spa 620 504,017 128,070 -
Retail 2,012 1,635,344 415,539 -
Subtotal 143,508 116,662,216 29,643,699 -
Year 2 Casino 58,567 24,195,565 12,097,783 36,427,676
Hotel 140,550 58,065,226 29,032,613 15,425,324
Restaurants 39,370 16,264,873 8,132,437 4,320,847
Entertainment 43,267 17,874,698 8,937,349 4,748,505
Health Club/Spa 1,240 512,279 256,140 136,090
Retail 4,023 1,662,154 831,077 441,560
Subtotal 287,017 118,574,796 59,287,398 61,500,000
TOTAL 430,525 235,237,012$ 88,931,097$ 61,500,000$
APPENDIX 1, ASSUMPTIONS:
1. Construction of the development is estimated to take 24 months (September 2008 to September 2010).
Sq. Footage Other Information
Casino 87,850 2,000 slot machines, 65 table games
Hotel 210,825 132 guest rooms and 172 suites
Restaurants 59,055 restaurants and bars
Entertainment 64,900 sporting event/convention space
Health Club/Spa 1,860
Retail 6,035
Total 430,525
Source: Developer's application (final template).
2. Construction costs are estimated using above square footages and cost breakdown provided by the developer
in its template document (land is added in year 1, 33% of buildings are added in year 1 and remainder in year 2, FF&E added in year 2):
Land Building FF&E* Total**
57,374,818$ 177,862,194$ 61,500,000$ 296,737,012$
*FF&E-furniture, fixtures and equipment, including gaming equipment which is allocated to casino.
**Total amounts do not equal investment amounts as the analysis excludes soft costs such as engineering, architecture,
finance and administration costs for property tax calculation purposes.
Source: Developer's application (final template).
3. Construction materials cost estimated at 50% of building costs. This cost is estimated for
sales tax purposes. Source: Discussions with commercial developers in Nevada.
APPENDIX 1
BUILDOUT ASSUMPTIONS AND ESTIMATED CONSTRUCTION COST
AT FULL DEVELOPMENT
5. EST. REAL EST. PERSONAL CUMULATIVE ESTIMATED WELLINGTON CITY OF SUMNER STATE OF
PROPERTY PROPERTY PROPERTY ASSESSED SCHOOL DIST. WELLINGTON COUNTY KANSAS
YEAR USE TYPE VALUE VALUE VALUE VALUE REVENUE REVENUE REVENUE REVENUE
Year 1 Casino 23,805,297$ -$ 23,805,297$ 5,951,324$
Hotel 57,128,649 - 57,128,649 14,282,162
Restaurants 16,002,525 - 16,002,525 4,000,631
Entertainment 17,586,384 - 17,586,384 4,396,596
Health Club/Spa 504,017 - 504,017 126,004
Retail 1,635,344 - 1,635,344 408,836
Subtotal 116,662,216 - 116,662,216 29,165,554 1,750,371$ 1,450,082$ 1,646,075$ 43,748$
Year 2 Casino 24,195,565 36,427,676 85,142,697 21,285,674
Hotel 58,065,226 15,425,324 132,333,058 33,083,265
Restaurants 16,264,873 4,320,847 37,068,321 9,267,080
Entertainment 17,874,698 4,748,505 40,737,178 10,184,294
Health Club/Spa 512,279 136,090 1,167,506 291,877
Retail 1,662,154 441,560 3,788,118 947,030
Subtotal 118,574,796 61,500,000 300,236,878 75,059,220 4,504,679$ 3,731,869$ 4,236,267$ 112,589$
Year 3 Casino - - 86,604,148 21,651,037
Hotel - - 135,840,290 33,960,073
Restaurants - - 38,050,745 9,512,686
Entertainment - - 41,816,838 10,454,209
Health Club/Spa - - 1,198,449 299,612
Retail - - 3,888,515 972,129
Subtotal - - 307,398,985 76,849,746 4,612,138$ 3,820,893$ 4,337,323$ 115,275$
TOTAL 235,237,012$ 61,500,000$ 10,867,187$ 9,002,844$ 10,219,665$ 271,612$
APPENDIX 2, ASSUMPTIONS:
1. Tax rate will remain constant at 2007 amount:
Entity-Fund Tax Rate* *rate per $1,000 of assessed value.
School District 60.0150$
City 49.7190$
County 56.4390$
State 1.5000$
Source: "Sumner County 2007 Levies," provided by Shane Shields, Sumner County Clerk. Rates include all funds for which property tax revenues are collected.
2. Properties are valued using the fair market value approach. As no comparable sales data exists and this is considered to be a "new and unique" property, the analysis uses the replacement
cost approach to value these properties. Source: "A Homeowner’s Guide to Property Tax in Kansas." Kansas Department of Revenue.
3. Assessed value estimated at 25% of appraised value for both real and personal property.
Source: "Treasurer/Clerk" Questionnaire provided by Gus Collins, City Manager, Wellington, Kansas.
4. Appraised value is inflated 3% annually for real property and not inflated for personal property to account for depreciation.
APPENDIX 2
ESTIMATED PROPERTY TAX REVENUE AT
2007 PROPERTY TAX RATE
6. CONSTRUCTION TOTAL CITY OF SUMNER STATE OF
SQUARE FT. MATERIALS FF&E RETAIL TAXABLE WELLINGTON COUNTY KANSAS
YEAR BUILT COST ($) PURCHASES SALES SALES REVENUE REVENUE REVENUE
Year 1 Casino 29,283 6,048,891$ -$ -$ 6,048,891$
Hotel 70,275 14,516,306 - - 14,516,306
Restaurants 19,685 4,066,218 - - 4,066,218
Entertainment 21,633 4,468,674 - - 4,468,674
Health Club/Spa 620 128,070 - - 128,070
Retail 2,012 415,539 - - 415,539
Subtotal 143,508 29,643,699 - - 29,643,699 370,546$ 296,437$ 1,571,116$
Year 2 Casino 58,567 12,097,783 36,427,676 - 48,525,458
Hotel 140,550 29,032,613 15,425,324 - 44,457,937
Restaurants 39,370 8,132,437 4,320,847 - 12,453,283
Entertainment 43,267 8,937,349 4,748,505 - 13,685,854
Health Club/Spa 1,240 256,140 136,090 - 392,229
Retail 4,023 831,077 441,560 - 1,272,637
Subtotal 287,017 59,287,398 61,500,000 - 120,787,398 1,509,842$ 1,207,874$ 6,401,732$
Year 3 Casino - - - - -
Hotel - - - - -
Restaurants - - - 36,885,394 36,885,394
Entertainment - - - 744,936 744,936
Health Club/Spa - - - - -
Retail - - - 4,589,586 4,589,586
Subtotal - - - 42,219,916 42,219,916 527,749$ 422,199$ 2,237,656$
TOTAL 430,525 88,931,097$ 61,500,000$ 42,219,916$ 192,651,013$ 2,408,138$ 1,926,510$ 10,210,504$
APPENDIX 3, ASSUMPTIONS:
1. Sales tax rate is as follows: Designation
1.250% City
1.000% County
5.300% State
7.550% TOTAL
Source: "All Jurisdictions and Rates in this Zip Code." Kansas Department of Revenue.
2. Materials Cost - 50% of construction cost is assumed to be materials cost.
Source: Discussion with Nevada contractors
3. Retail sales based on 760$ per square foot. Source: Developer's template for first year retail revenue divided by retail square footage.
F&B sales based on 625$ per square foot. Source: Developer's template for first year F&B revenue divided by F&B square footage.
Entertainment sales based on 11.48$ per square foot. Source: Developer's template for first year entertainment revenue divided by entert. square footage.
4. Year 3 assumes first full year of operation.
APPENDIX 3
SALES TAX REVENUE
7. ESTIMATED CITY OF SUMNER SEDGWICK STATE OF STATE PROB.
GAMING WELLINGTON COUNTY COUNTY KANSAS GAMBLING
YEAR REVENUE REVENUE REVENUE REVENUE REVENUE REVENUE
Year 1 Casino -$ -$ -$ -$ -$ -$
Year 2 Casino - - - - - -
Year 3 Casino 132,545,500 1,325,455 1,325,455 1,325,455 29,160,010 2,650,910
TOTAL 132,545,500$ 1,325,455$ 1,325,455$ 1,325,455$ 29,160,010$ 2,650,910$
APPENDIX 4, ASSUMPTIONS:
1. Estimated Gross Gaming Revenue (GGR) is the average GGR estimated in Wells and Cummings reports:
Wells GGR 134,991,000$
Cummings GGR 130,100,000
Average 132,545,500$
Source: "Kansas Casino Market Study" by Wells Gaming Research dated July 7, 2008 and "Projections for Likely Gaming Revenues"
by Cummings Associates dated July 7, 2008.
2. Local government revenue is estimated as follows:
State of Kansas 22% of all lottery gaming revenues.
State Prob. Gambling 2% of all lottery gaming revenues.
Sumner County 1% of all lottery gaming revenues.
Sedgwick County 1% of all lottery gaming revenues.
City of Wellington 1% of all lottery gaming revenues.
Source: SB 66.
3. Year 3 assumes first full year of operation.
APPENDIX 4
LOTTERY GAMING CONTRIBUTION REVENUE
8. ESTIMATED ESTIMATED STATE OF
PAYROLL PAYROLL/ KANSAS INCOME
YEAR EXPENDITURES EMPLOYEE TAX REVENUE
Year 1 Construction 57,724,113$ 39,029$ 3,024,378$
Operating - - -
Subtotal 57,724,113 39,029 3,024,378
Year 2 Construction 57,724,113 39,029 3,024,378
Operating - - -
Subtotal 57,724,113 39,029 3,024,378
Year 3 Construction - - -
Operating 46,656,000 30,695 2,291,112
Subtotal 46,656,000 30,695 2,291,112
TOTAL 162,104,226$ 108,753$ 8,339,868$
APPENDIX 5, ASSUMPTIONS:
1. Estimated construction payroll is provided by the Developer at 115,448,226$
during the construction phase of the project. This includes salaries only, no benefits are included.
A total of 1,479 construction employees are estimated annually.
Source: Developer's application (final template).
2. Estimated on-going operating payroll is estimated at 46,656,000$ per year at full
operation. This includes salaries only, no benefit costs are included.
A total of 1,520 employees are estimated annually.
Source: Developer's application (final template).
3. Personal income tax revenue for the State is estimated as follows, using a 2007 schedule:
For a single person:
Taxable income between $0 and $15,000 is taxed at 3.5%
Taxable income between $15,000 and $30,000 is taxed at 6.25% plus the tax calculated on the first $15,000
Taxable income over $30,000 is taxed at 6.45% plus the tax calculated on the first $30,000
Source: Kansas Department of Revenue. 2007 Kansas Individual Income Tax schedule.
APPENDIX 5
STATE INCOME TAX REVENUE
9. STATE OF SUMNER SEDGWICK CITY OF WELLINGTON
YEAR KANSAS COUNTY COUNTY WELLINGTON SCHOOL DIST.
Year 1 Property Tax 43,748$ 1,646,075$ -$ 1,450,082$ 1,750,371$
Sales Tax 1,571,116 296,437 - 370,546 -
Gaming Revenue - - - - -
Income Tax Revenue 3,024,378 - - - -
Subtotal 4,639,242 1,942,512 - 1,820,628 1,750,371
Year 2 Property Tax 112,589 4,236,267 - 3,731,869 4,504,679
Sales Tax 6,401,732 1,207,874 - 1,509,842 -
Gaming Revenue - - - - -
Income Tax Revenue 3,024,378 - - - -
Subtotal 9,538,699 5,444,141 - 5,241,712 4,504,679
Year 3 Property Tax 115,275 4,337,323 - 3,820,893 4,612,138
Sales Tax 2,237,656 422,199 - 527,749 -
Gaming Revenue 31,810,920 1,325,455 1,325,455 1,325,455 -
Income Tax Revenue 2,291,112 - - - -
Subtotal 36,454,962 6,084,977 1,325,455 5,674,096 4,612,138
TOTAL 50,632,903$ 13,471,630$ 1,325,455$ 12,736,437$ 10,867,187$
APPENDIX 6, ASSUMPTIONS:
1. State of Kansas revenue includes 2% gaming contribution revenue for problem gambling fund.
APPENDIX 6
SUMMARY OF ESTIMATED REVENUE
10. ANNUAL TOTAL
ROAD MILES MAINTENANCE MAINTENANCE
YEAR ADDED COST/MILE COST
Year 1 0.0 10,671$ -$
Year 2 0.5 10,991 5,495
Year 3 0.0 11,321 5,660
TOTAL 0.5 32,982$ 11,156$
APPENDIX 7, ASSUMPTIONS:
1. A total of 0.5 mile of Seneca Street will be annexed to the City for
maintenance. Source: "Public Works-Streets" Questionnaire provided by Gus Collins, City.
Manager, Wellington, Kansas
2. Maintenance cost per mile is estimated at 10,671$ inflated 3% annually.
Source: "Public Works-Streets" Questionnaire provided by Gus Collins, City Manager, Wellington,
Kansas.
APPENDIX 7
CITY OF WELLINGTON
STREETS DEPARTMENT COST PROJECTIONS
11. # OF NEW SALARIES & SERVICES/ CAPITAL TOTAL
YEAR EMPLOYEES BENEFITS SUPPLIES EQUIPMENT COST
Year 1 0 -$ -$ -$ -$
Year 2 0 - - 209,528 209,528
Year 3 2 87,566 41,549 - 129,114
TOTAL 2 87,566$ 41,549$ 209,528$ 338,642$
APPENDIX 8, ASSUMPTIONS:
1. A total of 2 new Wastewater Operators will be required to service the development.
Source: "Wastewater Treatment" Questionnaire provided by Gus Collins, City Manager, Wellington, Kansas.
2. Salary for new positions is estimated at 13.60$ per hour, based on the average of salary levels for this position.
Salary is inflated 6% annually, 2% COLA and 4% merit increase.
Source: "Wastewater Treatment" Questionnaire provided by Gus Collins, City Manager, Wellington, Kansas.
3. Benefits are estimated at 30% of salary costs.
Source: "Wastewater Treatment" Questionnaire provided by Gus Collins, City Manager, Wellington, Kansas.
4. Employee costs include a uniform allowance at 5.50$ per employee per week and training/testing
costs of 500$ per employee per year. These costs are not added as they are estimated to be included under
Services/Supplies above. Source: "Wastewater Treatment" Questionnaire provided by Gus Collins, City Manager, Wellington, Kansas.
5. Services/supplies are estimated at 47% of salaries and benefits.
2006 2007 2008 Average
Personnel Services 188,040$ 191,737$ 191,649$ 190,475$
Contractual 34,183 36,000 36,000 35,394
Commodities 54,652 55,150 55,150 54,984
% of PS 47% 48% 48% 47%
Source: City of Wellington Budget. Three year average contractual and commodities costs as percent of personnel services costs (2006-2008)
for the Sewage Treatment department.
6. The following capital costs are expected to be incurred in 2008, inflated 3% annually:
Pickup truck 27,500$
Cleaning/vacuum truck 150,000
Bobcat equipment 20,000
197,500$
Source: "Wastewater Treatment" Questionnaire provided by Gus Collins, City Manager, Wellington, Kansas.
APPENDIX 8
CITY OF WELLINGTON
WASTEWATER TREATMENT DEPARTMENT COST PROJECTIONS
12. # OF NEW SALARIES & SERVICES/ CAPITAL CONSTR./ TOTAL
YEAR EMPLOYEES BENEFITS SUPPLIES EQUIPMENT COST
Year 1 0 -$ -$ -$ -$
Year 2 0 - - 1,485,260 1,485,260
Year 3 7 432,629 52,874 109,819 595,322
TOTAL 7 432,629$ 52,874$ 1,595,079$ 2,080,582$
APPENDIX 9, ASSUMPTIONS:
1. A total of 7 new employees will be required to service the development:
# of Employees Salary/Benefits Total Cost
Officers 5 57,773$ 288,865$
Detective 1 57,773 57,773
Records Clerk 1 37,968 37,968
Total 7 384,606$
Salary and benefits costs are increased 4% annually.
Source: "Police" Questionnaire provided by Gus Collins, City Manager, Wellington, Kansas.
2. Employee costs include a uniform allowance at 3,000$ per officer. This cost is not added as it is
estimated to be included under Services/Supplies above.
Source: "Police" Questionnaire provided by Gus Collins, City Manager, Wellington, Kansas.
3. Services/supplies are estimated at 12% of salaries and benefits.
2006 2007 2008 Average
Personnel Services 1,113,342$ 1,126,621$ 1,119,986$ 1,119,983$
Contractual 79,164 78,660 81,722 79,849
Commodities 50,628 61,085 59,375 57,029
% of PS 12% 12% 13% 12%
Source: City of Wellington Budget. Three-year average contractual and commodities costs as percent of personnel services costs (2006-2008)
for the Police department.
4. The following capital costs are expected to be incurred:
A total of 3 police vehicles at a cost of 33,500$ per vehicle.
A substation will be constructed to add approximately 2,000 square feet of space.
Source: "Police" Questionnaire provided by Gus Collins, City Manager, Wellington, Kansas.
Construction cost is estimated at 150$ per square foot. Source: Previous FI analyses conducted by MBA.
Furniture, fixtures and equipment (FF&E) costs are estimated at 1,100,000$ Source: "Fire/EMS" Questionnaire provided
by Gus Collins, City Manager, Wellington, Kansas. The new police substation is expected to share the space with the fire station.
Construction and FF&E costs are inflated 3% annually.
APPENDIX 9
CITY OF WELLINGTON
POLICE DEPARTMENT COST PROJECTIONS
13. # OF NEW SALARIES & SERVICES/ CAPITAL TOTAL
YEAR EMPLOYEES BENEFITS SUPPLIES EQUIPMENT COST
Year 1 0 -$ -$ -$ -$
Year 2 0 - - 1,469,347 1,469,347
Year 3 16 915,938 117,634 - 1,033,572
TOTAL 16 915,938$ 117,634$ 1,469,347$ 2,502,918$
APPENDIX 10, ASSUMPTIONS:
1. A total of 16 new employees will be required to service the development:
# of Employees Salary Benefits Total Cost
Captain 3 40,945$ 14,065$ 165,029$
Lieutenant 6 38,553 13,243 310,772
Firefighter/EMICT 3 35,890 12,328 144,655
Firefighter/EMS 3 35,235 12,103 142,015
Fire Prevention Officer 1 38,553 13,243 51,795
Total 16 814,265$
Salary and benefits costs are increased 4% annually. Benefits are estimated at 34% of salary.
Salary amounts are averages for each positions' salary range.
Source: "Fire/EMS" Questionnaire provided by Gus Collins, City Manager, Wellington, Kansas.
2. Employee costs include a uniform and training cost of 12,000$ a year. This cost is not added as it is
estimated to be included under Services/Supplies above.
Source: "Fire/EMS" Questionnaire provided by Gus Collins, City Manager, Wellington, Kansas.
3. Services/supplies are estimated at 13% of salaries and benefits.
2006 2007 2008 Average
Personnel Services 1,279,805$ 1,296,456$ 1,326,777$ 1,301,013$
Contractual 81,533 81,873 93,846 85,751
Commodities 75,267 83,250 85,500 81,339
% of PS 12% 13% 14% 13%
Source: City of Wellington Budget. Three year average contractual and commodities costs as percent of personnel services costs (2006-2008)
for the Fire & Ambulance department.
4. The following capital costs are expected to be incurred:
Aerial Platform 1,000,000$
Ambulance 200,000
Rescue Truck 185,000
1,385,000$ inflated 3% annually.
Source: "Fire/EMS" Questionnaire provided by Gus Collins, City Manager, Wellington, Kansas.
A new fire station will be required and will share space with the new police substation. Costs are shown for Police Department, Appendix 9.
APPENDIX 10
CITY OF WELLINGTON
FIRE DEPARTMENT COST PROJECTIONS
14. TOTAL COST OF % ATTRIBUTED TOTAL
YEAR IMPROVEMENTS TO DEVELOPMENT DEVELOPMENT COST
Year 1 -$ 0% -$
Year 2 6,030,000 41% 2,500,000
Year 3 - 0% -
TOTAL 6,030,000$ 2,500,000$
APPENDIX 11, ASSUMPTIONS:
1. The following Electric Distribution department improvements are required:
Short-Term Improvements
69 kV switching station 825,000$
Construction of 5.5 miles of 69 kV lines 660,000
69-13.2 substation with 3-13.2 kV bays 600,000
20/25 MVA 69-13.2 kV transformer 1,200,000
Construction of 3-13.2 kV feeders 165,000
Padmount transformers and underground feeder 300,000
Long Term Improvements
69-13.2 substation at turbine site 520,000
20/25 69-13.2 kV transformer 1,200,000
13.2 kV tie to gas turbine substation 25,000
Tie from 69 kV switchyard to gas turbine switchyard 35,000
Complete 69 kV loop between substations 500,000
Total Cost 6,030,000$
Source: "Electric Distribution" Questionnaire provided by Gus Collins, City Manager, Wellington,
Kansas.
2. Approximately 2,500,000$ of all improvements or 41%
will be attributed to the casino development. Source: Conversations with Gus Collins, City Manager,
Wellington, Kansas.
APPENDIX 11
CITY OF WELLINGTON
ELECTRIC DISTRIBUTION DEPARTMENT COST PROJECTIONS
15. ESTIMATED # OF NEW SALARIES & SERVICES/ REQUIRED
YEAR REVENUE EMPLOYEES BENEFITS SUPPLIES CONTRIBUTION
Year 1 -$ 0 -$ -$ -$
Year 2 - 0 - - -
Year 3 572,886 27 671,674 423,029 521,817
TOTAL 572,886$ 671,674$ 423,029$ 521,817$
APPENDIX 12, ASSUMPTIONS:
1. Revenue generated by the golf course renovation is estimated at 540,000$ a year.
Source: Letter dated May 16, 2008 from the Wellington Golf Club addressed to Gus Collins, City Manager, Wellington, Kansas.
Revenue inflated 3% annually starting in Year 1.
2. A total of 27 new employees will be required to service the development:
# of Employees Ave. Salary/Benefits Total Cost
Assistant Golf Pro 3 35,000$ 105,000$
Golf Course Mechanic 1 35,000 35,000
Assistant Course Superintendent 1 35,000 35,000
Golf Course Laborers 6 35,000 210,000
Grill Staff 4 35,000 140,000
Part Time Staff 12 8,000 96,000
Total 27 621,000$
Average full time employee salary and benefits estimated at 35,000$ and for part time employees at
8,000$ a year, inflated 4% annually.
Source: Letter dated May 16, 2008 from the Wellington Golf Club addressed to Gus Collins, City Manager, Wellington, Kansas.
3. Services/supplies are estimated at 63% of salaries and benefits.
2006 2007 2008 Average
Personnel Services 188,443$ 206,621$ 216,447$ 203,837$
Contractual 50,205 55,425 55,875 53,835
Commodities 72,233 72,900 78,500 74,544
% of PS 65% 62% 62% 63%
Source: City of Wellington Budget. Three-year average contractual and commodities costs as percent of personnel services costs (2006-2008)
for the Golf Fund.
APPENDIX 12
CITY OF WELLINGTON
GOLF CLUB REVENUE AND COST PROJECTIONS
16. STREETS WASTEWATER POLICE FIRE/EMS ELECTRIC GOLF ADMIN. TOTAL
YEAR DEPARTMENT DEPARTMENT DEPARTMENT DEPARTMENT DISTRIBUTION CLUB OVERHEAD COSTS
Year 1 -$ -$ -$ -$ -$ -$ -$ -$
Year 2 5,495 209,528 1,485,260 1,469,347 2,500,000 - 1,167,933 6,837,563
Year 3 5,660 129,114 595,322 1,033,572 - 521,817 470,806 2,756,291
TOTAL 11,156$ 338,642$ 2,080,582$ 2,502,918$ 2,500,000$ 521,817$ 1,638,739$ 9,593,854$
APPENDIX 13, ASSUMPTIONS:
1. See Appendices 7-12 for detailed calculations of all department costs.
2. Administrative overheard costs estimated at 21% of all department costs estimated in this analysis.
Source: City of Wellington Budget. Three-year average indirect costs as percent of direct costs (2006-2008) for the General Fund.
Direct 2006 2007 2008 Average
Police 1,254,091 1,273,666 1,317,991 1,281,916
Fire/Ambulance 1,443,305 1,469,579 1,506,123 1,473,002
Auditorium 39,030 31,700 30,500 33,743
Park 212,473 240,515 243,470 232,153
Swimming Pool 40,927 26,425 44,100 37,151
Street 717,887 828,742 886,689 811,106
Cemetery 77,933 97,264 105,958 93,718
Engineering 304,034 320,833 335,425 320,097
Legal 124,565 129,395 131,522 128,494
Lake 120,439 145,024 144,237 136,567
Total 4,334,684 4,563,143 4,746,015 4,547,947
Indirect 2006 2007 2008 Average
Mayor/Council 14,709 21,221 21,521 19,150
City Manager 110,341 137,345 183,057 143,581
City Clerk 278,651 294,493 318,137 297,094
Utility Collections 247,651 280,901 284,417 270,990
Public Works 84,277 88,296 98,176 90,250
General Services 69,527 79,005 71,216 73,249
Janitorial 43,487 44,577 39,601 42,555
Total 848,643 945,838 1,016,125 936,869
% Indirect of Direct 20% 21% 21% 21%
APPENDIX 13
CITY OF WELLINGTON
SUMMARY OF ESTIMATED COSTS
17. # OF NEW SALARIES & SERVICES/ CAPITAL CONSTR./ TOTAL
YEAR EMPLOYEES BENEFITS SUPPLIES EQUIPMENT COST
Year 1 0 -$ -$ -$ -$
Year 2 0 - - - -
Year 3 9 577,055 367,007 64,897 1,008,959
TOTAL 9 577,055$ 367,007$ 64,897$ 1,008,959$
APPENDIX 14, ASSUMPTIONS:
1. A total of 9 new employees will be required to service the development:
# of Employees Total Cost*
Patrol Officers 3 217,500$
Detective 1 73,000
Detention Officers 5 222,500
Total 9 513,000$
*Total Cost includes salary and benefits. Salary and benefits costs are increased 4% annually.
Source: Gerald Gilkey, Sumner County Sheriff.
3. Services/supplies and capital outlay are estimated as follows:
2006 2005 Average
Personnel Services 939,491$ 863,355$ 901,423$
Contractual (CC) 126,985 96,645 111,815
Commodities (CC)* 477,795 445,184 461,490
Capital Outlay (CO) 108,784 93,967 101,376
CC % of PS 64% 63% 64%
CO % of PS 12% 11% 11%
*Includes other jail expenses, juvenile detention, reimbursements and prisoner board costs.
Source: "Sumner County, Kansas Annual Financial Report" December 31, 2006. Two-year average (2005-2006) for the Sheriff's Department.
APPENDIX 14
SUMNER COUNTY
SHERIFF DEPARTMENT COST PROJECTIONS
18. SALARIES/ SERVICES/ CAPITAL ESTIMATED
BENEFITS SUPPLIES CONSTRUCTION TOTAL
YEAR COSTS COSTS COSTS COSTS
Year 1 -$ -$ -$ -$
Year 2 - - 5,000,000 5,000,000
Year 3 1,316,798 263,360 - 1,580,158
TOTAL 1,316,798$ 263,360$ 5,000,000$ 6,580,158$
APPENDIX 15, ASSUMPTIONS:
1. A new elementary school could possibly be required with the following positions and salaries
due to the casino/hotel development.
Position # of Employees Salary Costs Benefits Costs Total Costs
Teachers 20 40,000$ 10,000$ 1,000,000$
Para-profess. 5 10,000 - 50,000
School Admin. 1 70,000 17,500 87,500
26 1,137,500$
Source: Rick Weiss, Superintendent, Wellington School District.
Benefits estimated at 30% of salary. Source: Previous fiscal impact studies conducted by MBA.
No benefits estimated for paraprofessional employees as they are assumed to be part-time employees.
Salaries are inflated 5% annually.
Source: Rick Weiss, Superintendent, Wellington School District.
2. School services and supplies are estimated at 20% of salary/benefits
costs. Source: Previous fiscal impact studies conducted by MBA.
3. A new school will be required to absorb the increased student population. Costs are estimated at
5,000,000$ and will include construction and furniture, fixtures and equipment (FF&E) costs.
Source: Rick Weiss, Superintendent, Wellington School District.
APPENDIX 15
WELLINGTON SCHOOL DISTRICT
ESTIMATED COSTS
19. ANN'L REVENUE CUMUL.
PROJECT PROJECT SURPLUS/ SURPLUS/
YEAR REVENUE COSTS (DEFICIT) (DEFICIT)
Year 1 1,820,628$ -$ 1,820,628$ 1,820,628$
Year 2 5,241,712 6,837,563 (1,595,851) 224,777
Year 3 5,674,096 2,756,291 2,917,805 3,142,583
TOTAL 12,736,437$ 9,593,854$ 3,142,583$
ANN'L REVENUE CUMUL.
PROJECT PROJECT SURPLUS/ SURPLUS/
YEAR REVENUE COSTS* (DEFICIT) (DEFICIT)
Year 1 1,942,512$ -$ 1,942,512$ 1,942,512$
Year 2 5,444,141 - 5,444,141 7,386,653
Year 3 6,084,977 1,008,959 5,076,018 12,462,671
TOTAL 13,471,630$ 1,008,959$ 12,462,671$
*Only Sheriff department costs were estimated to compare to developer estimates; other impacts may include
county roads, judicial, and other departments providing services to the development.
ANN'L REVENUE CUMUL.
PROJECT PROJECT SURPLUS/ SURPLUS/
YEAR REVENUE COSTS (DEFICIT) (DEFICIT)
Year 1 1,750,371$ -$ 1,750,371$ 1,750,371$
Year 2 4,504,679 5,000,000 (495,321) 1,255,050
Year 3 4,612,138 1,580,158 3,031,979 4,287,029
TOTAL 10,867,187$ 6,580,158$ 4,287,029$
ANN'L REVENUE CUMUL.
PROJECT PROJECT SURPLUS/ SURPLUS/
YEAR REVENUE COSTS* (DEFICIT) (DEFICIT)
Year 1 4,639,242$ -$ 4,639,242$ 4,639,242$
Year 2 9,538,699 - 9,538,699 14,177,941
Year 3 36,454,962 - 36,454,962 50,632,903
TOTAL 50,632,903$ -$ 50,632,903$
*No costs associated with this development are estimated for the State of Kansas on the assumption that all
gaming facility-related costs will be covered by revenue generated by the development. However, it is expected that
costs will be incurred by the Highway Patrol, Department of Transportation (highway maintenance), Department of
Racing and Gaming, and the Kansas Lottery among others.
STATE OF KANSAS
WELLINGTON SCHOOL DISTRICT
APPENDIX 16
COMPARISON OF ESTIMATED REVENUE TO
ESTIMATED COSTS AND CUMULATIVE REVENUE SURPLUS
SUMNER COUNTY
CITY OF WELLINGTON