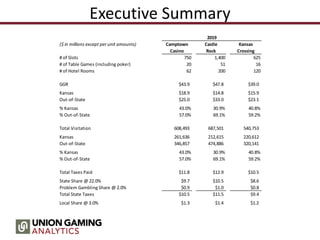
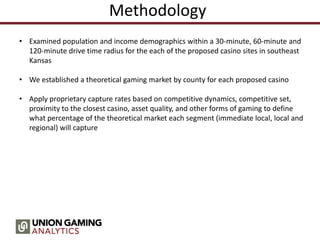
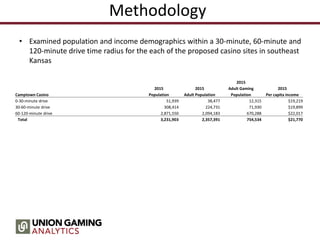
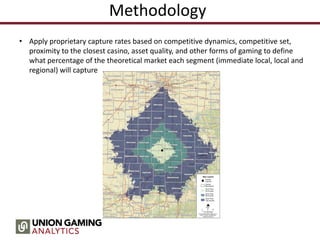
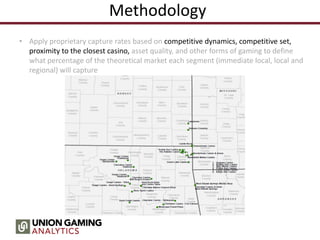
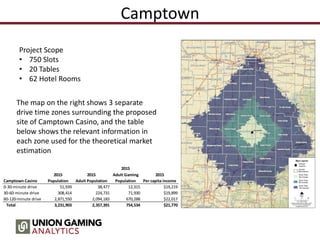
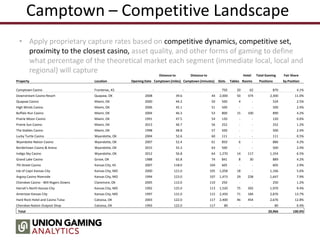
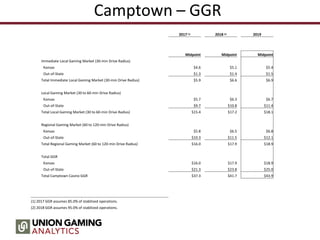
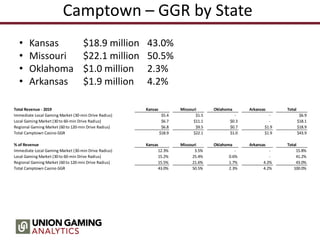
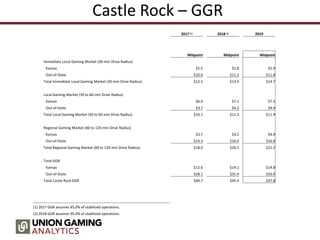
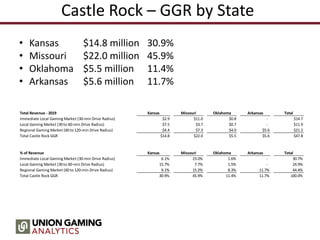
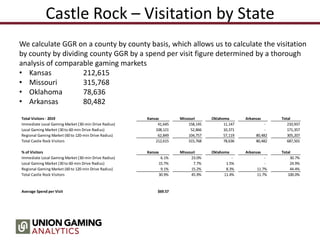
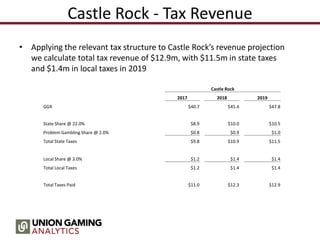
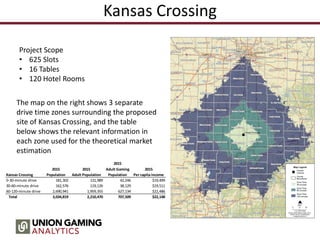
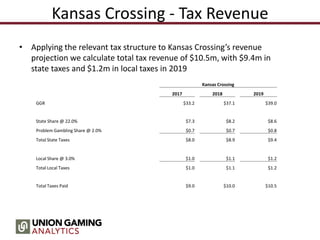
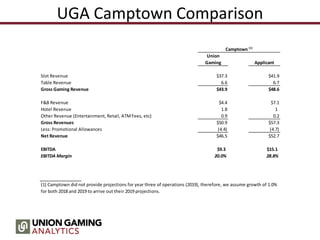
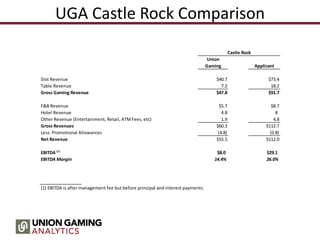
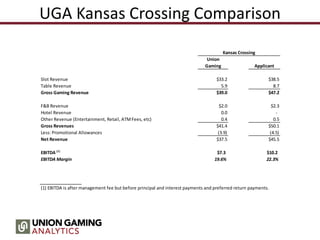
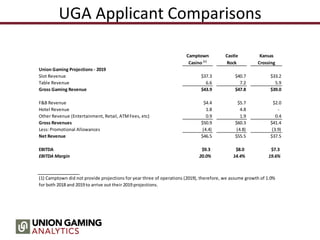
SlideShare a Scribd company logo
Union Gaming Analytics
Gaming Market Study
Presentation to the Kansas Lottery Gaming
Facility Review Board
June 10, 2015
Team
• Union Gaming Analytics, LLC
• Michael Greene, Rich Baldwin, and Bill Lerner
• Casinonomics Consulting, LLC
• Doug Walker
• Civic Economics
• Matt Cunningham and Dan Houston
• Cummings Associates
• Will Cummings
• Ekay Economic Consultants
• Eugenia Larmore
• Macomber International Inc.
• Dean Macomber
Agenda
• Methodology and Projections
• Union Gaming Analytics
• Cummings Associates
• Fiscal Impacts on Municipalities and the State of Kansas
• Ekay Economic Consultants
• Amenities and Fit
• Macomber International
• Economic Impacts
• Civic Economics
• Reinforcement of Economic Impacts and Competition
• Casinonomics
• Financial Suitability
• Union Gaming Analytics
• Questions
• All Consultants
Union Gaming is a portfolio of companies focused exclusively on the global gaming
industry. The companies specialize in institutional equity research, securities dealing,
investment banking, and gaming-related market and economic analyses. Through its
Union Gaming Analytics subsidiary, the company conducts gaming, feasibility, and
economic impact studies for both corporate and government entities. The
company also provides legislative and regulatory support for gaming related
activities globally. Union Gaming Advisors is an SEC registered and FINRA member
firm that focuses on capital raising, mergers and acquisitions, securities dealing, and
strategic advisory. Union Gaming Securities Asia Limited is a licensed corporation with
the Securities and Futures Commission (SFC) in Hong Kong. Founded in 2009, the
company is headquartered in Las Vegas, with offices in Hong Kong, Macau, and New
York, NY.
4
Best-in-class Team with Extensive Gaming Industry Experience
Rich Baldwin:
Managing
Director,
Head of Union
Gaming Analytics
Baldwin has over 20 years of corporate finance, capital markets, investor relations and general
management experience spanning the global gaming industry. Baldwin has held several executive level
positions, including Chief Financial Officer at Tropicana Entertainment, Executive Vice President &
Chief Financial Officer at Shuffle Master Gaming (NASDAQ: “SHFL”) and Director of Corporate Finance
& Investor Relations at International Game Technology (NYSE: “IGT”). Baldwin started his career on
the client service side with Deloitte & Touche LLP, at which time he received his CPA license in the
state of Nevada. Baldwin graduated from the University of Nevada, Las Vegas and also earned his MBA
from The Paul Merage School of Business at The University of California, Irvine.
Michael Greene
Vice President,
Analytics,
Las Vegas
Greene has over 14 years of corporate finance, investment banking, investor relations, and private
equity experience in the gaming and lodging industries. Greene joined Union Gaming Analytics in
March 2014 as a Director. Prior to joining the firm, Greene managed the investor relations
department at International Game Technology (NYSE: “IGT”). Prior to IGT, he was a Vice President
with a private equity firm focused on the lodging industry and worked in corporate finance at Pinnacle
Entertainment, Inc. (NYSE: “PNK”). Greene began his career as an investment banker at Bear, Stearns
& Co. Inc. in their real estate, gaming, lodging and leisure department. Greene received a B.B.A. from
The University of Michigan.
Bill Lerner
Senior Partner,
Head of
Investment
Banking,
Las Vegas
Lerner has spent 19 years on Wall Street in sell side research. Most recently he acted as Managing
Director and Senior Gaming & Lodging analyst at Deutsche Bank Securities. This followed ten years at
Prudential Securities and Deutsche Morgan Grenfell. Lerner has been recognized by Institutional
Investor as part of its "All American Research Team" and Wall Street Journal's "Best of the Street.”
Introduction
• Union Gaming has been engaged by the Kansas Racing and Gaming
Commission and the Lottery Gaming Facility Review Board to provide
consulting services in their selection of a facility manager for the southeast
gaming zone of Kansas
• Based on Union Gaming’s comprehensive and thorough analysis of the three
applicants, we determined the following for each applicant:
• Gross Gaming Revenue (“GGR”)
• In-state versus out-of-state GGR
• In-state versus out-of-state visitation
• Tax Revenue – state and local share
• EBITDA & EBITDA Margin
Executive Summary
2019
($ in millions except per unit amounts) Camptown Castle Kansas
Casino Rock Crossing
# of Slots 750 1,400 625
# of Table Games (including poker) 20 51 16
# of Hotel Rooms 62 200 120
GGR $43.9 $47.8 $39.0
Kansas $18.9 $14.8 $15.9
Out-of-State $25.0 $33.0 $23.1
% Kansas 43.0% 30.9% 40.8%
% Out-of-State 57.0% 69.1% 59.2%
Total Visitation 608,493 687,501 540,753
Kansas 261,636 212,615 220,612
Out-of-State 346,857 474,886 320,141
% Kansas 43.0% 30.9% 40.8%
% Out-of-State 57.0% 69.1% 59.2%
Total Taxes Paid $11.8 $12.9 $10.5
State Share @ 22.0% $9.7 $10.5 $8.6
Problem Gambling Share @ 2.0% $0.9 $1.0 $0.8
Total State Taxes $10.5 $11.5 $9.4
Local Share @ 3.0% $1.3 $1.4 $1.2
Methodology
• Examined population and income demographics within a 30-minute, 60-minute and
120-minute drive time radius for the each of the proposed casino sites in southeast
Kansas
• We established a theoretical gaming market by county for each proposed casino
• Apply proprietary capture rates based on competitive dynamics, competitive set,
proximity to the closest casino, asset quality, and other forms of gaming to define
what percentage of the theoretical market each segment (immediate local, local and
regional) will capture
Methodology
• Examined population and income demographics within a 30-minute, 60-minute and
120-minute drive time radius for the each of the proposed casino sites in southeast
Kansas
2015
2015 2015 Adult Gaming 2015
Camptown Casino Population Adult Population Population Per capita income
0-30-minute drive 51,939 38,477 12,315 $19,219
30-60-minute drive 308,414 224,731 71,930 $19,899
60-120-minute drive 2,871,550 2,094,183 670,288 $22,017
Total 3,231,903 2,357,391 754,534 $21,770
Methodology
• We established a theoretical gaming market by county for each proposed casino
% of Theo
Distance to Drive Time Adult Per Capita Avg Median Per Capita Gaming Market
Castle Rock Castle Rock Population Adult Gaming Income Household Household Income per County
County State (miles) (minutes) (2015) Population Population (2015) Income Income Spent on Gaming ($ in millions)
Cherokee County Kansas - - 21,327 15,802 5,058 $19,332 $48,223 $38,182 3.5% $3.4
Jasper County Missouri 21.2 21 120,292 86,677 27,743 $19,848 $50,687 $39,343 3.5% $19.3
OttawaCounty Oklahoma 19.8 21 32,314 23,633 7,564 $18,452 $47,284 $36,958 3.5% $4.9
Newton County Missouri 20.5 22 60,133 44,114 14,120 $21,109 $55,336 $40,738 3.5% $10.4
Crawford County Kansas 35.8 40 39,683 29,510 9,445 $19,316 $47,552 $36,997 3.5% $6.4
McDonaldCounty Missouri 45.6 44 24,018 17,086 5,469 $16,489 $45,318 $36,203 3.5% $3.2
Barton County Missouri 49.9 47 12,256 8,967 2,870 $19,121 $47,854 $39,053 3.5% $1.9
Craig County Oklahoma 46.9 47 15,076 11,533 3,691 $19,632 $50,610 $38,315 3.5% $2.5
Lawrence County Missouri 53.8 51 39,357 28,576 9,146 $18,823 $48,659 $38,810 3.5% $6.0
LabetteCounty Kansas 49.6 54 21,382 15,896 5,088 $20,032 $48,735 $40,026 3.5% $3.6
Delaware County Oklahoma 53.9 58 42,890 33,002 10,563 $21,734 $52,225 $37,473 3.5% $8.0
Vernon County Missouri 75.4 69 21,328 15,588 4,989 $18,510 $45,456 $35,325 3.5% $3.2
Benton County Arkansas 69.5 72 240,162 168,638 53,976 $27,037 $73,014 $54,828 3.5% $51.1
Bourbon County Kansas 66.2 73 15,163 10,928 3,498 $19,843 $50,049 $38,113 3.5% $2.4
Dade County Missouri 70.6 73 7,897 6,060 1,940 $17,933 $42,680 $31,974 3.5% $1.2
Mayes County Oklahoma 74.3 73 41,798 30,649 9,810 $20,362 $52,158 $42,168 3.5% $7.0
Barry County Missouri 65.5 74 36,445 27,305 8,740 $18,946 $47,797 $36,783 3.5% $5.8
GreeneCounty Missouri 79.1 75 281,998 214,110 68,531 $23,578 $55,474 $38,801 3.5% $56.6
Nowata County Oklahoma 72.7 76 10,516 7,930 2,538 $18,639 $46,265 $36,407 3.5% $1.7
Rogers County Oklahoma 81.1 77 90,177 65,973 21,116 $27,348 $73,670 $58,525 3.5% $20.2
MontgomeryCounty Kansas 69.9 79 35,004 25,831 8,268 $19,829 $48,512 $37,945 3.5% $5.7
Washington County Arkansas 89.7 87 215,294 153,485 49,126 $21,534 $56,272 $40,821 3.5% $37.0
ChristianCounty Missouri 93.4 87 81,418 58,013 18,568 $24,173 $64,128 $52,045 3.5% $15.7
Neosho County Kansas 83.5 89 16,475 12,093 3,871 $22,067 $54,391 $41,510 3.5% $3.0
Tulsa County Oklahoma 101.3 91 625,723 453,719 145,223 $27,928 $69,262 $48,772 3.5% $142.0
Washington County Oklahoma 89.5 93 52,078 39,089 12,511 $27,620 $66,579 $49,847 3.5% $12.1
Polk County Missouri 104.3 96 31,030 22,655 7,251 $18,160 $47,007 $36,553 3.5% $4.6
Wilson County Kansas 96.3 97 9,382 7,071 2,263 $19,432 $46,209 $35,889 3.5% $1.5
Bates County Missouri 106.3 99 16,837 12,523 4,008 $19,307 $48,171 $36,561 3.5% $2.7
Cedar County Missouri 92.0 99 14,003 10,562 3,381 $16,757 $39,904 $31,738 3.5% $2.0
Wagoner County Oklahoma 107.4 103 75,979 54,947 17,587 $26,033 $70,395 $55,686 3.5% $16.0
Chautauqua County Kansas 97.0 103 3,577 2,824 904 $24,281 $54,492 $37,733 3.5% $0.8
Linn County Kansas 97.0 104 9,774 7,448 2,384 $22,692 $53,990 $47,785 3.5% $1.9
Webster County Missouri 110.2 104 36,783 26,190 8,383 $18,814 $51,339 $41,449 3.5% $5.5
Dallas County Missouri 115.4 107 16,595 12,349 3,953 $18,260 $46,493 $37,598 3.5% $2.5
Allen County Kansas 103.4 109 13,388 9,932 3,179 $20,749 $49,970 $40,068 3.5% $2.3
Creek County Oklahoma 123.4 113 71,260 52,933 16,942 $21,818 $56,688 $43,115 3.5% $12.9
Cherokee County Oklahoma 115.4 115 48,835 35,713 11,431 $18,364 $47,638 $35,855 3.5% $7.3
Muskogee County Oklahoma 115.5 115 71,290 52,408 16,774 $20,450 $52,791 $38,922 3.5% $12.0
Stone County Missouri 103.4 115 32,110 25,946 8,305 $21,728 $50,776 $39,225 3.5% $6.3
LacledeCounty Missouri 130.4 117 36,016 26,466 8,471 $18,974 $47,665 $37,548 3.5% $5.6
Taney County Missouri 121.3 117 55,000 41,780 13,373 $19,171 $47,374 $37,142 3.5% $9.0
St. Clair County Missouri 118.1 119 9,871 7,797 2,496 $17,536 $40,670 $30,319 3.5% $1.5
CarrollCounty Arkansas 102.3 120 27,721 21,164 6,774 $20,138 $48,144 $35,842 3.5% $4.8
2,779,655 2,034,915 651,318 $533.7
Methodology
• Apply proprietary capture rates based on competitive dynamics, competitive set,
proximity to the closest casino, asset quality, and other forms of gaming to define
what percentage of the theoretical market each segment (immediate local, local and
regional) will capture
Methodology
• Apply proprietary capture rates based on competitive dynamics, competitive set,
proximity to the closest casino, asset quality, and other forms of gaming to define
what percentage of the theoretical market each segment (immediate local, local and
regional) will capture
Camptown
2015
2015 2015 Adult Gaming 2015
Camptown Casino Population Adult Population Population Per capita income
0-30-minute drive 51,939 38,477 12,315 $19,219
30-60-minute drive 308,414 224,731 71,930 $19,899
60-120-minute drive 2,871,550 2,094,183 670,288 $22,017
Total 3,231,903 2,357,391 754,534 $21,770
Project Scope
• 750 Slots
• 20 Tables
• 62 Hotel Rooms
The map on the right shows 3 separate
drive time zones surrounding the proposed
site of Camptown Casino, and the table
below shows the relevant information in
each zone used for the theoretical market
estimation
Camptown – Competitive Landscape
• Apply proprietary capture rates based on competitive dynamics, competitive set,
proximity to the closest casino, asset quality, and other forms of gaming to define
what percentage of the theoretical market each segment (immediate local, local and
regional) will capture Distance to Distance to Hotel Total Gaming Fair Share
Property Location Opening Date Camptown (miles) Camptown (minutes) Slots Tables Rooms Positions by Position
Camptown Casino Frontenac, KS - - 750 20 62 870 4.1%
Downstream Casino Resort Quapaw, OK 2008 39.6 44 2,000 50 374 2,300 11.0%
Quapaw Casino Miami, OK 2000 44.2 50 500 4 - 524 2.5%
High Winds Casino Miami, OK 2006 45.1 51 500 - - 500 2.4%
Buffalo Run Casino Miami, OK 2004 46.3 53 800 15 100 890 4.2%
Prairie Moon Casino Miami, OK 1991 47.5 54 120 - - 120 0.6%
Prairie Sun Casino Miami, OK 2013 46.7 56 252 - - 252 1.2%
The Stables Casino Miami, OK 1998 48.8 57 500 - - 500 2.4%
Lucky Turtle Casino Wyandotte, OK 2004 52.6 60 111 - - 111 0.5%
Wyandotte Nation Casino Wyandotte, OK 2007 52.4 61 850 6 - 886 4.2%
Bordertown Casino & Arena Wyandotte, OK 2015 55.3 63 500 - - 500 2.4%
Indigo Sky Casino Wyandotte, OK 2012 56.8 64 1,270 14 117 1,354 6.5%
Grand Lake Casino Grove, OK 1988 65.8 74 841 8 30 889 4.2%
7th Street Casino Kansas City, KS 2007 118.0 104 605 - - 605 2.9%
Isle of Capri Kansas City Kansas City, MO 2000 121.0 105 1,058 18 - 1,166 5.6%
Argosy Casino Riverside Kansas City, MO 1994 123.0 107 1,473 29 258 1,647 7.9%
Cherokee Casino - Will Rogers Downs Claremore, OK 2005 112.0 110 250 - - 250 1.2%
Harrah's North Kansas City Kansas City, MO 1992 125.0 113 1,520 75 392 1,970 9.4%
Ameristar Kansas City Kansas City, MO 1997 131.0 115 2,450 71 184 2,876 13.7%
Hard Rock Hotel and Casino Tulsa Catoosa, OK 2003 122.0 117 2,400 46 454 2,676 12.8%
Cherokee Nation Outpost Shop Catoosa, OK 1993 122.0 117 80 - - 80 0.4%
Total 20,966 100.0%
Camptown – GGR
2017 (1) 2018 (2) 2019
Midpoint Midpoint Midpoint
Immediate Local Gaming Market (30-min Drive Radius)
Kansas $4.6 $5.1 $5.4
Out-of-State $1.3 $1.4 $1.5
Total Immediate Local Gaming Market (30-min Drive Radius) $5.9 $6.6 $6.9
Local Gaming Market (30 to 60-min Drive Radius)
Kansas $5.7 $6.3 $6.7
Out-of-State $9.7 $10.8 $11.4
Total Local Gaming Market (30 to 60-min Drive Radius) $15.4 $17.2 $18.1
Regional Gaming Market (60 to 120-min Drive Radius)
Kansas $5.8 $6.5 $6.8
Out-of-State $10.3 $11.5 $12.1
Total Regional Gaming Market (60 to 120-min Drive Radius) $16.0 $17.9 $18.9
Total GGR
Kansas $16.0 $17.9 $18.9
Out-of-State $21.3 $23.8 $25.0
Total Camptown Casino GGR $37.3 $41.7 $43.9
(1) 2017 GGR assumes 85.0% of stabilized operations.
(2) 2018 GGR assumes 95.0% of stabilized operations.
Camptown – GGR by State
• Kansas $18.9 million 43.0%
• Missouri $22.1 million 50.5%
• Oklahoma $1.0 million 2.3%
• Arkansas $1.9 million 4.2%
Total Revenue - 2019 Kansas Missouri Oklahoma Arkansas Total
Immediate Local Gaming Market (30-min Drive Radius) $5.4 $1.5 - - $6.9
Local Gaming Market (30 to 60-min Drive Radius) $6.7 $11.1 $0.3 - $18.1
Regional Gaming Market (60 to 120-min Drive Radius) $6.8 $9.5 $0.7 $1.9 $18.9
Total Camptown Casino GGR $18.9 $22.1 $1.0 $1.9 $43.9
% of Revenue Kansas Missouri Oklahoma Arkansas Total
Immediate Local Gaming Market (30-min Drive Radius) 12.3% 3.5% - - 15.8%
Local Gaming Market (30 to 60-min Drive Radius) 15.2% 25.4% 0.6% - 41.2%
Regional Gaming Market (60 to 120-min Drive Radius) 15.5% 21.6% 1.7% 4.2% 43.0%
Total Camptown Casino GGR 43.0% 50.5% 2.3% 4.2% 100.0%
Camptown – Visitation by State
Total Visitors - 2019 Kansas Missouri Oklahoma Arkansas Total
Immediate Local Gaming Market (30-min Drive Radius) 74,974 21,142 - - 96,116
Local Gaming Market (30 to 60-min Drive Radius) 92,432 154,505 3,585 - 250,521
Regional Gaming Market (60 to 120-min Drive Radius) 94,230 131,403 10,362 25,861 261,855
Total Camptown Casino Visitors 261,636 307,050 13,947 25,861 608,493
% of Visitors Kansas Missouri Oklahoma Arkansas Total
Immediate Local Gaming Market (30-min Drive Radius) 12.3% 3.5% - - 15.8%
Local Gaming Market (30 to 60-min Drive Radius) 15.2% 25.4% 0.6% - 41.2%
Regional Gaming Market (60 to 120-min Drive Radius) 15.5% 21.6% 1.7% 4.2% 43.0%
Total Camptown Casino Visitors 43.0% 50.5% 2.3% 4.2% 100.0%
Average Spend per Visit $72.10
We calculate GGR on a county by county basis, which allows us to calculate the visitation
by county by dividing county GGR by a spend per visit figure determined by a thorough
analysis of comparable gaming markets
• Kansas 261,636
• Missouri 307,050
• Oklahoma 13,947
• Arkansas 25,861
Camptown - Tax Revenue
• Applying the relevant tax structure to Camptown’s revenue projection
we calculate total tax revenue of $11.8m, with $10.5m in state taxes
and $1.3m in local taxes in 2019
Camptown Casino
2017 2018 2019
GGR $37.3 $41.7 $43.9
State Share @ 22.0% $8.2 $9.2 $9.7
Problem Gambling Share @ 2.0% $0.7 $0.8 $0.9
Total State Taxes $9.0 $10.0 $10.5
Local Share @ 3.0% $1.1 $1.3 $1.3
Total Local Taxes $1.1 $1.3 $1.3
Total Taxes Paid $10.1 $11.3 $11.8
Castle Rock
2015
2015 2015 Adult Gaming 2015
Castle Rock Population Adult Population Population Per capita income
0-30-minute drive 234,066 170,226 54,484 $19,685
30-60-minute drive 194,662 144,570 46,273 $19,307
60-120-minute drive 2,350,927 1,720,119 550,561 $21,152
Total 2,779,655 2,034,915 651,318 $20,899
Project Scope
• 1,400 Slots
• 51 Tables
• 200 Hotel Rooms
The map on the right shows 3 separate
drive time zones surrounding the proposed
site of Castle Rock, and the table below
shows the relevant information in each
zone used for the theoretical market
estimation
Castle Rock – Competitive Landscape
• Apply proprietary capture rates based on competitive dynamics, competitive set,
proximity to the closest casino, asset quality, and other forms of gaming to define
what percentage of the theoretical market each segment (immediate local, local and
regional) will capture
Distance to Distance to Total Gaming Fair Share
Property Location Opening Date Castle Rock (miles) Castle Rock (minutes) Slots Tables Hotel Rooms Positions by Position
Castle Rock Galena, KS - - 1,400 51 200 1,706 7.8%
Downstream Casino Resort Quapaw, OK 2008 1.8 4 2,000 50 374 2,300 10.5%
Prairie Moon Casino Miami, OK 1991 18.5 19 120 - - 120 0.5%
Bordertown Casino & Arena Wyandotte, OK 2015 18.1 22 500 - - 500 2.3%
Quapaw Casino Miami, OK 2000 17.8 22 500 4 - 524 2.4%
Buffalo Run Casino Miami, OK 2004 20.2 22 800 15 100 890 4.1%
The Stables Casino Miami, OK 1998 19.5 22 500 - - 500 2.3%
High Winds Casino Miami, OK 2006 18.7 23 500 - - 500 2.3%
Indigo Sky Casino Wyandotte, OK 2012 19.2 24 1,270 14 117 1,354 6.2%
Prairie Sun Casino Miami, OK 2013 20.3 26 252 - - 252 1.1%
Lucky Turtle Casino Wyandotte, OK 2004 26.8 30 111 - - 111 0.5%
Wyandotte Nation Casino Wyandotte, OK 2007 26.0 32 850 6 - 886 4.0%
Grand Lake Casino Grove, OK 1988 34.9 40 841 8 - 889 4.0%
Cherokee Casino - Will Rogers Downs Claremore, OK 2005 82.0 72 250 - - 250 1.1%
Hard Rock Hotel and Casino Tulsa Catoosa, OK 2003 91.6 77 2,400 46 454 2,676 12.2%
West Siloam Springs Smoke Shop Watts, OK 2009 70.3 87 150 - - 150 0.7%
Cherokee Casino & Hotel West Siloam Springs West Siloam Springs, OK 2000 70.3 87 1,300 28 147 1,468 6.7%
Cherokee Nation Outpost Shop Catoosa, OK 1993 91.6 87 80 - - 80 0.4%
Osage Casino - Tulsa Tulsa, OK 2001 107.0 90 250 - - 250 1.1%
River Spirit Casino Tulsa, OK 2009 109.0 95 2,600 25 - 2,750 12.5%
Cherokee Casino - Ramona Ramona, OK 2010 101.0 98 500 - - 500 2.3%
Osage Casino - Sand Springs Sand Springs, Ok 2004 118.0 101 460 5 - 490 2.2%
Osage Casino - Skiatook Skiatook, OK 2011 106.0 104 315 - 28 315 1.4%
Cherokee Casino - Fort Gibson Fort Gibson, OK 2004 112.0 104 500 - - 500 2.3%
Osage Casino - Bartlesville Bartlesville, OK 2007 100.0 105 450 8 - 498 2.3%
Duck Creek Casino Beggs, OK 2003 126.0 107 299 - - 299 1.4%
Muskogee Travel Plaza Muskogee, OK 2007 111.0 108 129 - - 129 0.6%
Creek Nation Casino Muskogee Muskogee, OK 2006 111.0 108 400 16 - 496 2.3%
Cherokee Casino - Tahlequah Tahlequah, OK 2004 115.0 117 400 - - 400 1.8%
Osage Casino - Pawhuska Pawhuska, OK 2005 117.0 117 170 - - 170 0.8%
Total 21,953 100.0%
Castle Rock – GGR
2017 (1) 2018 (2) 2019
Midpoint Midpoint Midpoint
Immediate Local Gaming Market (30-min Drive Radius)
Kansas $2.5 $2.8 $2.9
Out-of-State $10.0 $11.2 $11.8
Total Immediate Local Gaming Market (30-min Drive Radius) $12.5 $13.9 $14.7
Local Gaming Market (30 to 60-min Drive Radius)
Kansas $6.4 $7.1 $7.5
Out-of-State $3.7 $4.2 $4.4
Total Local Gaming Market (30 to 60-min Drive Radius) $10.1 $11.3 $11.9
Regional Gaming Market (60 to 120-min Drive Radius)
Kansas $3.7 $4.2 $4.4
Out-of-State $14.3 $16.0 $16.9
Total Regional Gaming Market (60 to 120-min Drive Radius) $18.0 $20.2 $21.2
Total GGR
Kansas $12.6 $14.1 $14.8
Out-of-State $28.1 $31.4 $33.0
Total Castle Rock GGR $40.7 $45.4 $47.8
(1) 2017 GGR assumes 85.0% of stabilized operations.
(2) 2018 GGR assumes 95.0% of stabilized operations.
Castle Rock – GGR by State
• Kansas $14.8 million 30.9%
• Missouri $22.0 million 45.9%
• Oklahoma $5.5 million 11.4%
• Arkansas $5.6 million 11.7%
Total Revenue - 2019 Kansas Missouri Oklahoma Arkansas Total
Immediate Local Gaming Market (30-min Drive Radius) $2.9 $11.0 $0.8 - $14.7
Local Gaming Market (30 to 60-min Drive Radius) $7.5 $3.7 $0.7 - $11.9
Regional Gaming Market (60 to 120-min Drive Radius) $4.4 $7.3 $4.0 $5.6 $21.2
Total Castle Rock GGR $14.8 $22.0 $5.5 $5.6 $47.8
% of Revenue Kansas Missouri Oklahoma Arkansas Total
Immediate Local Gaming Market (30-min Drive Radius) 6.1% 23.0% 1.6% - 30.7%
Local Gaming Market (30 to 60-min Drive Radius) 15.7% 7.7% 1.5% - 24.9%
Regional Gaming Market (60 to 120-min Drive Radius) 9.1% 15.2% 8.3% 11.7% 44.4%
Total Castle Rock GGR 30.9% 45.9% 11.4% 11.7% 100.0%
Castle Rock – Visitation by State
We calculate GGR on a county by county basis, which allows us to calculate the visitation
by county by dividing county GGR by a spend per visit figure determined by a thorough
analysis of comparable gaming markets
• Kansas 212,615
• Missouri 315,768
• Oklahoma 78,636
• Arkansas 80,482
Total Visitors - 2019 Kansas Missouri Oklahoma Arkansas Total
Immediate Local Gaming Market (30-min Drive Radius) 41,645 158,145 11,147 - 210,937
Local Gaming Market (30 to 60-min Drive Radius) 108,121 52,866 10,371 - 171,357
Regional Gaming Market (60 to 120-min Drive Radius) 62,849 104,757 57,119 80,482 305,207
Total Castle Rock Visitors 212,615 315,768 78,636 80,482 687,501
% of Visitors Kansas Missouri Oklahoma Arkansas Total
Immediate Local Gaming Market (30-min Drive Radius) 6.1% 23.0% - - 30.7%
Local Gaming Market (30 to 60-min Drive Radius) 15.7% 7.7% 1.5% - 24.9%
Regional Gaming Market (60 to 120-min Drive Radius) 9.1% 15.2% 8.3% 11.7% 44.4%
Total Castle Rock Visitors 30.9% 45.9% 11.4% 11.7% 100.0%
Average Spend per Visit $69.57
Castle Rock - Tax Revenue
• Applying the relevant tax structure to Castle Rock’s revenue projection
we calculate total tax revenue of $12.9m, with $11.5m in state taxes
and $1.4m in local taxes in 2019
Castle Rock
2017 2018 2019
GGR $40.7 $45.4 $47.8
State Share @ 22.0% $8.9 $10.0 $10.5
Problem Gambling Share @ 2.0% $0.8 $0.9 $1.0
Total State Taxes $9.8 $10.9 $11.5
Local Share @ 3.0% $1.2 $1.4 $1.4
Total Local Taxes $1.2 $1.4 $1.4
Total Taxes Paid $11.0 $12.3 $12.9
Kansas Crossing
2015
2015 2015 Adult Gaming 2015
Kansas Crossing Population Adult Population Population Per capita income
0-30-minute drive 181,302 131,989 42,246 $19,499
30-60-minute drive 162,576 119,126 38,129 $19,511
60-120-minute drive 2,690,941 1,959,355 627,134 $22,486
Total 3,034,819 2,210,470 707,509 $22,148
Project Scope
• 625 Slots
• 16 Tables
• 120 Hotel Rooms
The map on the right shows 3 separate
drive time zones surrounding the proposed
site of Kansas Crossing, and the table
below shows the relevant information in
each zone used for the theoretical market
estimation
Kansas Crossing – Competitive Landscape
• Apply proprietary capture rates based on competitive dynamics, competitive set,
proximity to the closest casino, asset quality, and other forms of gaming to define
what percentage of the theoretical market each segment (immediate local, local and
regional) will capture
Distance to Distance to Total Gaming Fair Share
Property Location Opening Date KS Crossing (miles) KS Crossing (minutes) Slots Tables Hotel Rooms Positions by Position
Kansas Crossing Pittsburg, KS - - 625 16 120 721 3.8%
Downstream Casino Resort Quapaw, OK 2008 29.6 31 2,000 50 374 2,300 12.2%
Quapaw Casino Miami, OK 2000 34.2 37 500 4 - 524 2.8%
High Winds Casino Miami, OK 2006 35.1 39 500 - - 500 2.7%
Buffalo Run Casino Miami, OK 2004 36.3 41 800 15 100 890 4.7%
Prairie Moon Casino Miami, OK 1991 37.5 42 120 - - 120 0.6%
Prairie Sun Casino Miami, OK 2013 36.7 44 252 - - 252 1.3%
The Stables Casino Miami, OK 1998 38.8 45 500 - - 500 2.7%
Wyandotte Nation Casino Wyandotte, OK 2007 42.4 49 850 6 - 886 4.7%
Lucky Turtle Casino Wyandotte, OK 2004 42.6 50 111 - - 111 0.6%
Bordertown Casino & Arena Wyandotte, OK 2015 45.4 51 500 - - 500 2.7%
Indigo Sky Casino Wyandotte, OK 2012 46.8 52 1,270 14 117 1,354 7.2%
Grand Lake Casino Grove, OK 1988 55.9 62 841 8 30 889 4.7%
Cherokee Casino - Will Rogers Downs Claremore, OK 2005 102.0 98 250 - - 250 1.3%
Hard Rock Hotel and Casino Tulsa Catoosa, OK 2003 112.0 105 2,400 46 454 2,676 14.2%
Cherokee Nation Outpost Shop Catoosa, OK 1993 112.0 105 80 - - 80 0.4%
West Siloam Springs Smoke Shop Watts, OK 2009 104.0 114 150 - - 150 0.8%
Cherokee Casino & Hotel West Siloam Springs West Siloam Springs, OK 2000 104.0 114 1,300 28 147 1,468 7.8%
7th Street Casino Kansas City, KS 2007 128.0 115 605 - - 605 3.2%
Isle of Capri Kansas City Kansas City, MO 2000 131.0 117 1,058 18 - 1,166 6.2%
Osage Casino - Bartlesville Bartlesville, OK 2007 113.0 118 450 8 - 498 2.6%
Cherokee Casino - Ramona Ramona, OK 2010 118.0 118 500 - - 500 2.7%
Argosy Casino Riverside Kansas City, MO 1994 132.0 119 1,473 29 258 1,647 8.7%
Osage Casino - Tulsa Tulsa, OK 2001 127.0 119 250 - - 250 1.3%
Total 18,837 100.0%
Kansas Crossing – GGR
2017 (1) 2018 (2) 2019
Midpoint Midpoint Midpoint
Immediate Local Gaming Market (30-min Drive Radius)
Kansas $7.1 $7.9 $8.3
Out-of-State $7.8 $8.7 $9.2
Total Immediate Local Gaming Market (30-min Drive Radius) $14.9 $16.6 $17.5
Local Gaming Market (30 to 60-min Drive Radius)
Kansas $3.0 $3.4 $3.6
Out-of-State $5.9 $6.6 $7.0
Total Local Gaming Market (30 to 60-min Drive Radius) $9.0 $10.0 $10.5
Regional Gaming Market (60 to 120-min Drive Radius)
Kansas $3.4 $3.9 $4.1
Out-of-State $5.9 $6.6 $6.9
Total Regional Gaming Market (60 to 120-min Drive Radius) $9.3 $10.4 $11.0
Total GGR
Kansas $13.5 $15.1 $15.9
Out-of-State $19.6 $21.9 $23.1
Total Kansas Crossing GGR $33.2 $37.1 $39.0
(1) 2017 GGR assumes 85.0% of stabilized operations.
(2) 2018 GGR assumes 95.0% of stabilized operations.
Kansas Crossing – GGR by State
• Kansas $15.9 million 40.8%
• Missouri $19.6 million 50.3%
• Oklahoma $1.6 million 4.0%
• Arkansas $1.9 million 4.9%
Total Revenue - 2019 Kansas Missouri Oklahoma Arkansas Total
Immediate Local Gaming Market (30-min Drive Radius) $8.3 $9.2 - - $17.5
Local Gaming Market (30 to 60-min Drive Radius) $3.6 $6.7 $0.3 - $10.5
Regional Gaming Market (60 to 120-min Drive Radius) $4.1 $3.7 $1.3 $1.9 $11.0
Total Kansas Crossing GGR $15.9 $19.6 $1.6 $1.9 $39.0
% of Revenue Kansas Missouri Oklahoma Arkansas Total
Immediate Local Gaming Market (30-min Drive Radius) 21.3% 23.5% - - 44.8%
Local Gaming Market (30 to 60-min Drive Radius) 9.1% 17.2% 0.7% - 27.0%
Regional Gaming Market (60 to 120-min Drive Radius) 10.4% 9.5% 3.3% 4.9% 28.2%
Total Kansas Crossing GGR 40.8% 50.3% 4.0% 4.9% 100.0%
Kansas Crossing – Visitation by State
We calculate GGR on a county by county basis, which allows us to calculate the visitation
by county by dividing county GGR by a spend per visit figure determined by a thorough
analysis of comparable gaming markets
• Kansas 220,612
• Missouri 272,006
• Oklahoma 21,588
• Arkansas 26,548
Total Visitors - 2019 Kansas Missouri Oklahoma Arkansas Total
Immediate Local Gaming Market (30-min Drive Radius) 115,081 127,201 - - 242,283
Local Gaming Market (30 to 60-min Drive Radius) 49,319 93,197 3,583 - 146,099
Regional Gaming Market (60 to 120-min Drive Radius) 56,211 51,607 18,005 26,548 152,371
Total Kansas Crossing Visitors 220,612 272,006 21,588 26,548 540,753
% of Visitors Kansas Missouri Oklahoma Arkansas Total
Immediate Local Gaming Market (30-min Drive Radius) 21.3% 23.5% - - 44.8%
Local Gaming Market (30 to 60-min Drive Radius) 9.1% 17.2% 0.7% - 27.0%
Regional Gaming Market (60 to 120-min Drive Radius) 10.4% 9.5% 3.3% 4.9% 28.2%
Total Kansas Crossing Visitors 40.8% 50.3% 4.0% 4.9% 100.0%
Average Spend per Visit $72.15
Kansas Crossing - Tax Revenue
• Applying the relevant tax structure to Kansas Crossing’s revenue
projection we calculate total tax revenue of $10.5m, with $9.4m in
state taxes and $1.2m in local taxes in 2019
Kansas Crossing
2017 2018 2019
GGR $33.2 $37.1 $39.0
State Share @ 22.0% $7.3 $8.2 $8.6
Problem Gambling Share @ 2.0% $0.7 $0.7 $0.8
Total State Taxes $8.0 $8.9 $9.4
Local Share @ 3.0% $1.0 $1.1 $1.2
Total Local Taxes $1.0 $1.1 $1.2
Total Taxes Paid $9.0 $10.0 $10.5
UGA Camptown Comparison
Camptown (1)
Union
Gaming Applicant
Slot Revenue $37.3 $41.9
Table Revenue 6.6 6.7
Gross Gaming Revenue $43.9 $48.6
F&B Revenue $4.4 $7.1
Hotel Revenue 1.8 1
Other Revenue (Entertainment, Retail, ATMFees, etc) 0.9 0.2
Gross Revenues $50.9 $57.3
Less: Promotional Allowances (4.4) (4.7)
Net Revenue $46.5 $52.7
EBITDA $9.3 $15.1
EBITDA Margin 20.0% 28.8%
(1) Camptown did not provide projections for year three of operations (2019), therefore, we assume growth of 1.0%
for both 2018 and 2019 to arrive out their 2019 projections.
UGA Castle Rock Comparison
Castle Rock
Union
Gaming Applicant
Slot Revenue $40.7 $73.4
Table Revenue 7.2 18.2
Gross Gaming Revenue $47.8 $91.7
F&B Revenue $5.7 $8.7
Hotel Revenue 4.8 8
Other Revenue (Entertainment, Retail, ATMFees, etc) 1.9 4.8
Gross Revenues $60.3 $112.7
Less: Promotional Allowances (4.8) (0.8)
Net Revenue $55.5 $112.0
EBITDA (1)
$8.0 $29.1
EBITDA Margin 14.4% 26.0%
(1) EBITDA is after management fee but before principal and interest payments.
UGA Kansas Crossing Comparison
Kansas Crossing
Union
Gaming Applicant
Slot Revenue $33.2 $38.5
Table Revenue 5.9 8.7
Gross Gaming Revenue $39.0 $47.2
F&B Revenue $2.0 $2.3
Hotel Revenue 0.0 -
Other Revenue (Entertainment, Retail, ATMFees, etc) 0.4 0.5
Gross Revenues $41.4 $50.1
Less: Promotional Allowances (3.9) (4.5)
Net Revenue $37.5 $45.5
EBITDA (1)
$7.3 $10.2
EBITDA Margin 19.6% 22.3%
(1) EBITDA is after management fee but before principal and interest payments and preferred return payments.
UGA Applicant Comparisons
Camptown Castle Kansas
Casino (1)
Rock Crossing
Union Gaming Projections - 2019
Slot Revenue $37.3 $40.7 $33.2
Table Revenue 6.6 7.2 5.9
Gross Gaming Revenue $43.9 $47.8 $39.0
F&B Revenue $4.4 $5.7 $2.0
Hotel Revenue 1.8 4.8 -
Other Revenue (Entertainment, Retail, ATMFees, etc) 0.9 1.9 0.4
Gross Revenues $50.9 $60.3 $41.4
Less: Promotional Allowances (4.4) (4.8) (3.9)
Net Revenue $46.5 $55.5 $37.5
EBITDA $9.3 $8.0 $7.3
EBITDA Margin 20.0% 14.4% 19.6%
(1) Camptown did not provide projections for year three of operations (2019), therefore, we assume growth of 1.0%
for both 2018 and 2019 to arrive out their 2019 projections.
www.uniongaminggroup.com

More Related Content

What's hot

Kansas Star dec 1_final
Kansas Star dec 1_finalKansas Star dec 1_final
Kansas Star dec 1_final
krgc
 
Wells Gaming ppt 2010
Wells Gaming ppt 2010Wells Gaming ppt 2010
Wells Gaming ppt 2010
krgc
 
Kansas star presentation[1]
Kansas star presentation[1]Kansas star presentation[1]
Kansas star presentation[1]
krgc
 
Peninsula dec 15 final
Peninsula dec 15 finalPeninsula dec 15 final
Peninsula dec 15 final
krgc
 
Peninsula crossroads dec 1 2010 powerpoint presentation
Peninsula crossroads dec 1 2010 powerpoint presentationPeninsula crossroads dec 1 2010 powerpoint presentation
Peninsula crossroads dec 1 2010 powerpoint presentation
krgc
 
EEC presentation
EEC presentationEEC presentation
EEC presentation
krgc
 
Wgr ne presentation
Wgr ne presentationWgr ne presentation
Wgr ne presentation
krgc
 
Ce wyandotte presentation
Ce   wyandotte presentationCe   wyandotte presentation
Ce wyandotte presentation
krgc
 
Leg sun lottery review board rebutal-final final
Leg sun   lottery review board rebutal-final finalLeg sun   lottery review board rebutal-final final
Leg sun lottery review board rebutal-final final
krgc
 
Civic economics show 2010
Civic economics show 2010Civic economics show 2010
Civic economics show 2010
krgc
 
Probe northeast 082608-v1
Probe   northeast 082608-v1Probe   northeast 082608-v1
Probe northeast 082608-v1
krgc
 
Cummings ne draft 0826
Cummings ne draft 0826Cummings ne draft 0826
Cummings ne draft 0826
krgc
 
Wgr ne presentation(1)
Wgr ne presentation(1)Wgr ne presentation(1)
Wgr ne presentation(1)
krgc
 
Saratoga Partnership Unveils Inaugural Hospitality & Tourism Index: Thriving ...
Saratoga Partnership Unveils Inaugural Hospitality & Tourism Index: Thriving ...Saratoga Partnership Unveils Inaugural Hospitality & Tourism Index: Thriving ...
Saratoga Partnership Unveils Inaugural Hospitality & Tourism Index: Thriving ...
Shelby Schneider
 
Wyandotte presentation
Wyandotte presentationWyandotte presentation
Wyandotte presentation
krgc
 
Golden presentation
Golden presentationGolden presentation
Golden presentation
krgc
 
Cummings ne handout 1019
Cummings ne handout 1019Cummings ne handout 1019
Cummings ne handout 1019
krgc
 
Alex Rodriguez Final Presentation
Alex Rodriguez Final PresentationAlex Rodriguez Final Presentation
Alex Rodriguez Final Presentation
Ilan Bielas
 
Ccs presentation december 2010
Ccs presentation december 2010Ccs presentation december 2010
Ccs presentation december 2010
krgc
 
Meridian dodge city resort-sw
Meridian   dodge city resort-swMeridian   dodge city resort-sw
Meridian dodge city resort-sw
krgc
 

What's hot (20)

Kansas Star dec 1_final
Kansas Star dec 1_finalKansas Star dec 1_final
Kansas Star dec 1_final
 
Wells Gaming ppt 2010
Wells Gaming ppt 2010Wells Gaming ppt 2010
Wells Gaming ppt 2010
 
Kansas star presentation[1]
Kansas star presentation[1]Kansas star presentation[1]
Kansas star presentation[1]
 
Peninsula dec 15 final
Peninsula dec 15 finalPeninsula dec 15 final
Peninsula dec 15 final
 
Peninsula crossroads dec 1 2010 powerpoint presentation
Peninsula crossroads dec 1 2010 powerpoint presentationPeninsula crossroads dec 1 2010 powerpoint presentation
Peninsula crossroads dec 1 2010 powerpoint presentation
 
EEC presentation
EEC presentationEEC presentation
EEC presentation
 
Wgr ne presentation
Wgr ne presentationWgr ne presentation
Wgr ne presentation
 
Ce wyandotte presentation
Ce   wyandotte presentationCe   wyandotte presentation
Ce wyandotte presentation
 
Leg sun lottery review board rebutal-final final
Leg sun   lottery review board rebutal-final finalLeg sun   lottery review board rebutal-final final
Leg sun lottery review board rebutal-final final
 
Civic economics show 2010
Civic economics show 2010Civic economics show 2010
Civic economics show 2010
 
Probe northeast 082608-v1
Probe   northeast 082608-v1Probe   northeast 082608-v1
Probe northeast 082608-v1
 
Cummings ne draft 0826
Cummings ne draft 0826Cummings ne draft 0826
Cummings ne draft 0826
 
Wgr ne presentation(1)
Wgr ne presentation(1)Wgr ne presentation(1)
Wgr ne presentation(1)
 
Saratoga Partnership Unveils Inaugural Hospitality & Tourism Index: Thriving ...
Saratoga Partnership Unveils Inaugural Hospitality & Tourism Index: Thriving ...Saratoga Partnership Unveils Inaugural Hospitality & Tourism Index: Thriving ...
Saratoga Partnership Unveils Inaugural Hospitality & Tourism Index: Thriving ...
 
Wyandotte presentation
Wyandotte presentationWyandotte presentation
Wyandotte presentation
 
Golden presentation
Golden presentationGolden presentation
Golden presentation
 
Cummings ne handout 1019
Cummings ne handout 1019Cummings ne handout 1019
Cummings ne handout 1019
 
Alex Rodriguez Final Presentation
Alex Rodriguez Final PresentationAlex Rodriguez Final Presentation
Alex Rodriguez Final Presentation
 
Ccs presentation december 2010
Ccs presentation december 2010Ccs presentation december 2010
Ccs presentation december 2010
 
Meridian dodge city resort-sw
Meridian   dodge city resort-swMeridian   dodge city resort-sw
Meridian dodge city resort-sw
 

Similar to Union Gaming Analytics (Michael Greene)

Wgr ks mkt_stdypres_060308r
Wgr ks mkt_stdypres_060308rWgr ks mkt_stdypres_060308r
Wgr ks mkt_stdypres_060308r
krgc
 
Grand Hudson Resort & Casino Proposal
Grand Hudson Resort & Casino ProposalGrand Hudson Resort & Casino Proposal
Grand Hudson Resort & Casino Proposal
kfloydr2r
 
What If Danville Gets a Casino? Risks, Rewards, Uncertainties
What If Danville Gets a Casino? Risks, Rewards, UncertaintiesWhat If Danville Gets a Casino? Risks, Rewards, Uncertainties
What If Danville Gets a Casino? Risks, Rewards, Uncertainties
Danville Regional Foundation
 
Kansascrossingppt july2 final auto play
Kansascrossingppt july2 final auto playKansascrossingppt july2 final auto play
Kansascrossingppt july2 final auto play
krgc
 
Rural Entrepreneurship - Erik Pedersen
Rural Entrepreneurship - Erik PedersenRural Entrepreneurship - Erik Pedersen
Rural Entrepreneurship - Erik Pedersen
kphodel
 
Final hollywood presentation 09.14.09
Final hollywood presentation 09.14.09Final hollywood presentation 09.14.09
Final hollywood presentation 09.14.09
krgc
 
MACVB Education Summit - Boosting Value
MACVB Education Summit - Boosting ValueMACVB Education Summit - Boosting Value
MACVB Education Summit - Boosting Value
Jeff Zahn
 
Wgr sw presentation
Wgr sw presentationWgr sw presentation
Wgr sw presentation
krgc
 
Resorts World Hudson Valley Presentation
Resorts World Hudson Valley PresentationResorts World Hudson Valley Presentation
Resorts World Hudson Valley Presentation
clarkgaga
 
Facebook Comparison Report of Top Casinos on the Las Vegas Strip
Facebook Comparison Report of Top Casinos on the Las Vegas StripFacebook Comparison Report of Top Casinos on the Las Vegas Strip
Facebook Comparison Report of Top Casinos on the Las Vegas Strip
Unmetric
 
Cummings ks slides 0820
Cummings ks slides 0820Cummings ks slides 0820
Cummings ks slides 0820
krgc
 
June Market Report 2014
June Market Report 2014June Market Report 2014
June Market Report 2014
Michelle Makos
 
Isgn long version
Isgn long versionIsgn long version
Isgn long version
Eddie Godshalk
 
Greater Zion Marketing Series III: We Are Greater Zion
Greater Zion Marketing Series III: We Are Greater ZionGreater Zion Marketing Series III: We Are Greater Zion
Greater Zion Marketing Series III: We Are Greater Zion
greaterzion
 
Ks lotteryreviewboard 28october2010-(final)
Ks   lotteryreviewboard 28october2010-(final)Ks   lotteryreviewboard 28october2010-(final)
Ks lotteryreviewboard 28october2010-(final)
krgc
 
Market Report for August 2017 - Residential Resale
Market Report for August 2017 - Residential ResaleMarket Report for August 2017 - Residential Resale
Market Report for August 2017 - Residential Resale
Michelle Makos
 
Kc northeast raving final report
Kc northeast raving final reportKc northeast raving final report
Kc northeast raving final report
krgc
 
North Carolina 2013 LTC Costs
North Carolina 2013 LTC CostsNorth Carolina 2013 LTC Costs
North Carolina 2013 LTC Costs
Brian Johnson
 
Spectrum Gaming Group, Independent Research and Professional Services
Spectrum Gaming Group, Independent Research and Professional ServicesSpectrum Gaming Group, Independent Research and Professional Services
Spectrum Gaming Group, Independent Research and Professional Services
Market Engel SAS
 
TREB MARKET WATCH 2017
TREB MARKET WATCH 2017TREB MARKET WATCH 2017
TREB MARKET WATCH 2017
Michelle Makos
 

Similar to Union Gaming Analytics (Michael Greene) (20)

Wgr ks mkt_stdypres_060308r
Wgr ks mkt_stdypres_060308rWgr ks mkt_stdypres_060308r
Wgr ks mkt_stdypres_060308r
 
Grand Hudson Resort & Casino Proposal
Grand Hudson Resort & Casino ProposalGrand Hudson Resort & Casino Proposal
Grand Hudson Resort & Casino Proposal
 
What If Danville Gets a Casino? Risks, Rewards, Uncertainties
What If Danville Gets a Casino? Risks, Rewards, UncertaintiesWhat If Danville Gets a Casino? Risks, Rewards, Uncertainties
What If Danville Gets a Casino? Risks, Rewards, Uncertainties
 
Kansascrossingppt july2 final auto play
Kansascrossingppt july2 final auto playKansascrossingppt july2 final auto play
Kansascrossingppt july2 final auto play
 
Rural Entrepreneurship - Erik Pedersen
Rural Entrepreneurship - Erik PedersenRural Entrepreneurship - Erik Pedersen
Rural Entrepreneurship - Erik Pedersen
 
Final hollywood presentation 09.14.09
Final hollywood presentation 09.14.09Final hollywood presentation 09.14.09
Final hollywood presentation 09.14.09
 
MACVB Education Summit - Boosting Value
MACVB Education Summit - Boosting ValueMACVB Education Summit - Boosting Value
MACVB Education Summit - Boosting Value
 
Wgr sw presentation
Wgr sw presentationWgr sw presentation
Wgr sw presentation
 
Resorts World Hudson Valley Presentation
Resorts World Hudson Valley PresentationResorts World Hudson Valley Presentation
Resorts World Hudson Valley Presentation
 
Facebook Comparison Report of Top Casinos on the Las Vegas Strip
Facebook Comparison Report of Top Casinos on the Las Vegas StripFacebook Comparison Report of Top Casinos on the Las Vegas Strip
Facebook Comparison Report of Top Casinos on the Las Vegas Strip
 
Cummings ks slides 0820
Cummings ks slides 0820Cummings ks slides 0820
Cummings ks slides 0820
 
June Market Report 2014
June Market Report 2014June Market Report 2014
June Market Report 2014
 
Isgn long version
Isgn long versionIsgn long version
Isgn long version
 
Greater Zion Marketing Series III: We Are Greater Zion
Greater Zion Marketing Series III: We Are Greater ZionGreater Zion Marketing Series III: We Are Greater Zion
Greater Zion Marketing Series III: We Are Greater Zion
 
Ks lotteryreviewboard 28october2010-(final)
Ks   lotteryreviewboard 28october2010-(final)Ks   lotteryreviewboard 28october2010-(final)
Ks lotteryreviewboard 28october2010-(final)
 
Market Report for August 2017 - Residential Resale
Market Report for August 2017 - Residential ResaleMarket Report for August 2017 - Residential Resale
Market Report for August 2017 - Residential Resale
 
Kc northeast raving final report
Kc northeast raving final reportKc northeast raving final report
Kc northeast raving final report
 
North Carolina 2013 LTC Costs
North Carolina 2013 LTC CostsNorth Carolina 2013 LTC Costs
North Carolina 2013 LTC Costs
 
Spectrum Gaming Group, Independent Research and Professional Services
Spectrum Gaming Group, Independent Research and Professional ServicesSpectrum Gaming Group, Independent Research and Professional Services
Spectrum Gaming Group, Independent Research and Professional Services
 
TREB MARKET WATCH 2017
TREB MARKET WATCH 2017TREB MARKET WATCH 2017
TREB MARKET WATCH 2017
 

More from krgc

2015 LGFRB Camptown Casino Proposal
2015 LGFRB Camptown Casino Proposal2015 LGFRB Camptown Casino Proposal
2015 LGFRB Camptown Casino Proposal
krgc
 
2015 LGFRB Presentation Castle Rock Casino Resort
2015 LGFRB Presentation Castle Rock Casino Resort 2015 LGFRB Presentation Castle Rock Casino Resort
2015 LGFRB Presentation Castle Rock Casino Resort
krgc
 
global gaming 15-december2010_(final)
global gaming 15-december2010_(final)global gaming 15-december2010_(final)
global gaming 15-december2010_(final)
krgc
 
Public comments 2
Public comments 2Public comments 2
Public comments 2
krgc
 
cbre letter to review board
cbre letter to review boardcbre letter to review board
cbre letter to review boardkrgc
 
cbre letter to review board
cbre letter to review boardcbre letter to review board
cbre letter to review boardkrgc
 
Macomber memo
Macomber memoMacomber memo
Macomber memo
krgc
 
peninsula plans meet or exceed drainage standards
peninsula plans meet or exceed drainage standardspeninsula plans meet or exceed drainage standards
peninsula plans meet or exceed drainage standards
krgc
 
Cummings response to global gaming
Cummings response to global gamingCummings response to global gaming
Cummings response to global gaming
krgc
 
Sumner co. memo to lgfrb 12-10-10
Sumner co. memo to lgfrb 12-10-10Sumner co. memo to lgfrb 12-10-10
Sumner co. memo to lgfrb 12-10-10
krgc
 
Global gaming responses to 12-7 meeting
Global gaming responses to 12-7 meetingGlobal gaming responses to 12-7 meeting
Global gaming responses to 12-7 meeting
krgc
 
Public comments
Public commentsPublic comments
Public commentskrgc
 
lottery response re question from review board re peninsula's timelines exh...
lottery response re question from review board re peninsula's  timelines  exh...lottery response re question from review board re peninsula's  timelines  exh...
lottery response re question from review board re peninsula's timelines exh...
krgc
 
global response to board 1201 questions
 global response to board 1201 questions global response to board 1201 questions
global response to board 1201 questions
krgc
 
20101204 peninsula response to board 1201 questions - description of ad astr...
20101204 peninsula response to board 1201 questions  - description of ad astr...20101204 peninsula response to board 1201 questions  - description of ad astr...
20101204 peninsula response to board 1201 questions - description of ad astr...
krgc
 
Global gaming ks -01december2010
Global gaming ks -01december2010Global gaming ks -01december2010
Global gaming ks -01december2010
krgc
 

More from krgc (16)

2015 LGFRB Camptown Casino Proposal
2015 LGFRB Camptown Casino Proposal2015 LGFRB Camptown Casino Proposal
2015 LGFRB Camptown Casino Proposal
 
2015 LGFRB Presentation Castle Rock Casino Resort
2015 LGFRB Presentation Castle Rock Casino Resort 2015 LGFRB Presentation Castle Rock Casino Resort
2015 LGFRB Presentation Castle Rock Casino Resort
 
global gaming 15-december2010_(final)
global gaming 15-december2010_(final)global gaming 15-december2010_(final)
global gaming 15-december2010_(final)
 
Public comments 2
Public comments 2Public comments 2
Public comments 2
 
cbre letter to review board
cbre letter to review boardcbre letter to review board
cbre letter to review board
 
cbre letter to review board
cbre letter to review boardcbre letter to review board
cbre letter to review board
 
Macomber memo
Macomber memoMacomber memo
Macomber memo
 
peninsula plans meet or exceed drainage standards
peninsula plans meet or exceed drainage standardspeninsula plans meet or exceed drainage standards
peninsula plans meet or exceed drainage standards
 
Cummings response to global gaming
Cummings response to global gamingCummings response to global gaming
Cummings response to global gaming
 
Sumner co. memo to lgfrb 12-10-10
Sumner co. memo to lgfrb 12-10-10Sumner co. memo to lgfrb 12-10-10
Sumner co. memo to lgfrb 12-10-10
 
Global gaming responses to 12-7 meeting
Global gaming responses to 12-7 meetingGlobal gaming responses to 12-7 meeting
Global gaming responses to 12-7 meeting
 
Public comments
Public commentsPublic comments
Public comments
 
lottery response re question from review board re peninsula's timelines exh...
lottery response re question from review board re peninsula's  timelines  exh...lottery response re question from review board re peninsula's  timelines  exh...
lottery response re question from review board re peninsula's timelines exh...
 
global response to board 1201 questions
 global response to board 1201 questions global response to board 1201 questions
global response to board 1201 questions
 
20101204 peninsula response to board 1201 questions - description of ad astr...
20101204 peninsula response to board 1201 questions  - description of ad astr...20101204 peninsula response to board 1201 questions  - description of ad astr...
20101204 peninsula response to board 1201 questions - description of ad astr...
 
Global gaming ks -01december2010
Global gaming ks -01december2010Global gaming ks -01december2010
Global gaming ks -01december2010
 

Recently uploaded

加急办理华威大学毕业证硕士文凭证书原版一模一样
加急办理华威大学毕业证硕士文凭证书原版一模一样加急办理华威大学毕业证硕士文凭证书原版一模一样
加急办理华威大学毕业证硕士文凭证书原版一模一样
uu1psyf6
 
Milton Keynes Hospital Charity - A guide to leaving a gift in your Will
Milton Keynes Hospital Charity - A guide to leaving a gift in your WillMilton Keynes Hospital Charity - A guide to leaving a gift in your Will
Milton Keynes Hospital Charity - A guide to leaving a gift in your Will
fundraising4
 
G7 Apulia Leaders Communique, 14th June 2024
G7 Apulia Leaders Communique, 14th June 2024G7 Apulia Leaders Communique, 14th June 2024
G7 Apulia Leaders Communique, 14th June 2024
Energy for One World
 
G7 Apulia Leaders Communique, June 2024 (1).pdf
G7 Apulia Leaders Communique, June 2024 (1).pdfG7 Apulia Leaders Communique, June 2024 (1).pdf
G7 Apulia Leaders Communique, June 2024 (1).pdf
Energy for One World
 
karnataka housing board schemes . all schemes
karnataka housing board schemes . all schemeskarnataka housing board schemes . all schemes
karnataka housing board schemes . all schemes
narinav14
 
在线办理(西班牙UPV毕业证书)瓦伦西亚理工大学毕业证毕业完成信一模一样
在线办理(西班牙UPV毕业证书)瓦伦西亚理工大学毕业证毕业完成信一模一样在线办理(西班牙UPV毕业证书)瓦伦西亚理工大学毕业证毕业完成信一模一样
在线办理(西班牙UPV毕业证书)瓦伦西亚理工大学毕业证毕业完成信一模一样
dj1cx4ex
 
PPT Item # 4 - 434 College Blvd. (sign. review)
PPT Item # 4 - 434 College Blvd. (sign. review)PPT Item # 4 - 434 College Blvd. (sign. review)
PPT Item # 4 - 434 College Blvd. (sign. review)
ahcitycouncil
 
How To Cultivate Community Affinity Throughout The Generosity Journey
How To Cultivate Community Affinity Throughout The Generosity JourneyHow To Cultivate Community Affinity Throughout The Generosity Journey
How To Cultivate Community Affinity Throughout The Generosity Journey
Aggregage
 
AHMR volume 10 number 1 January-April 2024
AHMR volume 10 number 1 January-April 2024AHMR volume 10 number 1 January-April 2024
AHMR volume 10 number 1 January-April 2024
Scalabrini Institute for Human Mobility in Africa
 
Contributi dei parlamentari del PD - Contributi L. 3/2019
Contributi dei parlamentari del PD - Contributi L. 3/2019Contributi dei parlamentari del PD - Contributi L. 3/2019
Contributi dei parlamentari del PD - Contributi L. 3/2019
Partito democratico
 
CBO's Immigration Projections - Presentation
CBO's Immigration Projections - PresentationCBO's Immigration Projections - Presentation
CBO's Immigration Projections - Presentation
Congressional Budget Office
 
Indira awas yojana housing scheme renamed as PMAY
Indira awas yojana housing scheme renamed as PMAYIndira awas yojana housing scheme renamed as PMAY
Indira awas yojana housing scheme renamed as PMAY
narinav14
 
一比一原版(Adelaide毕业证)阿德莱德大学毕业证如何办理
一比一原版(Adelaide毕业证)阿德莱德大学毕业证如何办理一比一原版(Adelaide毕业证)阿德莱德大学毕业证如何办理
一比一原版(Adelaide毕业证)阿德莱德大学毕业证如何办理
teeaszt
 
Antyodaya saral portal haryana govt schemes
Antyodaya saral portal haryana govt schemesAntyodaya saral portal haryana govt schemes
Antyodaya saral portal haryana govt schemes
narinav14
 
2024: The FAR - Federal Acquisition Regulations, Part 42
2024: The FAR - Federal Acquisition Regulations, Part 422024: The FAR - Federal Acquisition Regulations, Part 42
2024: The FAR - Federal Acquisition Regulations, Part 42
JSchaus & Associates
 
Item # 10 -- Historical Presv. Districts
Item # 10 -- Historical Presv. DistrictsItem # 10 -- Historical Presv. Districts
Item # 10 -- Historical Presv. Districts
ahcitycouncil
 
2024: The FAR - Federal Acquisition Regulations, Part 41
2024: The FAR - Federal Acquisition Regulations, Part 412024: The FAR - Federal Acquisition Regulations, Part 41
2024: The FAR - Federal Acquisition Regulations, Part 41
JSchaus & Associates
 
原版制作(英国Southampton毕业证书)南安普顿大学毕业证录取通知书一模一样
原版制作(英国Southampton毕业证书)南安普顿大学毕业证录取通知书一模一样原版制作(英国Southampton毕业证书)南安普顿大学毕业证录取通知书一模一样
原版制作(英国Southampton毕业证书)南安普顿大学毕业证录取通知书一模一样
3woawyyl
 
一比一原版(theauckland毕业证书)新西兰奥克兰大学毕业证成绩单如何办理
一比一原版(theauckland毕业证书)新西兰奥克兰大学毕业证成绩单如何办理一比一原版(theauckland毕业证书)新西兰奥克兰大学毕业证成绩单如何办理
一比一原版(theauckland毕业证书)新西兰奥克兰大学毕业证成绩单如何办理
odmqk
 
PPT Item # 7 - 231 Encino Avenue (sign. review)
PPT Item # 7 - 231 Encino Avenue (sign. review)PPT Item # 7 - 231 Encino Avenue (sign. review)
PPT Item # 7 - 231 Encino Avenue (sign. review)
ahcitycouncil
 

Recently uploaded (20)

加急办理华威大学毕业证硕士文凭证书原版一模一样
加急办理华威大学毕业证硕士文凭证书原版一模一样加急办理华威大学毕业证硕士文凭证书原版一模一样
加急办理华威大学毕业证硕士文凭证书原版一模一样
 
Milton Keynes Hospital Charity - A guide to leaving a gift in your Will
Milton Keynes Hospital Charity - A guide to leaving a gift in your WillMilton Keynes Hospital Charity - A guide to leaving a gift in your Will
Milton Keynes Hospital Charity - A guide to leaving a gift in your Will
 
G7 Apulia Leaders Communique, 14th June 2024
G7 Apulia Leaders Communique, 14th June 2024G7 Apulia Leaders Communique, 14th June 2024
G7 Apulia Leaders Communique, 14th June 2024
 
G7 Apulia Leaders Communique, June 2024 (1).pdf
G7 Apulia Leaders Communique, June 2024 (1).pdfG7 Apulia Leaders Communique, June 2024 (1).pdf
G7 Apulia Leaders Communique, June 2024 (1).pdf
 
karnataka housing board schemes . all schemes
karnataka housing board schemes . all schemeskarnataka housing board schemes . all schemes
karnataka housing board schemes . all schemes
 
在线办理(西班牙UPV毕业证书)瓦伦西亚理工大学毕业证毕业完成信一模一样
在线办理(西班牙UPV毕业证书)瓦伦西亚理工大学毕业证毕业完成信一模一样在线办理(西班牙UPV毕业证书)瓦伦西亚理工大学毕业证毕业完成信一模一样
在线办理(西班牙UPV毕业证书)瓦伦西亚理工大学毕业证毕业完成信一模一样
 
PPT Item # 4 - 434 College Blvd. (sign. review)
PPT Item # 4 - 434 College Blvd. (sign. review)PPT Item # 4 - 434 College Blvd. (sign. review)
PPT Item # 4 - 434 College Blvd. (sign. review)
 
How To Cultivate Community Affinity Throughout The Generosity Journey
How To Cultivate Community Affinity Throughout The Generosity JourneyHow To Cultivate Community Affinity Throughout The Generosity Journey
How To Cultivate Community Affinity Throughout The Generosity Journey
 
AHMR volume 10 number 1 January-April 2024
AHMR volume 10 number 1 January-April 2024AHMR volume 10 number 1 January-April 2024
AHMR volume 10 number 1 January-April 2024
 
Contributi dei parlamentari del PD - Contributi L. 3/2019
Contributi dei parlamentari del PD - Contributi L. 3/2019Contributi dei parlamentari del PD - Contributi L. 3/2019
Contributi dei parlamentari del PD - Contributi L. 3/2019
 
CBO's Immigration Projections - Presentation
CBO's Immigration Projections - PresentationCBO's Immigration Projections - Presentation
CBO's Immigration Projections - Presentation
 
Indira awas yojana housing scheme renamed as PMAY
Indira awas yojana housing scheme renamed as PMAYIndira awas yojana housing scheme renamed as PMAY
Indira awas yojana housing scheme renamed as PMAY
 
一比一原版(Adelaide毕业证)阿德莱德大学毕业证如何办理
一比一原版(Adelaide毕业证)阿德莱德大学毕业证如何办理一比一原版(Adelaide毕业证)阿德莱德大学毕业证如何办理
一比一原版(Adelaide毕业证)阿德莱德大学毕业证如何办理
 
Antyodaya saral portal haryana govt schemes
Antyodaya saral portal haryana govt schemesAntyodaya saral portal haryana govt schemes
Antyodaya saral portal haryana govt schemes
 
2024: The FAR - Federal Acquisition Regulations, Part 42
2024: The FAR - Federal Acquisition Regulations, Part 422024: The FAR - Federal Acquisition Regulations, Part 42
2024: The FAR - Federal Acquisition Regulations, Part 42
 
Item # 10 -- Historical Presv. Districts
Item # 10 -- Historical Presv. DistrictsItem # 10 -- Historical Presv. Districts
Item # 10 -- Historical Presv. Districts
 
2024: The FAR - Federal Acquisition Regulations, Part 41
2024: The FAR - Federal Acquisition Regulations, Part 412024: The FAR - Federal Acquisition Regulations, Part 41
2024: The FAR - Federal Acquisition Regulations, Part 41
 
原版制作(英国Southampton毕业证书)南安普顿大学毕业证录取通知书一模一样
原版制作(英国Southampton毕业证书)南安普顿大学毕业证录取通知书一模一样原版制作(英国Southampton毕业证书)南安普顿大学毕业证录取通知书一模一样
原版制作(英国Southampton毕业证书)南安普顿大学毕业证录取通知书一模一样
 
一比一原版(theauckland毕业证书)新西兰奥克兰大学毕业证成绩单如何办理
一比一原版(theauckland毕业证书)新西兰奥克兰大学毕业证成绩单如何办理一比一原版(theauckland毕业证书)新西兰奥克兰大学毕业证成绩单如何办理
一比一原版(theauckland毕业证书)新西兰奥克兰大学毕业证成绩单如何办理
 
PPT Item # 7 - 231 Encino Avenue (sign. review)
PPT Item # 7 - 231 Encino Avenue (sign. review)PPT Item # 7 - 231 Encino Avenue (sign. review)
PPT Item # 7 - 231 Encino Avenue (sign. review)
 

Union Gaming Analytics (Michael Greene)

  • 1. Union Gaming Analytics Gaming Market Study Presentation to the Kansas Lottery Gaming Facility Review Board June 10, 2015
  • 2. Team • Union Gaming Analytics, LLC • Michael Greene, Rich Baldwin, and Bill Lerner • Casinonomics Consulting, LLC • Doug Walker • Civic Economics • Matt Cunningham and Dan Houston • Cummings Associates • Will Cummings • Ekay Economic Consultants • Eugenia Larmore • Macomber International Inc. • Dean Macomber
  • 3. Agenda • Methodology and Projections • Union Gaming Analytics • Cummings Associates • Fiscal Impacts on Municipalities and the State of Kansas • Ekay Economic Consultants • Amenities and Fit • Macomber International • Economic Impacts • Civic Economics • Reinforcement of Economic Impacts and Competition • Casinonomics • Financial Suitability • Union Gaming Analytics • Questions • All Consultants
  • 4. Union Gaming is a portfolio of companies focused exclusively on the global gaming industry. The companies specialize in institutional equity research, securities dealing, investment banking, and gaming-related market and economic analyses. Through its Union Gaming Analytics subsidiary, the company conducts gaming, feasibility, and economic impact studies for both corporate and government entities. The company also provides legislative and regulatory support for gaming related activities globally. Union Gaming Advisors is an SEC registered and FINRA member firm that focuses on capital raising, mergers and acquisitions, securities dealing, and strategic advisory. Union Gaming Securities Asia Limited is a licensed corporation with the Securities and Futures Commission (SFC) in Hong Kong. Founded in 2009, the company is headquartered in Las Vegas, with offices in Hong Kong, Macau, and New York, NY. 4
  • 5. Best-in-class Team with Extensive Gaming Industry Experience Rich Baldwin: Managing Director, Head of Union Gaming Analytics Baldwin has over 20 years of corporate finance, capital markets, investor relations and general management experience spanning the global gaming industry. Baldwin has held several executive level positions, including Chief Financial Officer at Tropicana Entertainment, Executive Vice President & Chief Financial Officer at Shuffle Master Gaming (NASDAQ: “SHFL”) and Director of Corporate Finance & Investor Relations at International Game Technology (NYSE: “IGT”). Baldwin started his career on the client service side with Deloitte & Touche LLP, at which time he received his CPA license in the state of Nevada. Baldwin graduated from the University of Nevada, Las Vegas and also earned his MBA from The Paul Merage School of Business at The University of California, Irvine. Michael Greene Vice President, Analytics, Las Vegas Greene has over 14 years of corporate finance, investment banking, investor relations, and private equity experience in the gaming and lodging industries. Greene joined Union Gaming Analytics in March 2014 as a Director. Prior to joining the firm, Greene managed the investor relations department at International Game Technology (NYSE: “IGT”). Prior to IGT, he was a Vice President with a private equity firm focused on the lodging industry and worked in corporate finance at Pinnacle Entertainment, Inc. (NYSE: “PNK”). Greene began his career as an investment banker at Bear, Stearns & Co. Inc. in their real estate, gaming, lodging and leisure department. Greene received a B.B.A. from The University of Michigan. Bill Lerner Senior Partner, Head of Investment Banking, Las Vegas Lerner has spent 19 years on Wall Street in sell side research. Most recently he acted as Managing Director and Senior Gaming & Lodging analyst at Deutsche Bank Securities. This followed ten years at Prudential Securities and Deutsche Morgan Grenfell. Lerner has been recognized by Institutional Investor as part of its "All American Research Team" and Wall Street Journal's "Best of the Street.”
  • 6. Introduction • Union Gaming has been engaged by the Kansas Racing and Gaming Commission and the Lottery Gaming Facility Review Board to provide consulting services in their selection of a facility manager for the southeast gaming zone of Kansas • Based on Union Gaming’s comprehensive and thorough analysis of the three applicants, we determined the following for each applicant: • Gross Gaming Revenue (“GGR”) • In-state versus out-of-state GGR • In-state versus out-of-state visitation • Tax Revenue – state and local share • EBITDA & EBITDA Margin
  • 7. Executive Summary 2019 ($ in millions except per unit amounts) Camptown Castle Kansas Casino Rock Crossing # of Slots 750 1,400 625 # of Table Games (including poker) 20 51 16 # of Hotel Rooms 62 200 120 GGR $43.9 $47.8 $39.0 Kansas $18.9 $14.8 $15.9 Out-of-State $25.0 $33.0 $23.1 % Kansas 43.0% 30.9% 40.8% % Out-of-State 57.0% 69.1% 59.2% Total Visitation 608,493 687,501 540,753 Kansas 261,636 212,615 220,612 Out-of-State 346,857 474,886 320,141 % Kansas 43.0% 30.9% 40.8% % Out-of-State 57.0% 69.1% 59.2% Total Taxes Paid $11.8 $12.9 $10.5 State Share @ 22.0% $9.7 $10.5 $8.6 Problem Gambling Share @ 2.0% $0.9 $1.0 $0.8 Total State Taxes $10.5 $11.5 $9.4 Local Share @ 3.0% $1.3 $1.4 $1.2
  • 8. Methodology • Examined population and income demographics within a 30-minute, 60-minute and 120-minute drive time radius for the each of the proposed casino sites in southeast Kansas • We established a theoretical gaming market by county for each proposed casino • Apply proprietary capture rates based on competitive dynamics, competitive set, proximity to the closest casino, asset quality, and other forms of gaming to define what percentage of the theoretical market each segment (immediate local, local and regional) will capture
  • 9. Methodology • Examined population and income demographics within a 30-minute, 60-minute and 120-minute drive time radius for the each of the proposed casino sites in southeast Kansas 2015 2015 2015 Adult Gaming 2015 Camptown Casino Population Adult Population Population Per capita income 0-30-minute drive 51,939 38,477 12,315 $19,219 30-60-minute drive 308,414 224,731 71,930 $19,899 60-120-minute drive 2,871,550 2,094,183 670,288 $22,017 Total 3,231,903 2,357,391 754,534 $21,770
  • 10. Methodology • We established a theoretical gaming market by county for each proposed casino % of Theo Distance to Drive Time Adult Per Capita Avg Median Per Capita Gaming Market Castle Rock Castle Rock Population Adult Gaming Income Household Household Income per County County State (miles) (minutes) (2015) Population Population (2015) Income Income Spent on Gaming ($ in millions) Cherokee County Kansas - - 21,327 15,802 5,058 $19,332 $48,223 $38,182 3.5% $3.4 Jasper County Missouri 21.2 21 120,292 86,677 27,743 $19,848 $50,687 $39,343 3.5% $19.3 OttawaCounty Oklahoma 19.8 21 32,314 23,633 7,564 $18,452 $47,284 $36,958 3.5% $4.9 Newton County Missouri 20.5 22 60,133 44,114 14,120 $21,109 $55,336 $40,738 3.5% $10.4 Crawford County Kansas 35.8 40 39,683 29,510 9,445 $19,316 $47,552 $36,997 3.5% $6.4 McDonaldCounty Missouri 45.6 44 24,018 17,086 5,469 $16,489 $45,318 $36,203 3.5% $3.2 Barton County Missouri 49.9 47 12,256 8,967 2,870 $19,121 $47,854 $39,053 3.5% $1.9 Craig County Oklahoma 46.9 47 15,076 11,533 3,691 $19,632 $50,610 $38,315 3.5% $2.5 Lawrence County Missouri 53.8 51 39,357 28,576 9,146 $18,823 $48,659 $38,810 3.5% $6.0 LabetteCounty Kansas 49.6 54 21,382 15,896 5,088 $20,032 $48,735 $40,026 3.5% $3.6 Delaware County Oklahoma 53.9 58 42,890 33,002 10,563 $21,734 $52,225 $37,473 3.5% $8.0 Vernon County Missouri 75.4 69 21,328 15,588 4,989 $18,510 $45,456 $35,325 3.5% $3.2 Benton County Arkansas 69.5 72 240,162 168,638 53,976 $27,037 $73,014 $54,828 3.5% $51.1 Bourbon County Kansas 66.2 73 15,163 10,928 3,498 $19,843 $50,049 $38,113 3.5% $2.4 Dade County Missouri 70.6 73 7,897 6,060 1,940 $17,933 $42,680 $31,974 3.5% $1.2 Mayes County Oklahoma 74.3 73 41,798 30,649 9,810 $20,362 $52,158 $42,168 3.5% $7.0 Barry County Missouri 65.5 74 36,445 27,305 8,740 $18,946 $47,797 $36,783 3.5% $5.8 GreeneCounty Missouri 79.1 75 281,998 214,110 68,531 $23,578 $55,474 $38,801 3.5% $56.6 Nowata County Oklahoma 72.7 76 10,516 7,930 2,538 $18,639 $46,265 $36,407 3.5% $1.7 Rogers County Oklahoma 81.1 77 90,177 65,973 21,116 $27,348 $73,670 $58,525 3.5% $20.2 MontgomeryCounty Kansas 69.9 79 35,004 25,831 8,268 $19,829 $48,512 $37,945 3.5% $5.7 Washington County Arkansas 89.7 87 215,294 153,485 49,126 $21,534 $56,272 $40,821 3.5% $37.0 ChristianCounty Missouri 93.4 87 81,418 58,013 18,568 $24,173 $64,128 $52,045 3.5% $15.7 Neosho County Kansas 83.5 89 16,475 12,093 3,871 $22,067 $54,391 $41,510 3.5% $3.0 Tulsa County Oklahoma 101.3 91 625,723 453,719 145,223 $27,928 $69,262 $48,772 3.5% $142.0 Washington County Oklahoma 89.5 93 52,078 39,089 12,511 $27,620 $66,579 $49,847 3.5% $12.1 Polk County Missouri 104.3 96 31,030 22,655 7,251 $18,160 $47,007 $36,553 3.5% $4.6 Wilson County Kansas 96.3 97 9,382 7,071 2,263 $19,432 $46,209 $35,889 3.5% $1.5 Bates County Missouri 106.3 99 16,837 12,523 4,008 $19,307 $48,171 $36,561 3.5% $2.7 Cedar County Missouri 92.0 99 14,003 10,562 3,381 $16,757 $39,904 $31,738 3.5% $2.0 Wagoner County Oklahoma 107.4 103 75,979 54,947 17,587 $26,033 $70,395 $55,686 3.5% $16.0 Chautauqua County Kansas 97.0 103 3,577 2,824 904 $24,281 $54,492 $37,733 3.5% $0.8 Linn County Kansas 97.0 104 9,774 7,448 2,384 $22,692 $53,990 $47,785 3.5% $1.9 Webster County Missouri 110.2 104 36,783 26,190 8,383 $18,814 $51,339 $41,449 3.5% $5.5 Dallas County Missouri 115.4 107 16,595 12,349 3,953 $18,260 $46,493 $37,598 3.5% $2.5 Allen County Kansas 103.4 109 13,388 9,932 3,179 $20,749 $49,970 $40,068 3.5% $2.3 Creek County Oklahoma 123.4 113 71,260 52,933 16,942 $21,818 $56,688 $43,115 3.5% $12.9 Cherokee County Oklahoma 115.4 115 48,835 35,713 11,431 $18,364 $47,638 $35,855 3.5% $7.3 Muskogee County Oklahoma 115.5 115 71,290 52,408 16,774 $20,450 $52,791 $38,922 3.5% $12.0 Stone County Missouri 103.4 115 32,110 25,946 8,305 $21,728 $50,776 $39,225 3.5% $6.3 LacledeCounty Missouri 130.4 117 36,016 26,466 8,471 $18,974 $47,665 $37,548 3.5% $5.6 Taney County Missouri 121.3 117 55,000 41,780 13,373 $19,171 $47,374 $37,142 3.5% $9.0 St. Clair County Missouri 118.1 119 9,871 7,797 2,496 $17,536 $40,670 $30,319 3.5% $1.5 CarrollCounty Arkansas 102.3 120 27,721 21,164 6,774 $20,138 $48,144 $35,842 3.5% $4.8 2,779,655 2,034,915 651,318 $533.7
  • 11. Methodology • Apply proprietary capture rates based on competitive dynamics, competitive set, proximity to the closest casino, asset quality, and other forms of gaming to define what percentage of the theoretical market each segment (immediate local, local and regional) will capture
  • 12. Methodology • Apply proprietary capture rates based on competitive dynamics, competitive set, proximity to the closest casino, asset quality, and other forms of gaming to define what percentage of the theoretical market each segment (immediate local, local and regional) will capture
  • 13. Camptown 2015 2015 2015 Adult Gaming 2015 Camptown Casino Population Adult Population Population Per capita income 0-30-minute drive 51,939 38,477 12,315 $19,219 30-60-minute drive 308,414 224,731 71,930 $19,899 60-120-minute drive 2,871,550 2,094,183 670,288 $22,017 Total 3,231,903 2,357,391 754,534 $21,770 Project Scope • 750 Slots • 20 Tables • 62 Hotel Rooms The map on the right shows 3 separate drive time zones surrounding the proposed site of Camptown Casino, and the table below shows the relevant information in each zone used for the theoretical market estimation
  • 14. Camptown – Competitive Landscape • Apply proprietary capture rates based on competitive dynamics, competitive set, proximity to the closest casino, asset quality, and other forms of gaming to define what percentage of the theoretical market each segment (immediate local, local and regional) will capture Distance to Distance to Hotel Total Gaming Fair Share Property Location Opening Date Camptown (miles) Camptown (minutes) Slots Tables Rooms Positions by Position Camptown Casino Frontenac, KS - - 750 20 62 870 4.1% Downstream Casino Resort Quapaw, OK 2008 39.6 44 2,000 50 374 2,300 11.0% Quapaw Casino Miami, OK 2000 44.2 50 500 4 - 524 2.5% High Winds Casino Miami, OK 2006 45.1 51 500 - - 500 2.4% Buffalo Run Casino Miami, OK 2004 46.3 53 800 15 100 890 4.2% Prairie Moon Casino Miami, OK 1991 47.5 54 120 - - 120 0.6% Prairie Sun Casino Miami, OK 2013 46.7 56 252 - - 252 1.2% The Stables Casino Miami, OK 1998 48.8 57 500 - - 500 2.4% Lucky Turtle Casino Wyandotte, OK 2004 52.6 60 111 - - 111 0.5% Wyandotte Nation Casino Wyandotte, OK 2007 52.4 61 850 6 - 886 4.2% Bordertown Casino & Arena Wyandotte, OK 2015 55.3 63 500 - - 500 2.4% Indigo Sky Casino Wyandotte, OK 2012 56.8 64 1,270 14 117 1,354 6.5% Grand Lake Casino Grove, OK 1988 65.8 74 841 8 30 889 4.2% 7th Street Casino Kansas City, KS 2007 118.0 104 605 - - 605 2.9% Isle of Capri Kansas City Kansas City, MO 2000 121.0 105 1,058 18 - 1,166 5.6% Argosy Casino Riverside Kansas City, MO 1994 123.0 107 1,473 29 258 1,647 7.9% Cherokee Casino - Will Rogers Downs Claremore, OK 2005 112.0 110 250 - - 250 1.2% Harrah's North Kansas City Kansas City, MO 1992 125.0 113 1,520 75 392 1,970 9.4% Ameristar Kansas City Kansas City, MO 1997 131.0 115 2,450 71 184 2,876 13.7% Hard Rock Hotel and Casino Tulsa Catoosa, OK 2003 122.0 117 2,400 46 454 2,676 12.8% Cherokee Nation Outpost Shop Catoosa, OK 1993 122.0 117 80 - - 80 0.4% Total 20,966 100.0%
  • 15. Camptown – GGR 2017 (1) 2018 (2) 2019 Midpoint Midpoint Midpoint Immediate Local Gaming Market (30-min Drive Radius) Kansas $4.6 $5.1 $5.4 Out-of-State $1.3 $1.4 $1.5 Total Immediate Local Gaming Market (30-min Drive Radius) $5.9 $6.6 $6.9 Local Gaming Market (30 to 60-min Drive Radius) Kansas $5.7 $6.3 $6.7 Out-of-State $9.7 $10.8 $11.4 Total Local Gaming Market (30 to 60-min Drive Radius) $15.4 $17.2 $18.1 Regional Gaming Market (60 to 120-min Drive Radius) Kansas $5.8 $6.5 $6.8 Out-of-State $10.3 $11.5 $12.1 Total Regional Gaming Market (60 to 120-min Drive Radius) $16.0 $17.9 $18.9 Total GGR Kansas $16.0 $17.9 $18.9 Out-of-State $21.3 $23.8 $25.0 Total Camptown Casino GGR $37.3 $41.7 $43.9 (1) 2017 GGR assumes 85.0% of stabilized operations. (2) 2018 GGR assumes 95.0% of stabilized operations.
  • 16. Camptown – GGR by State • Kansas $18.9 million 43.0% • Missouri $22.1 million 50.5% • Oklahoma $1.0 million 2.3% • Arkansas $1.9 million 4.2% Total Revenue - 2019 Kansas Missouri Oklahoma Arkansas Total Immediate Local Gaming Market (30-min Drive Radius) $5.4 $1.5 - - $6.9 Local Gaming Market (30 to 60-min Drive Radius) $6.7 $11.1 $0.3 - $18.1 Regional Gaming Market (60 to 120-min Drive Radius) $6.8 $9.5 $0.7 $1.9 $18.9 Total Camptown Casino GGR $18.9 $22.1 $1.0 $1.9 $43.9 % of Revenue Kansas Missouri Oklahoma Arkansas Total Immediate Local Gaming Market (30-min Drive Radius) 12.3% 3.5% - - 15.8% Local Gaming Market (30 to 60-min Drive Radius) 15.2% 25.4% 0.6% - 41.2% Regional Gaming Market (60 to 120-min Drive Radius) 15.5% 21.6% 1.7% 4.2% 43.0% Total Camptown Casino GGR 43.0% 50.5% 2.3% 4.2% 100.0%
  • 17. Camptown – Visitation by State Total Visitors - 2019 Kansas Missouri Oklahoma Arkansas Total Immediate Local Gaming Market (30-min Drive Radius) 74,974 21,142 - - 96,116 Local Gaming Market (30 to 60-min Drive Radius) 92,432 154,505 3,585 - 250,521 Regional Gaming Market (60 to 120-min Drive Radius) 94,230 131,403 10,362 25,861 261,855 Total Camptown Casino Visitors 261,636 307,050 13,947 25,861 608,493 % of Visitors Kansas Missouri Oklahoma Arkansas Total Immediate Local Gaming Market (30-min Drive Radius) 12.3% 3.5% - - 15.8% Local Gaming Market (30 to 60-min Drive Radius) 15.2% 25.4% 0.6% - 41.2% Regional Gaming Market (60 to 120-min Drive Radius) 15.5% 21.6% 1.7% 4.2% 43.0% Total Camptown Casino Visitors 43.0% 50.5% 2.3% 4.2% 100.0% Average Spend per Visit $72.10 We calculate GGR on a county by county basis, which allows us to calculate the visitation by county by dividing county GGR by a spend per visit figure determined by a thorough analysis of comparable gaming markets • Kansas 261,636 • Missouri 307,050 • Oklahoma 13,947 • Arkansas 25,861
  • 18. Camptown - Tax Revenue • Applying the relevant tax structure to Camptown’s revenue projection we calculate total tax revenue of $11.8m, with $10.5m in state taxes and $1.3m in local taxes in 2019 Camptown Casino 2017 2018 2019 GGR $37.3 $41.7 $43.9 State Share @ 22.0% $8.2 $9.2 $9.7 Problem Gambling Share @ 2.0% $0.7 $0.8 $0.9 Total State Taxes $9.0 $10.0 $10.5 Local Share @ 3.0% $1.1 $1.3 $1.3 Total Local Taxes $1.1 $1.3 $1.3 Total Taxes Paid $10.1 $11.3 $11.8
  • 19. Castle Rock 2015 2015 2015 Adult Gaming 2015 Castle Rock Population Adult Population Population Per capita income 0-30-minute drive 234,066 170,226 54,484 $19,685 30-60-minute drive 194,662 144,570 46,273 $19,307 60-120-minute drive 2,350,927 1,720,119 550,561 $21,152 Total 2,779,655 2,034,915 651,318 $20,899 Project Scope • 1,400 Slots • 51 Tables • 200 Hotel Rooms The map on the right shows 3 separate drive time zones surrounding the proposed site of Castle Rock, and the table below shows the relevant information in each zone used for the theoretical market estimation
  • 20. Castle Rock – Competitive Landscape • Apply proprietary capture rates based on competitive dynamics, competitive set, proximity to the closest casino, asset quality, and other forms of gaming to define what percentage of the theoretical market each segment (immediate local, local and regional) will capture Distance to Distance to Total Gaming Fair Share Property Location Opening Date Castle Rock (miles) Castle Rock (minutes) Slots Tables Hotel Rooms Positions by Position Castle Rock Galena, KS - - 1,400 51 200 1,706 7.8% Downstream Casino Resort Quapaw, OK 2008 1.8 4 2,000 50 374 2,300 10.5% Prairie Moon Casino Miami, OK 1991 18.5 19 120 - - 120 0.5% Bordertown Casino & Arena Wyandotte, OK 2015 18.1 22 500 - - 500 2.3% Quapaw Casino Miami, OK 2000 17.8 22 500 4 - 524 2.4% Buffalo Run Casino Miami, OK 2004 20.2 22 800 15 100 890 4.1% The Stables Casino Miami, OK 1998 19.5 22 500 - - 500 2.3% High Winds Casino Miami, OK 2006 18.7 23 500 - - 500 2.3% Indigo Sky Casino Wyandotte, OK 2012 19.2 24 1,270 14 117 1,354 6.2% Prairie Sun Casino Miami, OK 2013 20.3 26 252 - - 252 1.1% Lucky Turtle Casino Wyandotte, OK 2004 26.8 30 111 - - 111 0.5% Wyandotte Nation Casino Wyandotte, OK 2007 26.0 32 850 6 - 886 4.0% Grand Lake Casino Grove, OK 1988 34.9 40 841 8 - 889 4.0% Cherokee Casino - Will Rogers Downs Claremore, OK 2005 82.0 72 250 - - 250 1.1% Hard Rock Hotel and Casino Tulsa Catoosa, OK 2003 91.6 77 2,400 46 454 2,676 12.2% West Siloam Springs Smoke Shop Watts, OK 2009 70.3 87 150 - - 150 0.7% Cherokee Casino & Hotel West Siloam Springs West Siloam Springs, OK 2000 70.3 87 1,300 28 147 1,468 6.7% Cherokee Nation Outpost Shop Catoosa, OK 1993 91.6 87 80 - - 80 0.4% Osage Casino - Tulsa Tulsa, OK 2001 107.0 90 250 - - 250 1.1% River Spirit Casino Tulsa, OK 2009 109.0 95 2,600 25 - 2,750 12.5% Cherokee Casino - Ramona Ramona, OK 2010 101.0 98 500 - - 500 2.3% Osage Casino - Sand Springs Sand Springs, Ok 2004 118.0 101 460 5 - 490 2.2% Osage Casino - Skiatook Skiatook, OK 2011 106.0 104 315 - 28 315 1.4% Cherokee Casino - Fort Gibson Fort Gibson, OK 2004 112.0 104 500 - - 500 2.3% Osage Casino - Bartlesville Bartlesville, OK 2007 100.0 105 450 8 - 498 2.3% Duck Creek Casino Beggs, OK 2003 126.0 107 299 - - 299 1.4% Muskogee Travel Plaza Muskogee, OK 2007 111.0 108 129 - - 129 0.6% Creek Nation Casino Muskogee Muskogee, OK 2006 111.0 108 400 16 - 496 2.3% Cherokee Casino - Tahlequah Tahlequah, OK 2004 115.0 117 400 - - 400 1.8% Osage Casino - Pawhuska Pawhuska, OK 2005 117.0 117 170 - - 170 0.8% Total 21,953 100.0%
  • 21. Castle Rock – GGR 2017 (1) 2018 (2) 2019 Midpoint Midpoint Midpoint Immediate Local Gaming Market (30-min Drive Radius) Kansas $2.5 $2.8 $2.9 Out-of-State $10.0 $11.2 $11.8 Total Immediate Local Gaming Market (30-min Drive Radius) $12.5 $13.9 $14.7 Local Gaming Market (30 to 60-min Drive Radius) Kansas $6.4 $7.1 $7.5 Out-of-State $3.7 $4.2 $4.4 Total Local Gaming Market (30 to 60-min Drive Radius) $10.1 $11.3 $11.9 Regional Gaming Market (60 to 120-min Drive Radius) Kansas $3.7 $4.2 $4.4 Out-of-State $14.3 $16.0 $16.9 Total Regional Gaming Market (60 to 120-min Drive Radius) $18.0 $20.2 $21.2 Total GGR Kansas $12.6 $14.1 $14.8 Out-of-State $28.1 $31.4 $33.0 Total Castle Rock GGR $40.7 $45.4 $47.8 (1) 2017 GGR assumes 85.0% of stabilized operations. (2) 2018 GGR assumes 95.0% of stabilized operations.
  • 22. Castle Rock – GGR by State • Kansas $14.8 million 30.9% • Missouri $22.0 million 45.9% • Oklahoma $5.5 million 11.4% • Arkansas $5.6 million 11.7% Total Revenue - 2019 Kansas Missouri Oklahoma Arkansas Total Immediate Local Gaming Market (30-min Drive Radius) $2.9 $11.0 $0.8 - $14.7 Local Gaming Market (30 to 60-min Drive Radius) $7.5 $3.7 $0.7 - $11.9 Regional Gaming Market (60 to 120-min Drive Radius) $4.4 $7.3 $4.0 $5.6 $21.2 Total Castle Rock GGR $14.8 $22.0 $5.5 $5.6 $47.8 % of Revenue Kansas Missouri Oklahoma Arkansas Total Immediate Local Gaming Market (30-min Drive Radius) 6.1% 23.0% 1.6% - 30.7% Local Gaming Market (30 to 60-min Drive Radius) 15.7% 7.7% 1.5% - 24.9% Regional Gaming Market (60 to 120-min Drive Radius) 9.1% 15.2% 8.3% 11.7% 44.4% Total Castle Rock GGR 30.9% 45.9% 11.4% 11.7% 100.0%
  • 23. Castle Rock – Visitation by State We calculate GGR on a county by county basis, which allows us to calculate the visitation by county by dividing county GGR by a spend per visit figure determined by a thorough analysis of comparable gaming markets • Kansas 212,615 • Missouri 315,768 • Oklahoma 78,636 • Arkansas 80,482 Total Visitors - 2019 Kansas Missouri Oklahoma Arkansas Total Immediate Local Gaming Market (30-min Drive Radius) 41,645 158,145 11,147 - 210,937 Local Gaming Market (30 to 60-min Drive Radius) 108,121 52,866 10,371 - 171,357 Regional Gaming Market (60 to 120-min Drive Radius) 62,849 104,757 57,119 80,482 305,207 Total Castle Rock Visitors 212,615 315,768 78,636 80,482 687,501 % of Visitors Kansas Missouri Oklahoma Arkansas Total Immediate Local Gaming Market (30-min Drive Radius) 6.1% 23.0% - - 30.7% Local Gaming Market (30 to 60-min Drive Radius) 15.7% 7.7% 1.5% - 24.9% Regional Gaming Market (60 to 120-min Drive Radius) 9.1% 15.2% 8.3% 11.7% 44.4% Total Castle Rock Visitors 30.9% 45.9% 11.4% 11.7% 100.0% Average Spend per Visit $69.57
  • 24. Castle Rock - Tax Revenue • Applying the relevant tax structure to Castle Rock’s revenue projection we calculate total tax revenue of $12.9m, with $11.5m in state taxes and $1.4m in local taxes in 2019 Castle Rock 2017 2018 2019 GGR $40.7 $45.4 $47.8 State Share @ 22.0% $8.9 $10.0 $10.5 Problem Gambling Share @ 2.0% $0.8 $0.9 $1.0 Total State Taxes $9.8 $10.9 $11.5 Local Share @ 3.0% $1.2 $1.4 $1.4 Total Local Taxes $1.2 $1.4 $1.4 Total Taxes Paid $11.0 $12.3 $12.9
  • 25. Kansas Crossing 2015 2015 2015 Adult Gaming 2015 Kansas Crossing Population Adult Population Population Per capita income 0-30-minute drive 181,302 131,989 42,246 $19,499 30-60-minute drive 162,576 119,126 38,129 $19,511 60-120-minute drive 2,690,941 1,959,355 627,134 $22,486 Total 3,034,819 2,210,470 707,509 $22,148 Project Scope • 625 Slots • 16 Tables • 120 Hotel Rooms The map on the right shows 3 separate drive time zones surrounding the proposed site of Kansas Crossing, and the table below shows the relevant information in each zone used for the theoretical market estimation
  • 26. Kansas Crossing – Competitive Landscape • Apply proprietary capture rates based on competitive dynamics, competitive set, proximity to the closest casino, asset quality, and other forms of gaming to define what percentage of the theoretical market each segment (immediate local, local and regional) will capture Distance to Distance to Total Gaming Fair Share Property Location Opening Date KS Crossing (miles) KS Crossing (minutes) Slots Tables Hotel Rooms Positions by Position Kansas Crossing Pittsburg, KS - - 625 16 120 721 3.8% Downstream Casino Resort Quapaw, OK 2008 29.6 31 2,000 50 374 2,300 12.2% Quapaw Casino Miami, OK 2000 34.2 37 500 4 - 524 2.8% High Winds Casino Miami, OK 2006 35.1 39 500 - - 500 2.7% Buffalo Run Casino Miami, OK 2004 36.3 41 800 15 100 890 4.7% Prairie Moon Casino Miami, OK 1991 37.5 42 120 - - 120 0.6% Prairie Sun Casino Miami, OK 2013 36.7 44 252 - - 252 1.3% The Stables Casino Miami, OK 1998 38.8 45 500 - - 500 2.7% Wyandotte Nation Casino Wyandotte, OK 2007 42.4 49 850 6 - 886 4.7% Lucky Turtle Casino Wyandotte, OK 2004 42.6 50 111 - - 111 0.6% Bordertown Casino & Arena Wyandotte, OK 2015 45.4 51 500 - - 500 2.7% Indigo Sky Casino Wyandotte, OK 2012 46.8 52 1,270 14 117 1,354 7.2% Grand Lake Casino Grove, OK 1988 55.9 62 841 8 30 889 4.7% Cherokee Casino - Will Rogers Downs Claremore, OK 2005 102.0 98 250 - - 250 1.3% Hard Rock Hotel and Casino Tulsa Catoosa, OK 2003 112.0 105 2,400 46 454 2,676 14.2% Cherokee Nation Outpost Shop Catoosa, OK 1993 112.0 105 80 - - 80 0.4% West Siloam Springs Smoke Shop Watts, OK 2009 104.0 114 150 - - 150 0.8% Cherokee Casino & Hotel West Siloam Springs West Siloam Springs, OK 2000 104.0 114 1,300 28 147 1,468 7.8% 7th Street Casino Kansas City, KS 2007 128.0 115 605 - - 605 3.2% Isle of Capri Kansas City Kansas City, MO 2000 131.0 117 1,058 18 - 1,166 6.2% Osage Casino - Bartlesville Bartlesville, OK 2007 113.0 118 450 8 - 498 2.6% Cherokee Casino - Ramona Ramona, OK 2010 118.0 118 500 - - 500 2.7% Argosy Casino Riverside Kansas City, MO 1994 132.0 119 1,473 29 258 1,647 8.7% Osage Casino - Tulsa Tulsa, OK 2001 127.0 119 250 - - 250 1.3% Total 18,837 100.0%
  • 27. Kansas Crossing – GGR 2017 (1) 2018 (2) 2019 Midpoint Midpoint Midpoint Immediate Local Gaming Market (30-min Drive Radius) Kansas $7.1 $7.9 $8.3 Out-of-State $7.8 $8.7 $9.2 Total Immediate Local Gaming Market (30-min Drive Radius) $14.9 $16.6 $17.5 Local Gaming Market (30 to 60-min Drive Radius) Kansas $3.0 $3.4 $3.6 Out-of-State $5.9 $6.6 $7.0 Total Local Gaming Market (30 to 60-min Drive Radius) $9.0 $10.0 $10.5 Regional Gaming Market (60 to 120-min Drive Radius) Kansas $3.4 $3.9 $4.1 Out-of-State $5.9 $6.6 $6.9 Total Regional Gaming Market (60 to 120-min Drive Radius) $9.3 $10.4 $11.0 Total GGR Kansas $13.5 $15.1 $15.9 Out-of-State $19.6 $21.9 $23.1 Total Kansas Crossing GGR $33.2 $37.1 $39.0 (1) 2017 GGR assumes 85.0% of stabilized operations. (2) 2018 GGR assumes 95.0% of stabilized operations.
  • 28. Kansas Crossing – GGR by State • Kansas $15.9 million 40.8% • Missouri $19.6 million 50.3% • Oklahoma $1.6 million 4.0% • Arkansas $1.9 million 4.9% Total Revenue - 2019 Kansas Missouri Oklahoma Arkansas Total Immediate Local Gaming Market (30-min Drive Radius) $8.3 $9.2 - - $17.5 Local Gaming Market (30 to 60-min Drive Radius) $3.6 $6.7 $0.3 - $10.5 Regional Gaming Market (60 to 120-min Drive Radius) $4.1 $3.7 $1.3 $1.9 $11.0 Total Kansas Crossing GGR $15.9 $19.6 $1.6 $1.9 $39.0 % of Revenue Kansas Missouri Oklahoma Arkansas Total Immediate Local Gaming Market (30-min Drive Radius) 21.3% 23.5% - - 44.8% Local Gaming Market (30 to 60-min Drive Radius) 9.1% 17.2% 0.7% - 27.0% Regional Gaming Market (60 to 120-min Drive Radius) 10.4% 9.5% 3.3% 4.9% 28.2% Total Kansas Crossing GGR 40.8% 50.3% 4.0% 4.9% 100.0%
  • 29. Kansas Crossing – Visitation by State We calculate GGR on a county by county basis, which allows us to calculate the visitation by county by dividing county GGR by a spend per visit figure determined by a thorough analysis of comparable gaming markets • Kansas 220,612 • Missouri 272,006 • Oklahoma 21,588 • Arkansas 26,548 Total Visitors - 2019 Kansas Missouri Oklahoma Arkansas Total Immediate Local Gaming Market (30-min Drive Radius) 115,081 127,201 - - 242,283 Local Gaming Market (30 to 60-min Drive Radius) 49,319 93,197 3,583 - 146,099 Regional Gaming Market (60 to 120-min Drive Radius) 56,211 51,607 18,005 26,548 152,371 Total Kansas Crossing Visitors 220,612 272,006 21,588 26,548 540,753 % of Visitors Kansas Missouri Oklahoma Arkansas Total Immediate Local Gaming Market (30-min Drive Radius) 21.3% 23.5% - - 44.8% Local Gaming Market (30 to 60-min Drive Radius) 9.1% 17.2% 0.7% - 27.0% Regional Gaming Market (60 to 120-min Drive Radius) 10.4% 9.5% 3.3% 4.9% 28.2% Total Kansas Crossing Visitors 40.8% 50.3% 4.0% 4.9% 100.0% Average Spend per Visit $72.15
  • 30. Kansas Crossing - Tax Revenue • Applying the relevant tax structure to Kansas Crossing’s revenue projection we calculate total tax revenue of $10.5m, with $9.4m in state taxes and $1.2m in local taxes in 2019 Kansas Crossing 2017 2018 2019 GGR $33.2 $37.1 $39.0 State Share @ 22.0% $7.3 $8.2 $8.6 Problem Gambling Share @ 2.0% $0.7 $0.7 $0.8 Total State Taxes $8.0 $8.9 $9.4 Local Share @ 3.0% $1.0 $1.1 $1.2 Total Local Taxes $1.0 $1.1 $1.2 Total Taxes Paid $9.0 $10.0 $10.5
  • 31. UGA Camptown Comparison Camptown (1) Union Gaming Applicant Slot Revenue $37.3 $41.9 Table Revenue 6.6 6.7 Gross Gaming Revenue $43.9 $48.6 F&B Revenue $4.4 $7.1 Hotel Revenue 1.8 1 Other Revenue (Entertainment, Retail, ATMFees, etc) 0.9 0.2 Gross Revenues $50.9 $57.3 Less: Promotional Allowances (4.4) (4.7) Net Revenue $46.5 $52.7 EBITDA $9.3 $15.1 EBITDA Margin 20.0% 28.8% (1) Camptown did not provide projections for year three of operations (2019), therefore, we assume growth of 1.0% for both 2018 and 2019 to arrive out their 2019 projections.
  • 32. UGA Castle Rock Comparison Castle Rock Union Gaming Applicant Slot Revenue $40.7 $73.4 Table Revenue 7.2 18.2 Gross Gaming Revenue $47.8 $91.7 F&B Revenue $5.7 $8.7 Hotel Revenue 4.8 8 Other Revenue (Entertainment, Retail, ATMFees, etc) 1.9 4.8 Gross Revenues $60.3 $112.7 Less: Promotional Allowances (4.8) (0.8) Net Revenue $55.5 $112.0 EBITDA (1) $8.0 $29.1 EBITDA Margin 14.4% 26.0% (1) EBITDA is after management fee but before principal and interest payments.
  • 33. UGA Kansas Crossing Comparison Kansas Crossing Union Gaming Applicant Slot Revenue $33.2 $38.5 Table Revenue 5.9 8.7 Gross Gaming Revenue $39.0 $47.2 F&B Revenue $2.0 $2.3 Hotel Revenue 0.0 - Other Revenue (Entertainment, Retail, ATMFees, etc) 0.4 0.5 Gross Revenues $41.4 $50.1 Less: Promotional Allowances (3.9) (4.5) Net Revenue $37.5 $45.5 EBITDA (1) $7.3 $10.2 EBITDA Margin 19.6% 22.3% (1) EBITDA is after management fee but before principal and interest payments and preferred return payments.
  • 34. UGA Applicant Comparisons Camptown Castle Kansas Casino (1) Rock Crossing Union Gaming Projections - 2019 Slot Revenue $37.3 $40.7 $33.2 Table Revenue 6.6 7.2 5.9 Gross Gaming Revenue $43.9 $47.8 $39.0 F&B Revenue $4.4 $5.7 $2.0 Hotel Revenue 1.8 4.8 - Other Revenue (Entertainment, Retail, ATMFees, etc) 0.9 1.9 0.4 Gross Revenues $50.9 $60.3 $41.4 Less: Promotional Allowances (4.4) (4.8) (3.9) Net Revenue $46.5 $55.5 $37.5 EBITDA $9.3 $8.0 $7.3 EBITDA Margin 20.0% 14.4% 19.6% (1) Camptown did not provide projections for year three of operations (2019), therefore, we assume growth of 1.0% for both 2018 and 2019 to arrive out their 2019 projections.