
Recommended
Recommended
More Related Content
Similar to Mars Wrigly DMS
Similar to Mars Wrigly DMS (20)
Recently uploaded
Recently uploaded (20)
Mars Wrigly DMS
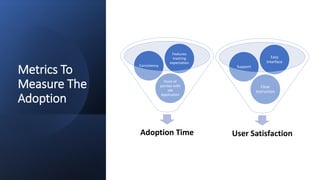
- 1. Metrics To Measure The Adoption Adoption Time Point of parities with old Application Consistency Features meeting expectation User Satisfaction Clear Instruction Support Easy Interface
- 2. Adoption time: This measures the amount of time it takes for users to reach to his/her normal efficiency 0 0.1 0.2 0.3 0.4 0.5 0.6 0.7 0.8 0.9 1 0 50 100 150 200 250 300 350 400 450 500 Average time spent per SKU line (Y) Cumulative SKUs line (X) X Variable 1 Line Fit Plot Y Predicted Y Expon. (Y) Result Days required to reach the old efficiency = 26 or ~One Period Current Input Rate (Tejas) = 1SKU/21.6sec Previous Input Rate (Compass) = 1SKU/7.7sec
- 3. Average Customer Satisfaction grade: 6.5/10 User Satisfaction: This measures how satisfied users are with the application
- 4. Most used Feature of the Application Trade Coverage Reports
- 5. Trade Coverage SKUs Searching Number Key Editable Option in the end Tedious number of steps
- 6. PepsiCo SFA: 5SKUs Old SFA: 6SKUs Current SFA: 3SKUs Comparative analysis of applications
- 7. • The average SKU lines for MM per bill cut is 10-12 • The average different category/ brand per bill cut is 5-7 • Habitual of using the "T9“ key layout (3x3 grid number layout) • Touch area is also less, especially for the DSRs with 5 inches or less display screen. Reasons: 1. Instead of the current virtual keyboard, we can use the phone keyboard. 2. Small popup screen to fill the data like in the old version Potential Solution: • It is less complicated and user friendly • More display areas for SKUs, will help DSRs to find the product a little faster Benefits of Potential Solution: It is possible to present five SKUs on a single display, or something similar, in order to increase the DSRs' productivity by decreasing the exponentially longer search time for the product compared to the old SFA. Current GUI Recommended GUI Recommended Keyboard
- 8. Current GUI Recommend Filters Make it editable here itself it will be very convenient for the DSRs. Current Filters Recommend GUI This will display what that outlet ordered most recently.
- 10. Step 1 Step 2 Step 7 4 Steps: Filtration
- 13. Contribution SKU Lines: Average number of SKU lines per order that are fulfilling the minimum order Qty Bangalore, Mangalore, Mysore Branch BKR BKS CHMST FS GNRLS GRCL GRCS OTH PAAN SAMT SPK SUBDWS-GEN WS-SPE Grand Total Mysore 262 47 283 84 305 49 591 68 16 101 2 80 1888 Banashankari 384 51 1040 850 29 108 1126 46 27 109 57 1 3828 Kammanahalli 887 28 1456 460 31 125 1859 18 43 332 110 3 5352 KudluGate 1093 18 983 959 48 68 1349 29 22 332 1 96 4998 Nagarbhavi 374 49 1279 675 16 100 1164 14 12 146 110 8 3947 Vidyaranyapura 409 36 645 466 6 83 846 28 18 129 41 2707 Madikeri 1 1 2 Mangalore 368 12 231 173 290 106 717 72 4 73 56 2102 Puttur 231 8 56 68 1 39 138 13 8 37 44 643 Udupi 108 2 65 85 8 12 224 18 25 56 2 1 27 633 4116 251 6038 3820 734 690 8014 306 175 1315 5 3 621 12 26100 All calculations are w.r.t Snicker bar during P5 Total Stores Total stores placed order Total Stores Placed Snicker Bar order Order Qty less than 12 % age 26100 7592 969 446 46.02683 South Total Stores Total stores placed order Total Stores Placed Snicker Bar order Order Qty less than 12 % age 98840 52226 17340 8395 48.41407 Bangalore, Mangalore, Mysore Retailers Segmentation Highlighted segmentations are responsible for 70-80% of non-contributing SKUs line
- 14. The Sales Executive(MM) visits between 180 and 200 stores per week. Each store is visited four times per month, so the total number of visits per month is between 700 and 800. In which only 60% are useful( 750X0.6=450). Therefore, if we can increase our efficacy to 75- 80%, we can achieve the same results by visiting 600 stores per month. In a month we have 150 (750-600) unproductive visits by SE(MM) and around ~430 by SE(F4) Reasons behind it: HIGH-CLOSING STOCK AT THE RETAILERS. FEWER SALES AT THE RETAILERS. Problem statement: DSRs and ISRs are currently experiencing ZERO orders and ZERO collections from multiple retailers. CURRENT AVERAGE EFFICIENCY 60-65 % MM Bill cuts 30x0.9x0.7=19 Efficiency 19/0.3= 63.3% Total Time spent (19x15)/60= 4.75hrs Assumptions: 1. 90% of Stores open 2. 70% Gives Order 3. Average time spent 15-20 mins 4. 30 Stores visited F4/F2 Bill cuts 50x0.9x0.6=27 Efficiency 27/0.5= 54% Total Time spent (17x15)/60= 4.25hrs Assumptions: 1. 90% of Stores open 2. 60% Gives Order 3. Average time spent 5-8 mins 4. 30-50 Stores visited
- 15. MYSORE CHENNAI COIMBATORE MADURAI KARNATAKA KERALA
- 16. Start Cluster Visited =2 Last Visit = yesterday Calculating Clusters Score C1 > C2 C1 > C3 C2 > C3 Cluster 1 Cluster 3 Cluster 2 Store Checklist Last Visit > 14 days Order Frequency >2 Order Value based Ranking( Starts with 3) Clusters with outlet information Sorting of outlets basked on Ranking Top 40 outlets Based on the attendance location calculate nearest outlet and use route name to segregate outlets into 2 clusters Rank wise Trade Coverage End Yes Yes Yes Yes Yes No Yes No No No No Leave No No No Rank 2 Yes Rank 1 Flow Chart for Dynamic Route/Beats Allocation
- 17. MYSORE 1 2 3 Clusters Score Calculating Parameters 1. Maximum TOP outlets 2. Average Ordering Frequency (Cumulative of all periods) 3. Average Ordering value per store (Cumulative of all periods) OF1 OF2 OF3 OF4 Outlets 43.86% 32.91% 16.23% 7.00% OF2 Outlet Current Billcuts in Yr per Outlets Billcuts Potential Minimum bill cut amount Potential increase in Revenue 31930 21 27 300 57474000 OF2 Outlet Current Billcuts in Yr per Outlets Billcuts Potential Minimum bill cut amount Potential increase in Revenue 24253 21 27 300 43655400 Considering 32.9% of outlets as OF2 Considering 25% of outlets as OF2
- 18. How to Achieve Dynamic Routing DATA COMPILATION OF ALL SE- COVERED RETAILERS DIVIDE THEM INTO TINY CLUSTERS BASED ON A VARIETY OF CONSTRAINTS. E.G. AREA, TYPE OF STORE, BILLING AMOUNT, ETC. ANOTHER CONSTRAINT SUCH AS A RETAILER PRIORITY LIST, BASED ON THE FREQUENCY OF ORDERS. IDENTIFYING THE TREND OF EACH RETAILER'S ORDERING AND PAYMENT FREQUENCY USING THE TREND AND OTHER CONSTRAINTS, DETERMINE THE OPTIMAL ROUTE AND RETAILERS TO VISIT ON A GIVEN DAY. EFFICIENCY ACHIEVED
- 19. Data Requirement Report of Weekly Route covered by each SE Coordinates of the outlets on these routes Order report of each retailer. Sales order report of retailer.
- 20. Things to be worked upon 1. Training 2. Overall effect of dynamic route allocation 3.