Download to read offline

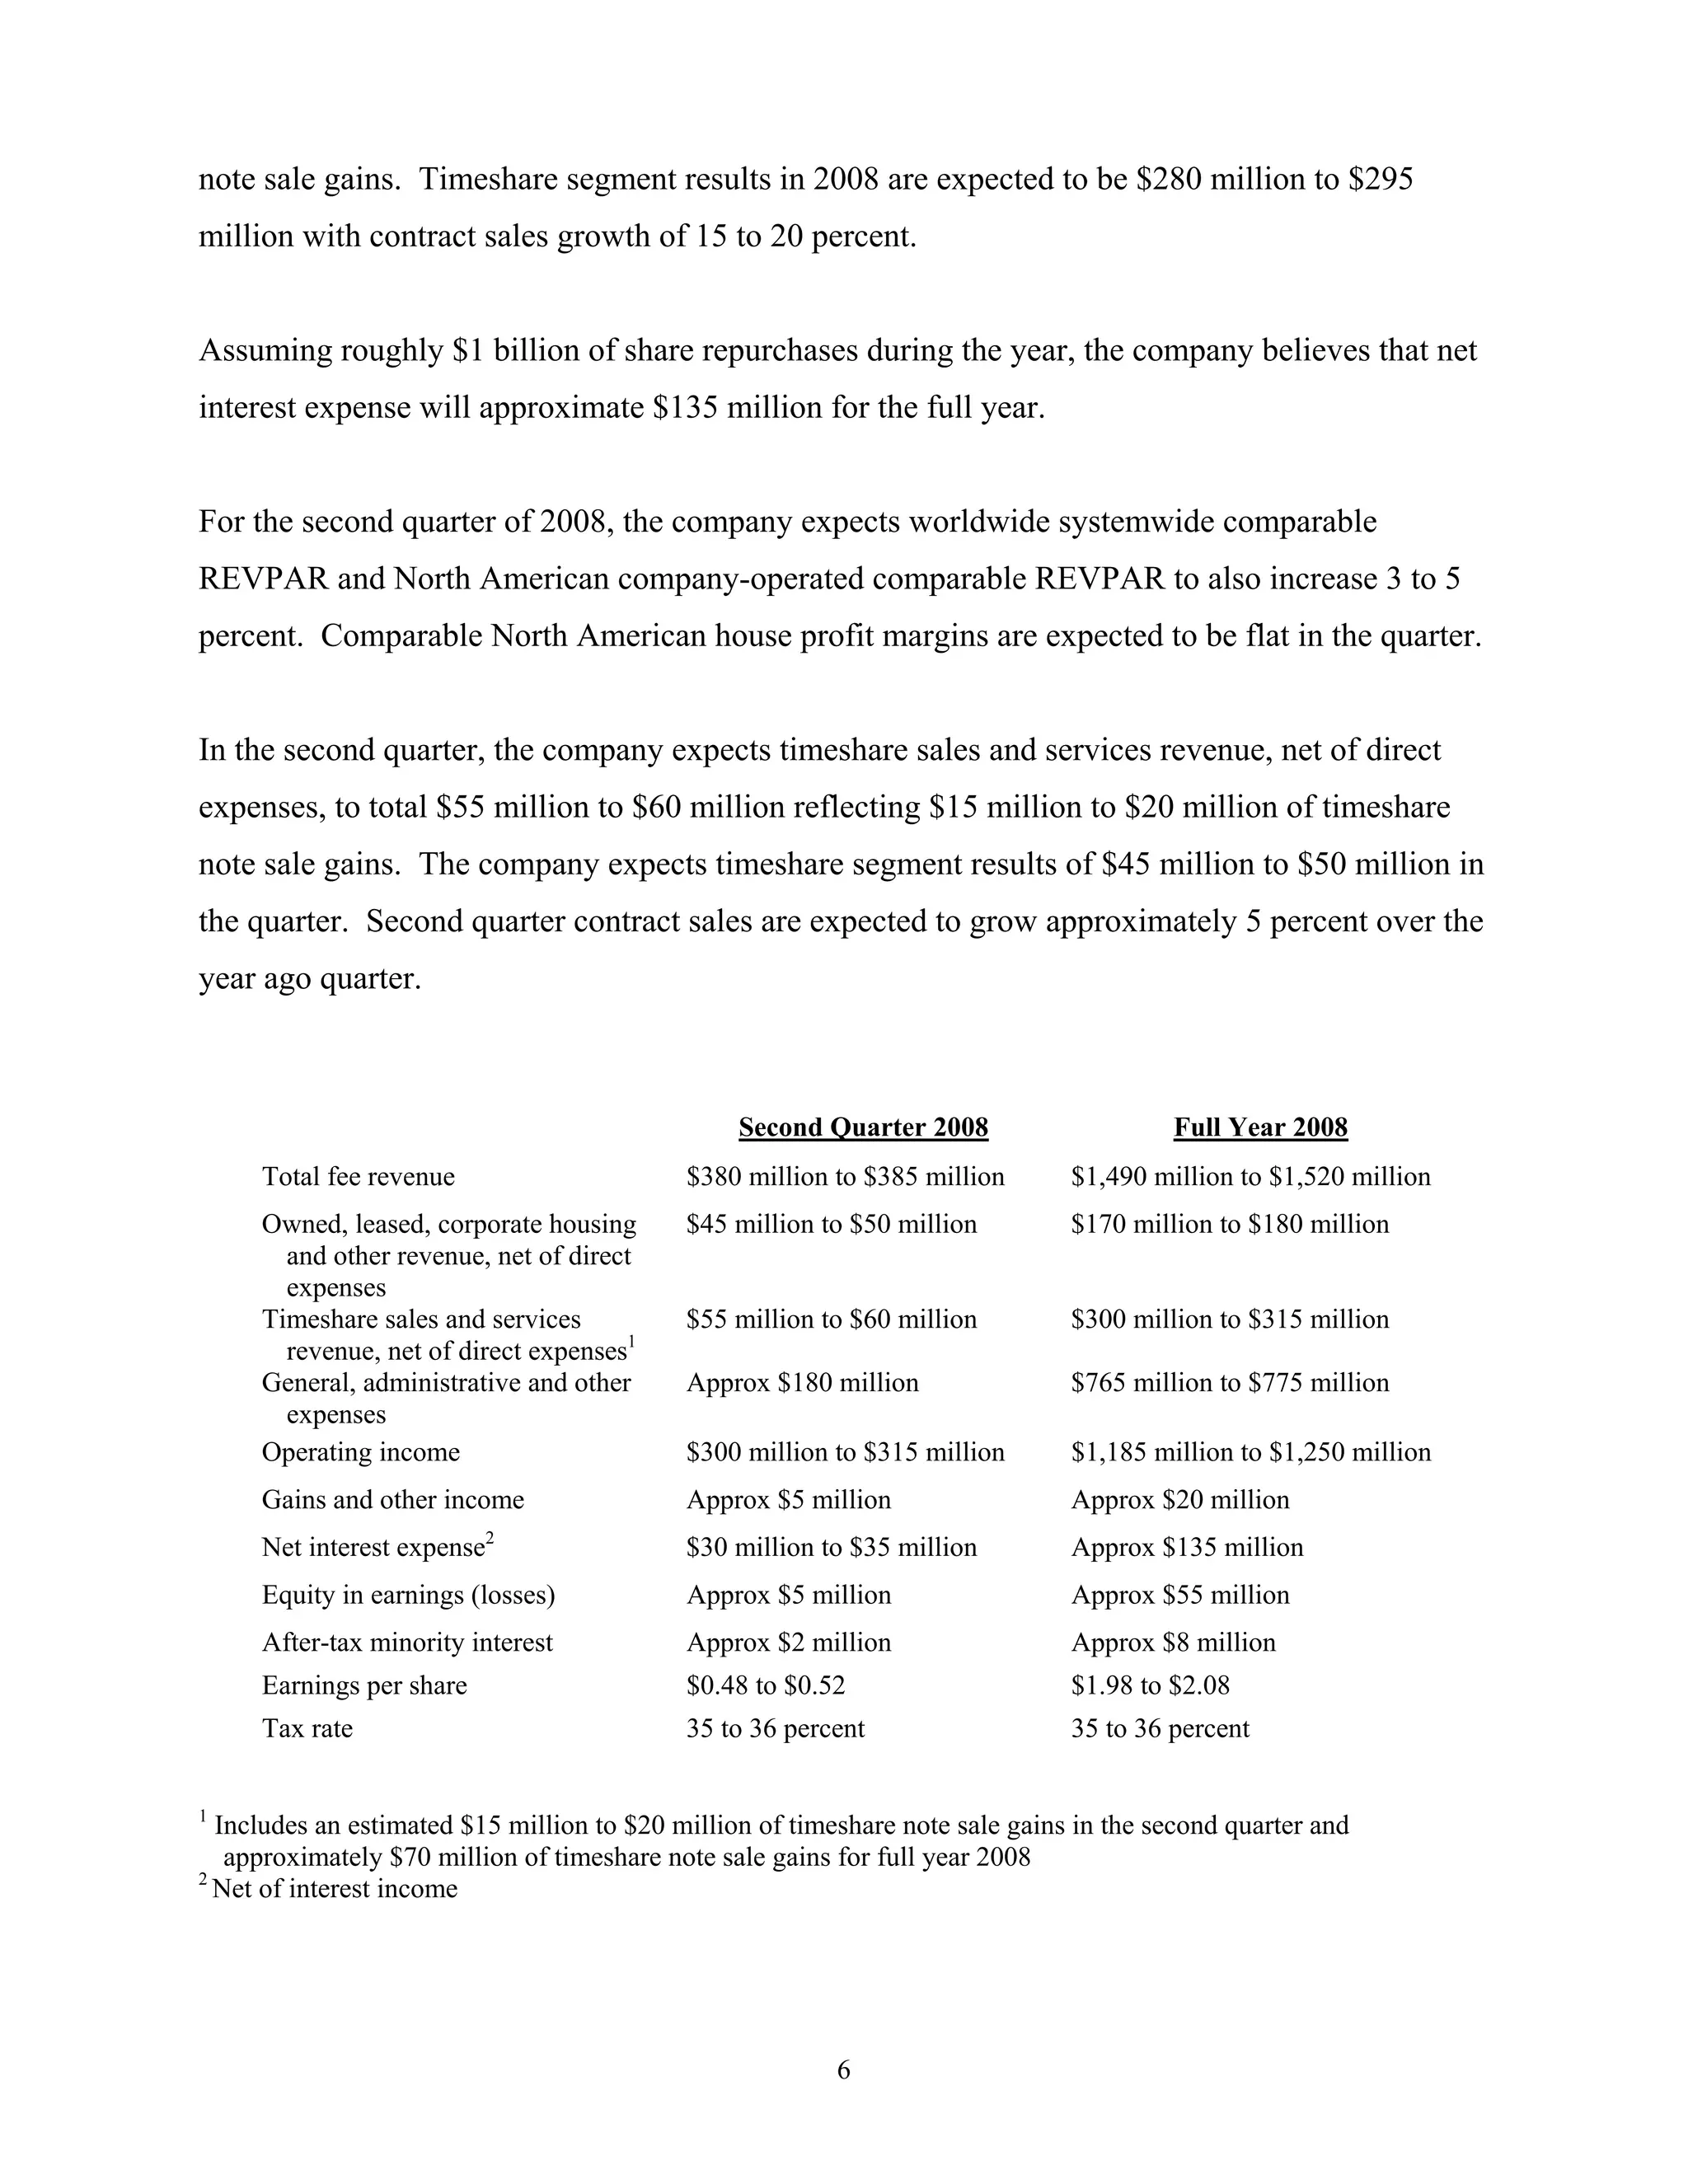

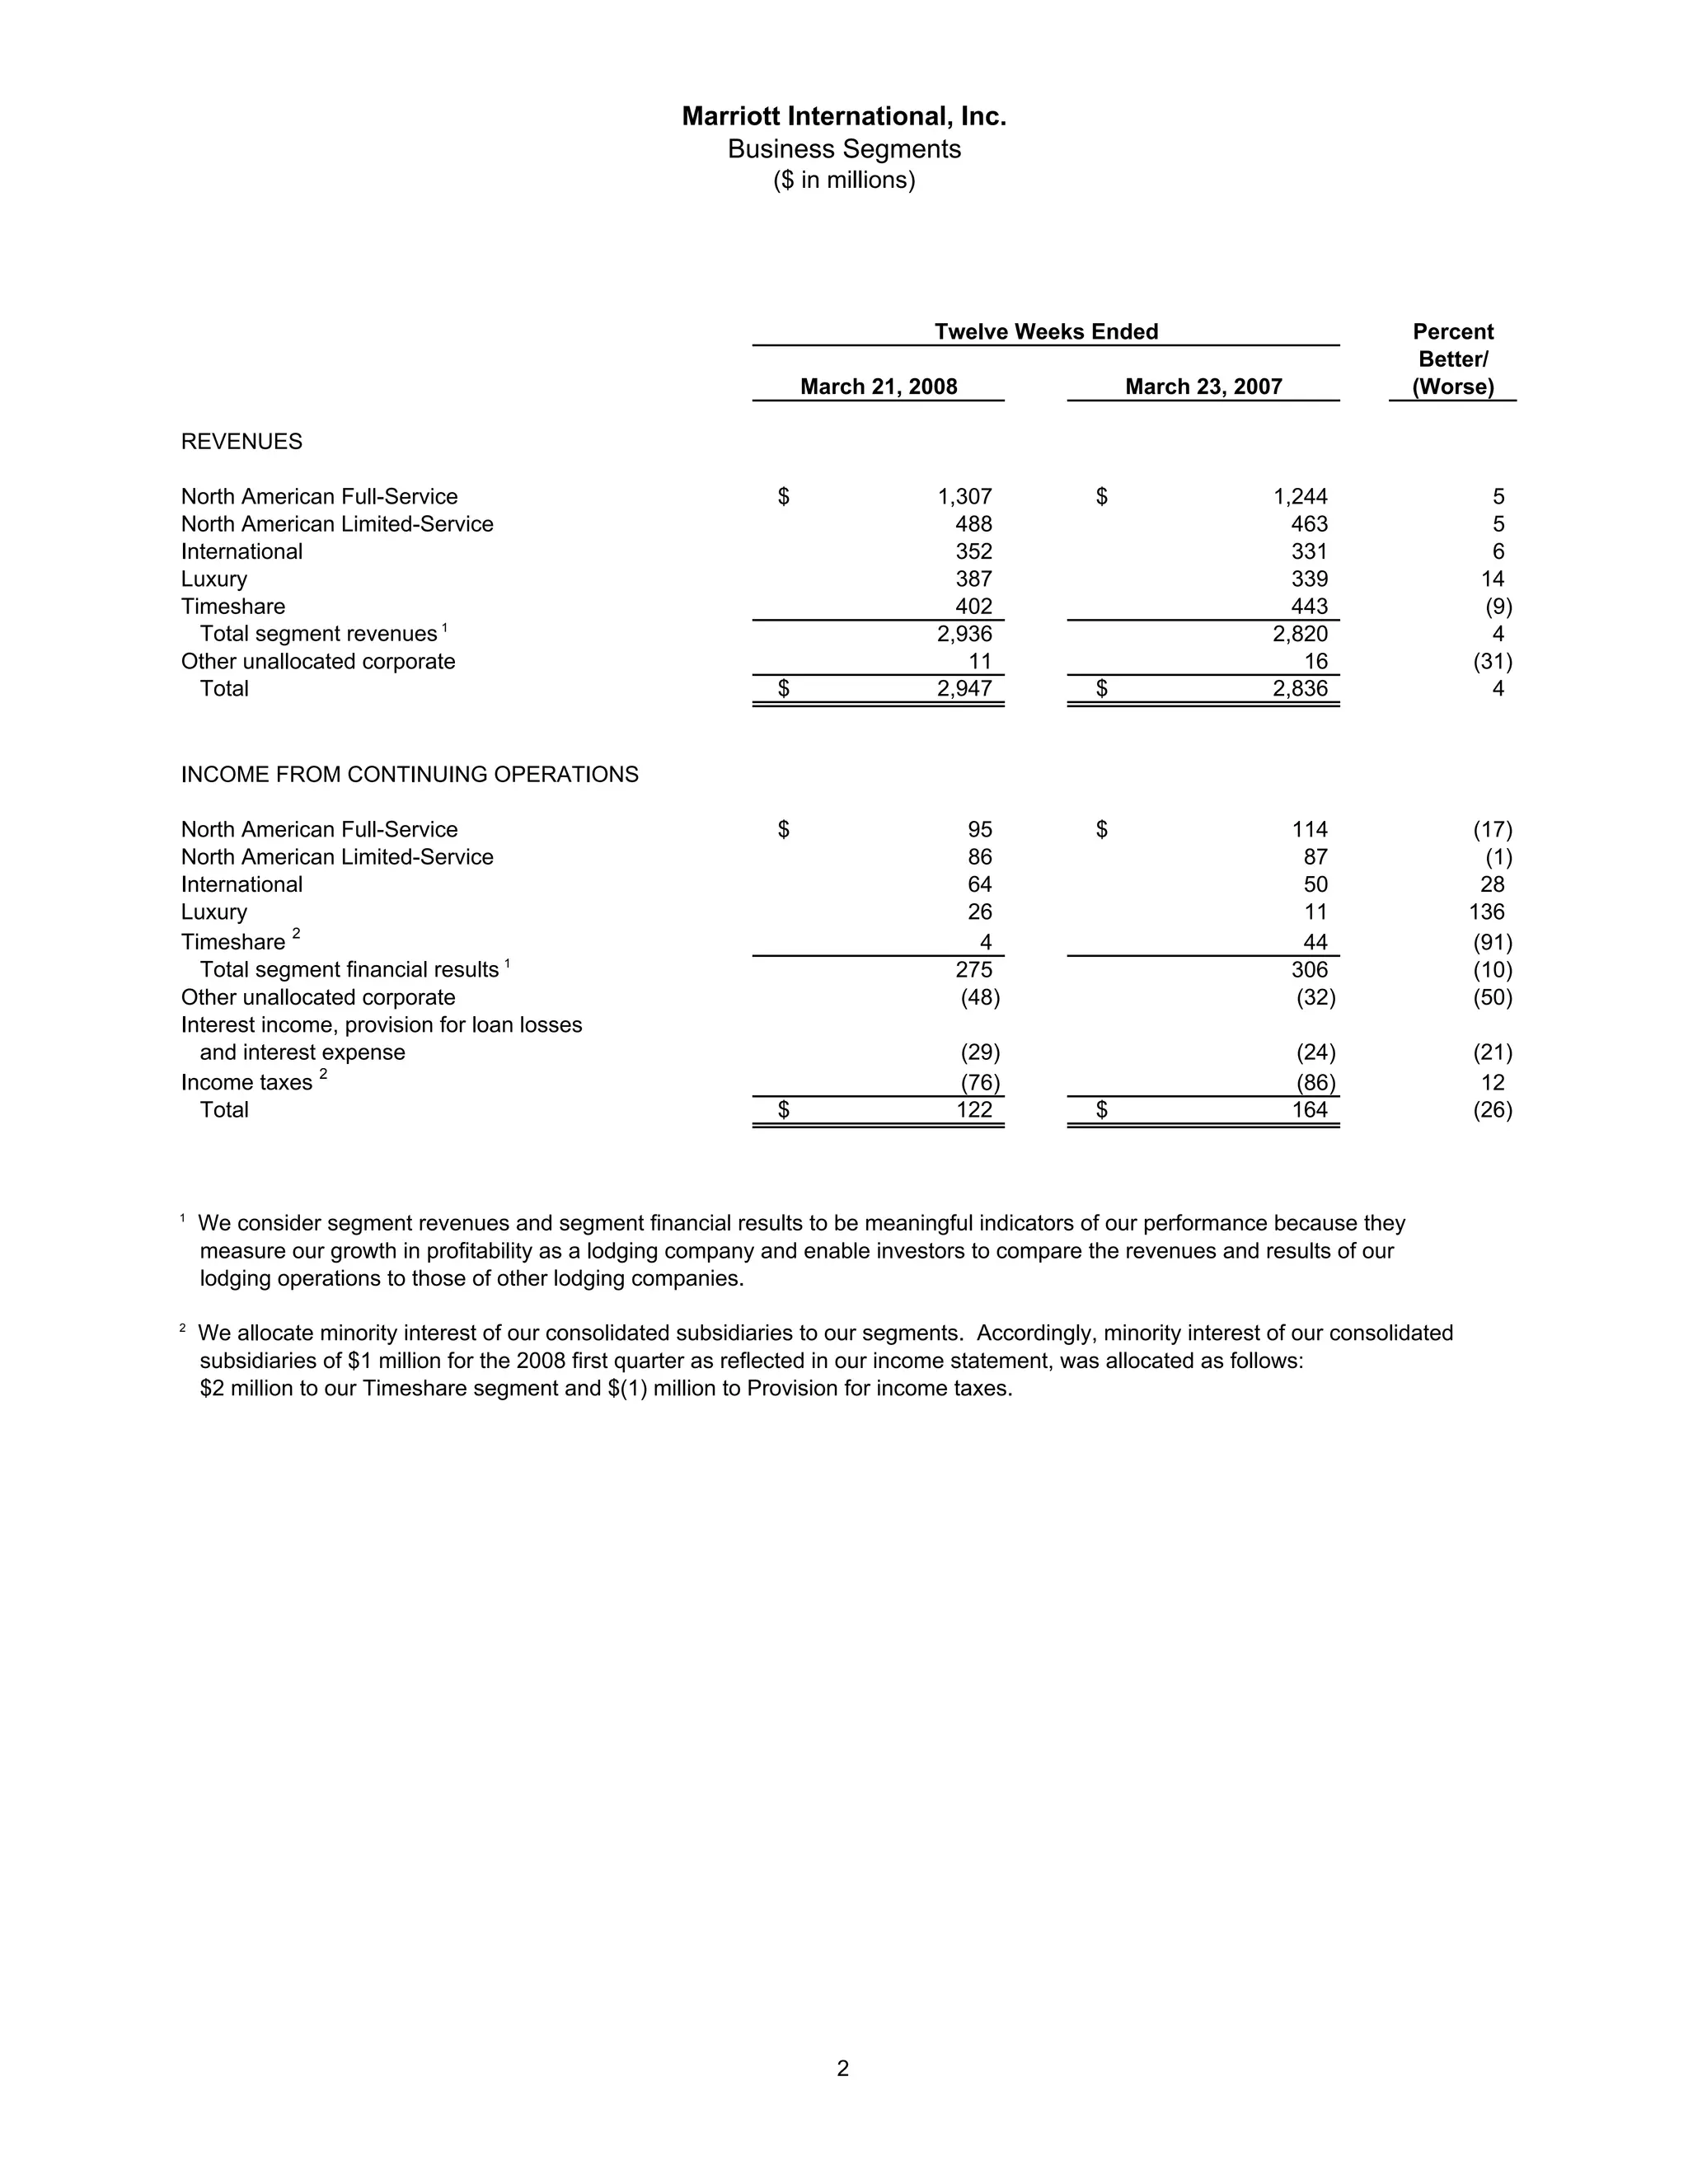
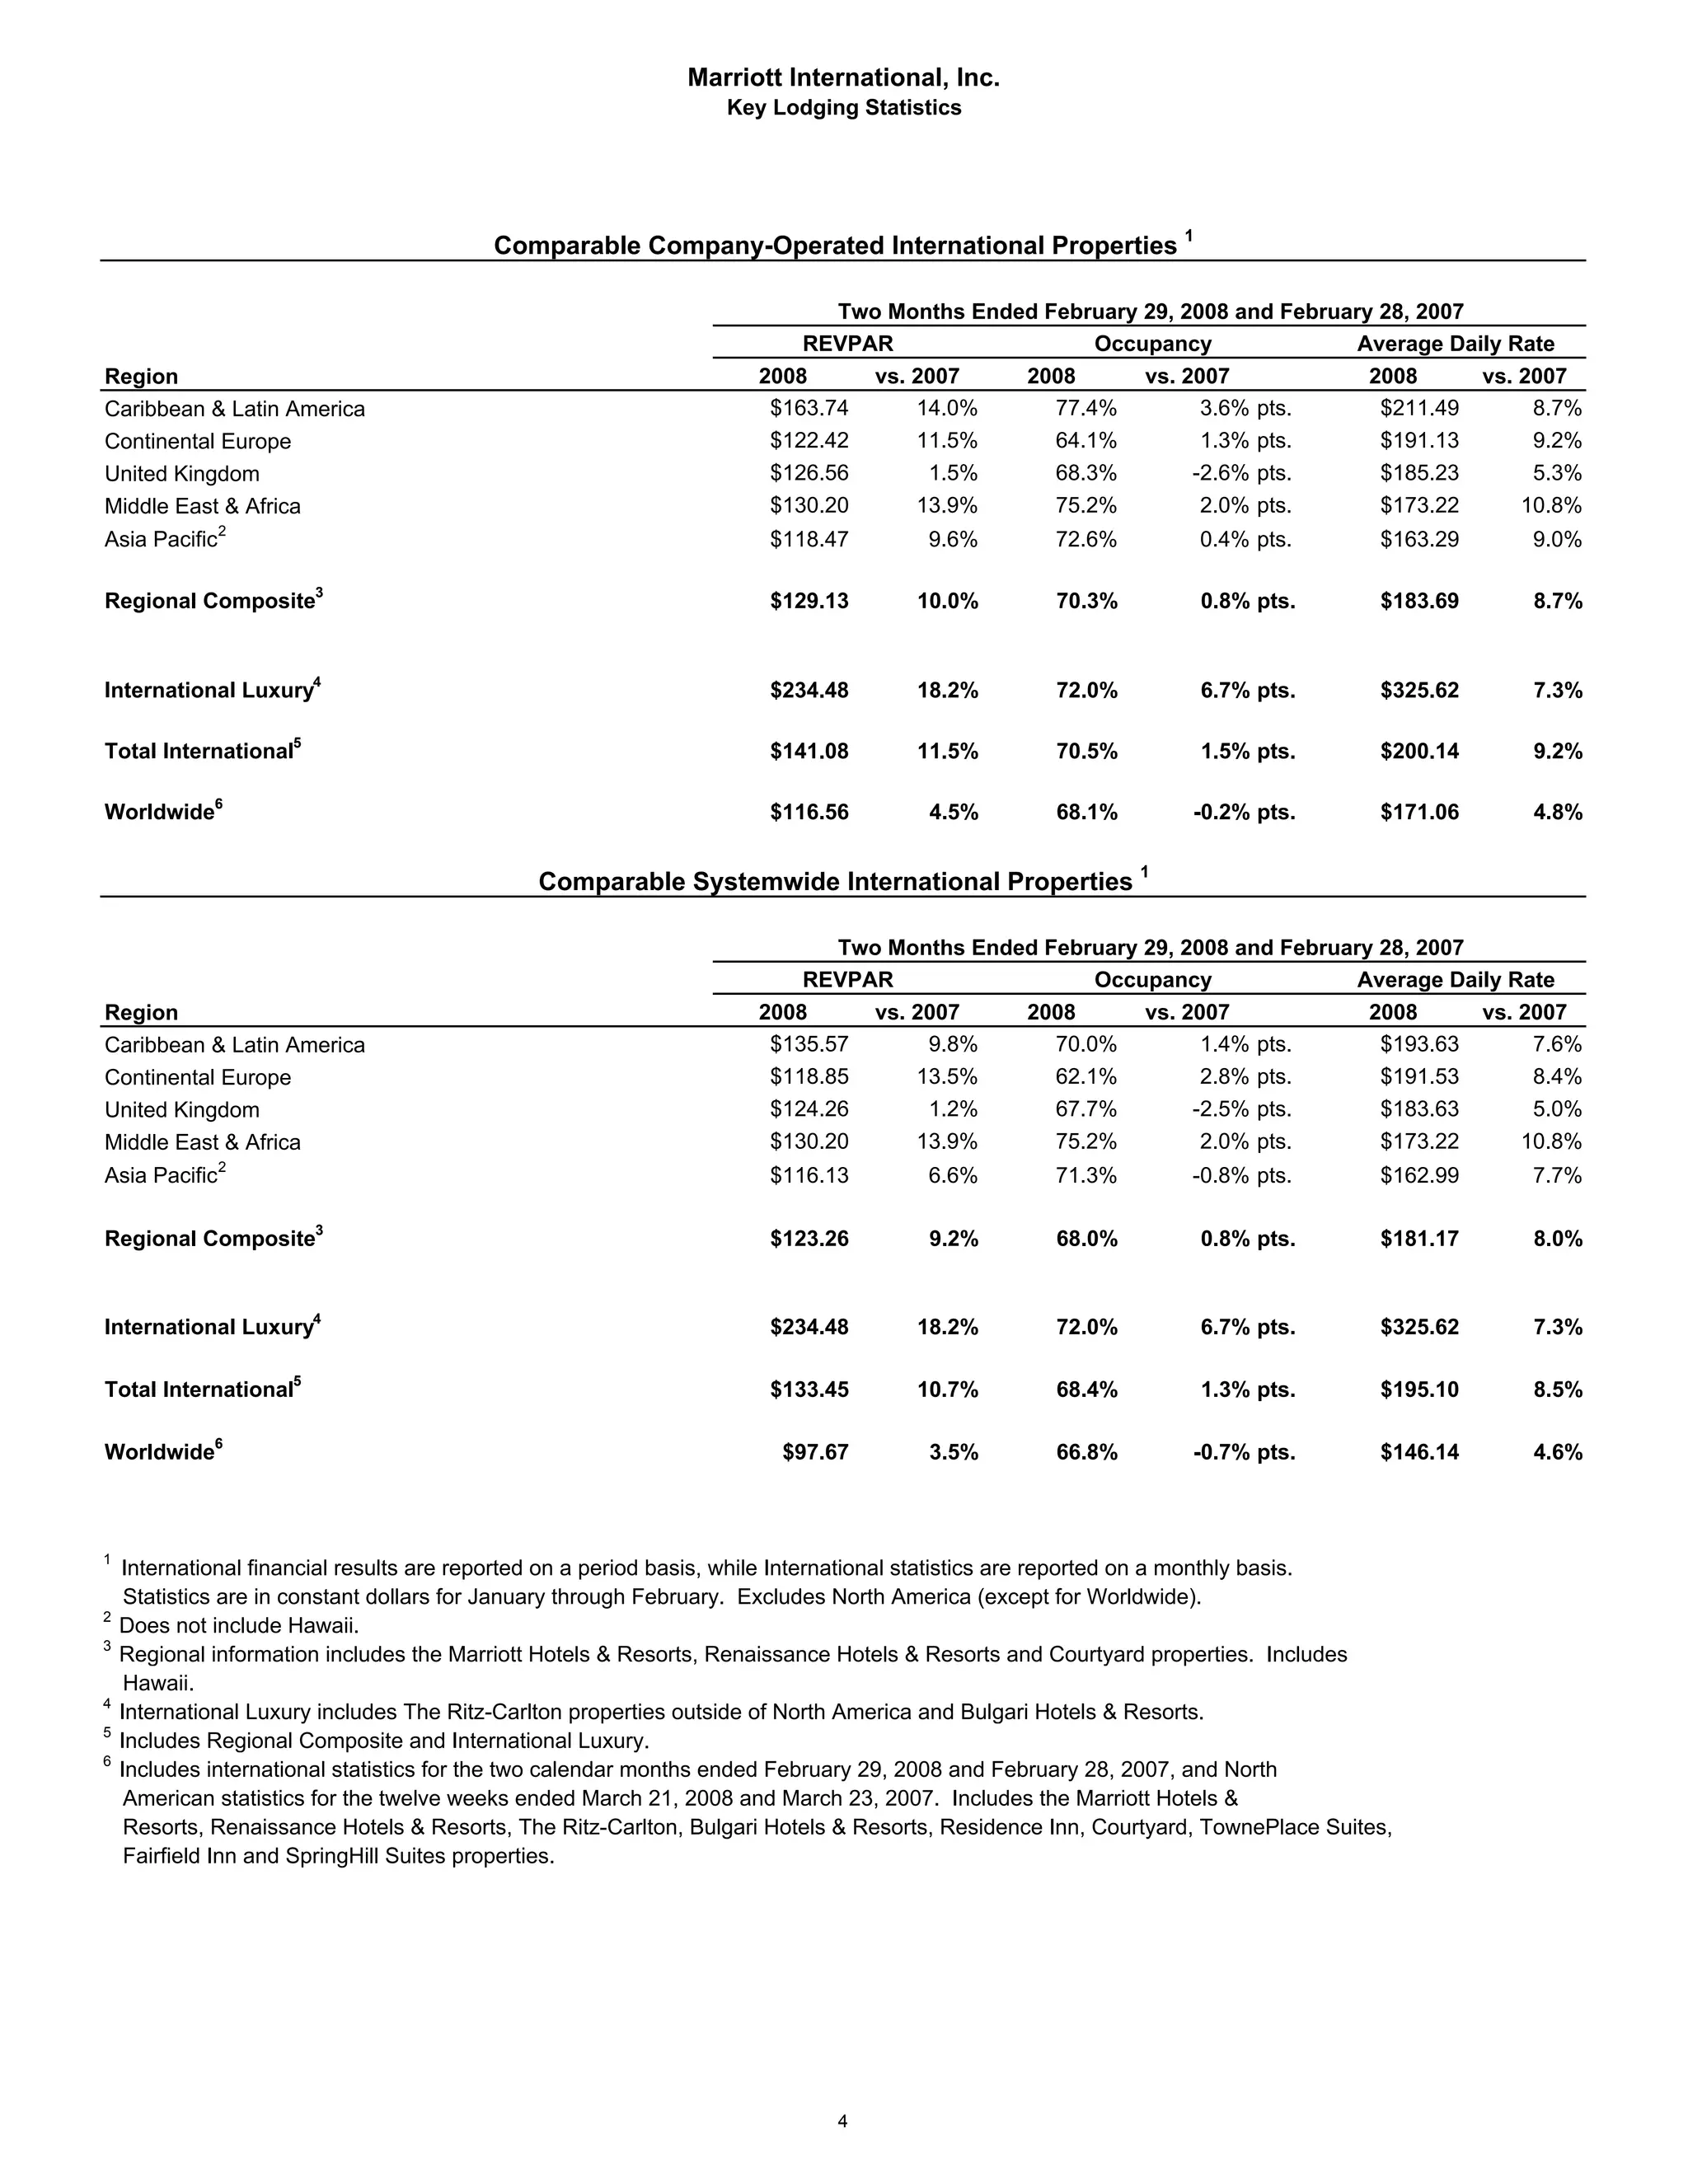
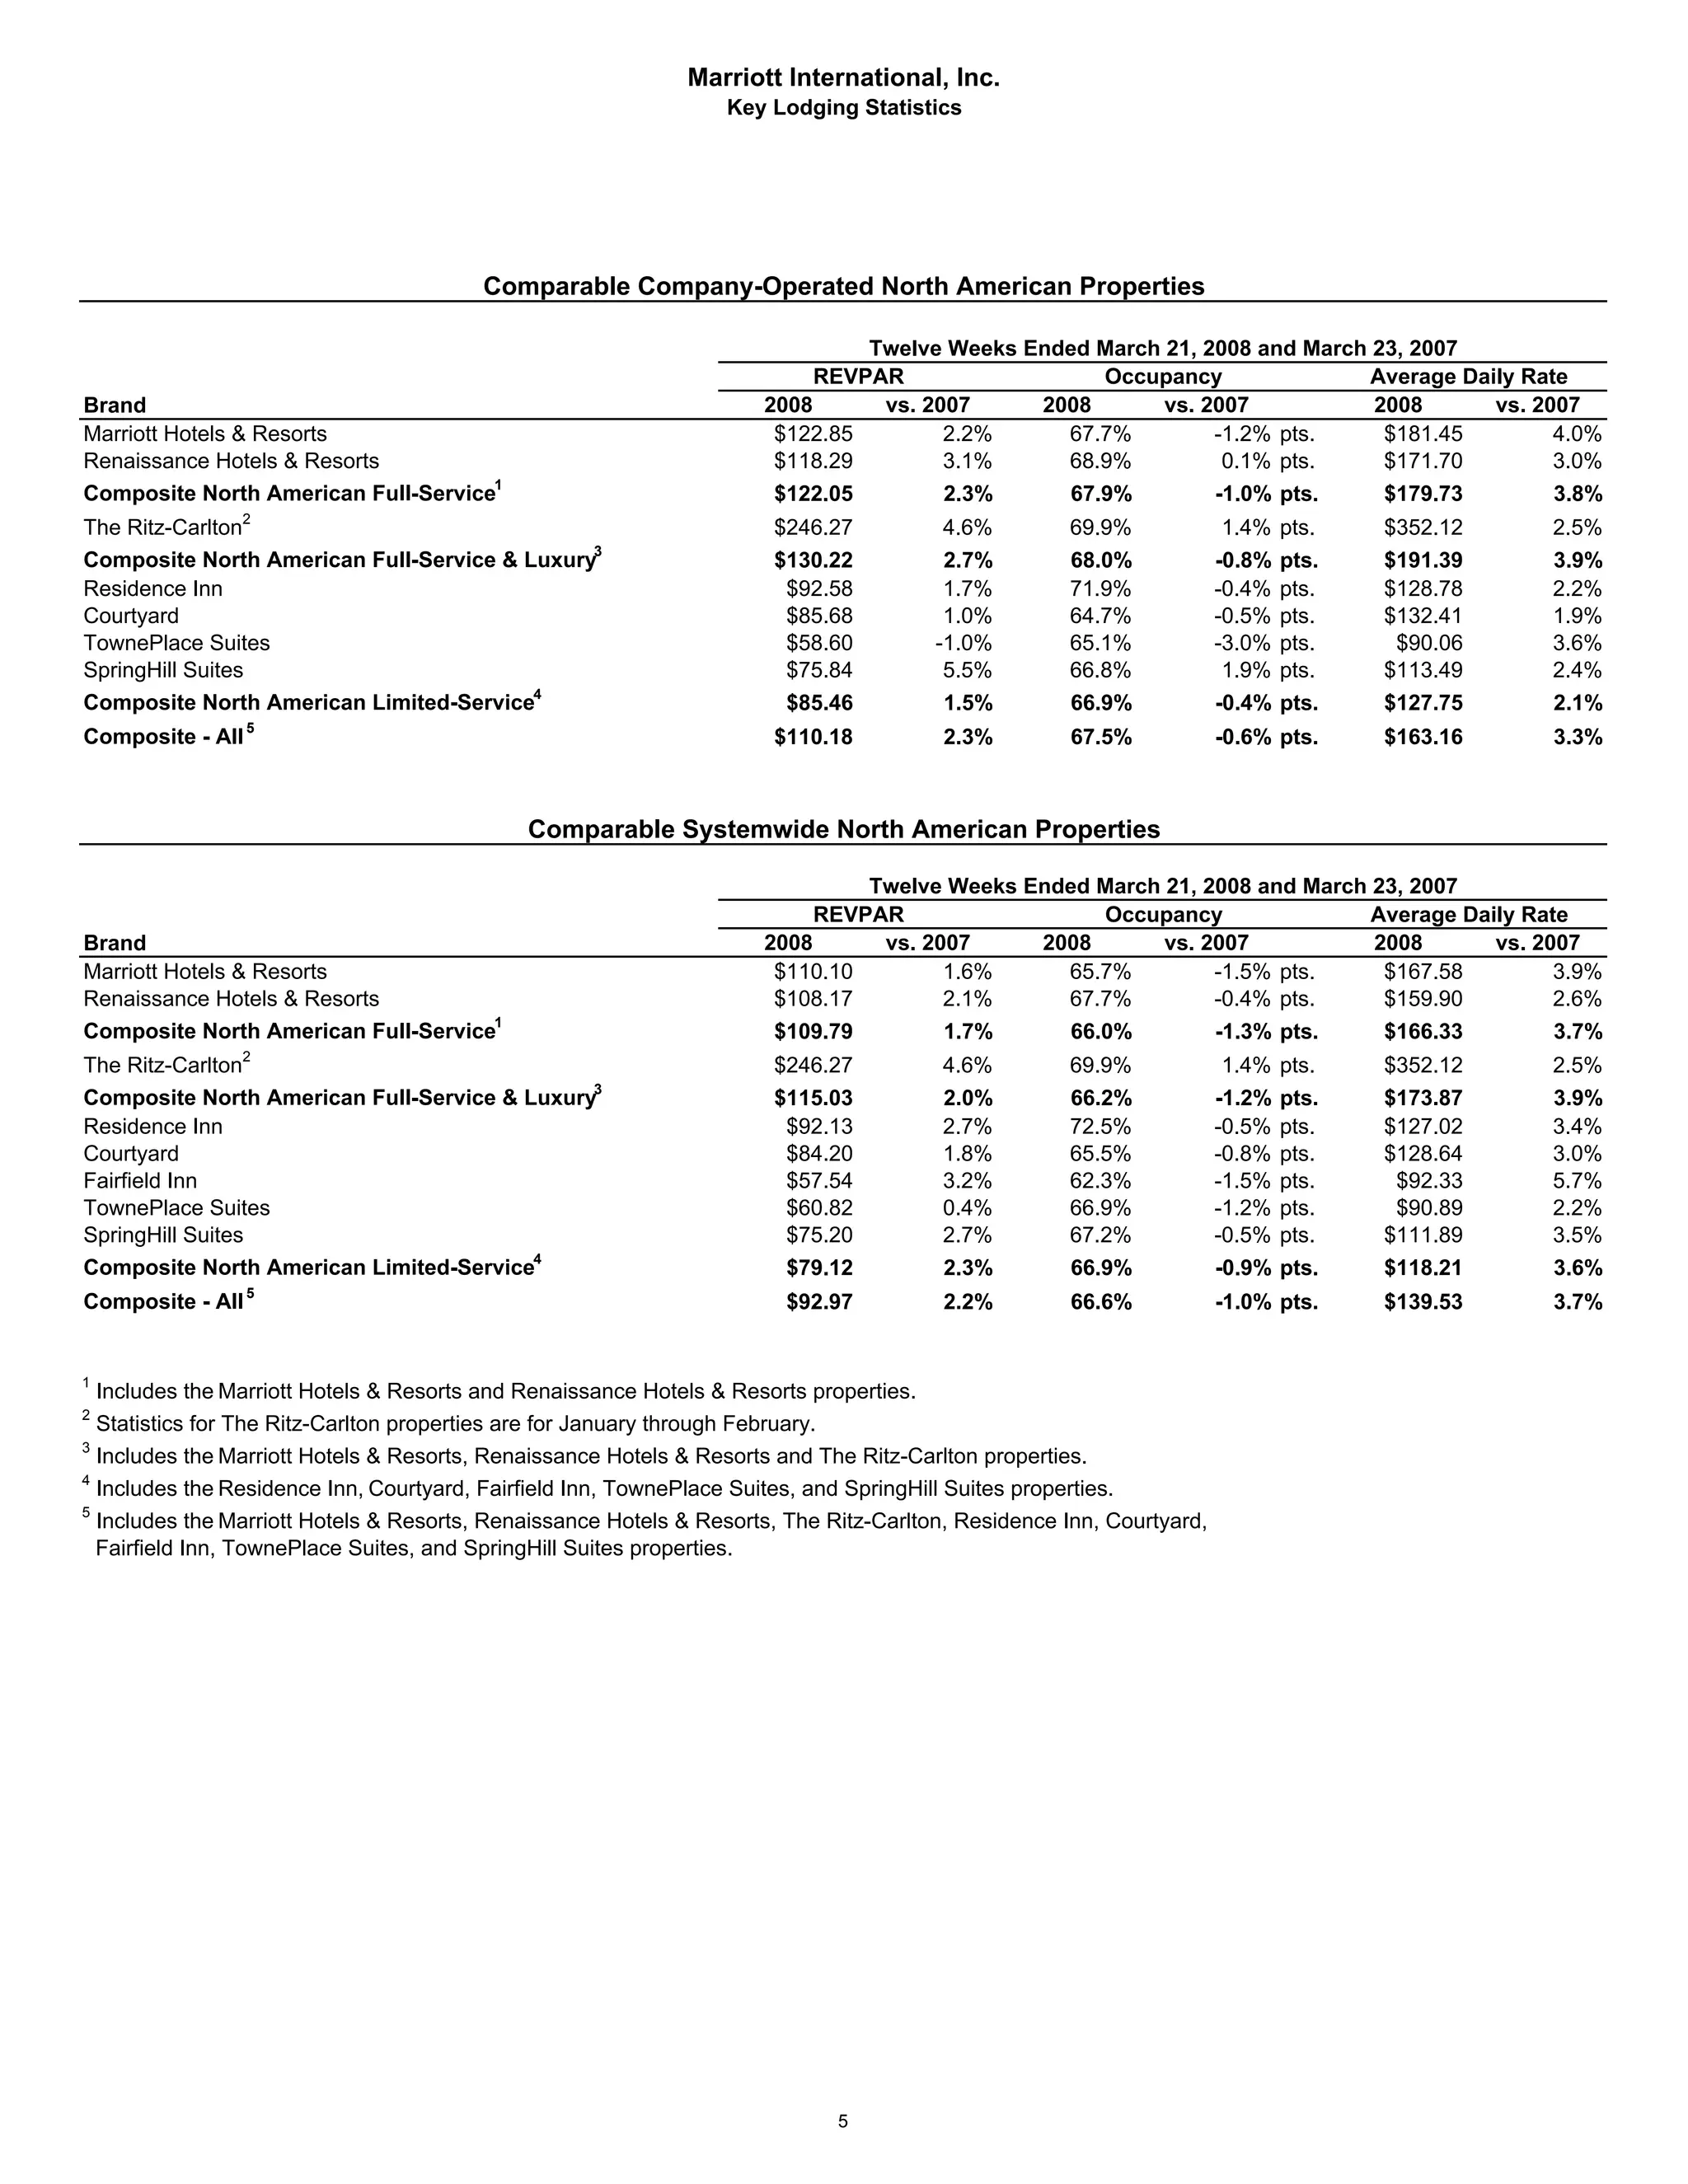
Marriott International reported its first quarter 2008 results. Key highlights included a 6% increase in worldwide revenue per available room and an 18.5% increase outside North America. Total fee revenue rose 7% and the hotel development pipeline increased to a record 130,000 rooms. Earnings per share were $0.33, down 18% from the prior year. For the full year 2008, Marriott expects worldwide revenue per available room to increase 3-5% and earnings per share between $1.98-$2.08.


