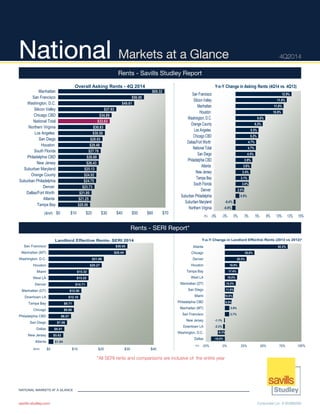
This document provides an overview of national office market metrics for the 4th quarter of 2014. Some key findings include:
- Manhattan had the highest average asking rent of $69.32/sf, followed by San Francisco at $56/sf.
- San Francisco and Silicon Valley saw the largest year-over-year increases in asking rents at 12.9% and 11.8% respectively.
- In terms of construction pipelines, Silicon Valley had the highest pre-leased rate at 89.2%, while Los Angeles had the lowest at 29.5%.
- Washington D.C. saw the largest year-over-year increase in leasing at 115.9%, while Atlanta saw the largest decline at
Managing Investment Return Experiences and Expectations - Greg Woods and PanelBPAS
Moderator:
Greg Woods
VP, BPAS Fiduciary Services
Panelists:
- Ralph Acampora, Director of Technical Analysis Studies, New York Institute of Finance
- Michael T. DiMarsico, SVP, National Manager, Manager Resource Consulting, Federated
- Harry Rakovski, Director - RIA & Consultant Division Northeast, Prudential Investments Management, LLC
Shift Share and Location Quotients: An Industry Sector AnalysisAndy Carswell
This presentation was given to the Valdosta/Lowndes County, GA Chamber of Commerce in Spring 2012. The presentation tracked industry growth by specific employment sectors and compared them against similar measures from more than a dozen "sister counties" throughout the Southeast U.S.
We released this 3 weeks ago and February's Report will be available soon. This delinquency report is segmented by market and property type. Page 2 contains a 6-month delinquency trend graph for each market.
net lease research report q1 2018 | The Boulder GroupThe Boulder Group
The Boulder Group’s Research Department has released a new research report providing comprehensive numbers and analysis of the 1st quarter activity in the National Net Lease Market.
Annie Williams Real Estate Report Aug-Sept 2016Jon Weaver
The major problem with all automated home estimate sites is they are limited to the data on hand. Typically, that includes only square footage, number of beds and baths, recent sales prices and assessor tax values.
What is not included are location nuances such as is the property on a quiet street or next to a main thoroughfare. Did the owners remove that cheap carpeting and replace it with hardwood floors? Were the appliances replaced with high-end
hardware? Granite countertops or tile?
Partners Trust La Cañada Grand Opening: 2014-2015 California Economic Outlook...Audie Chamberlain
Leslie Appleton-Young, Chief Economist for the CALIFORNIA ASSOCIATION OF REALTORS® (C.A.R.) 2014-2015 California Economic & Market Outlook presentation to kick off Partners Trust La Cañada Grand Opening on November, 20th 2014.
In case you missed our live broadcast of this webinar with STR, catch the presentation to help you prepare your marketing plans for 2015 with a heightened understanding of the trends and market forces impacting hotel occupancy in the year ahead.
Presenter: Brittany Baldwin, Director of Business Development, Destinations with STR
Zillow Sued Over Zestimates - June/July Real Estate ReportAMSI, San Francisco
The Robb Fleischer’s Real Estate Report – Local Market Trends San Francisco includes monthly updates regarding mortgage rates, market statistics, sales momentum, pricing momentum, trends at a glance, foreclosure statistics and more.
Strong Sales & Price Growth in August
The MLS® Home Price Index (HPI) Composite Benchmark for August 2016 was up by 17.2 per cent on a year-over-year basis. Similarly, the average selling price for all home types combined
was up by 17.7 per cent on an annual basis to $710,410. Both the MLS® HPI benchmarks and average prices for low-rise home types were up by double digits percentage-wise.
1. NATIONAL MARKETS AT A GLANCE
Corporate Lic. # 00388260savills-studley.com
National Markets at a Glance 4Q2014
Rents - Savills Studley Report
*All SERI rents and comparisons are inclusive of the entire year
$69.32
$56.00
$49.61
$37.93
$34.89
$33.63
$30.83
$30.50
$28.93
$28.48
$27.78
$26.60
$26.43
$25.13
$24.92
$24.75
$23.73
$21.80
$21.25
$20.86
$0 $10 $20 $30 $40 $50 $60 $70
Manhattan
San Francisco
Washington, D.C.
Silicon Valley
Chicago CBD
National Total
Northern Virginia
Los Angeles
San Diego
Houston
South Florida
Philadelphia CBD
New Jersey
Suburban Maryland
Orange County
Suburban Philadelphia
Denver
Dallas/Fort Worth
Atlanta
Tampa Bay
($/sf)
Overall Asking Rents - 4Q 2014
12.9%
11.8%
11.0%
10.9%
6.8%
6.2%
5.3%
5.2%
4.7%
4.7%
4.5%
3.9%
3.6%
3.4%
3.1%
3.0%
2.0%
0.9%
-0.4%
-0.8%
-5% -3% 0% 3% 5% 8% 10% 13% 15%
San Francisco
Silicon Valley
Manhattan
Houston
Washington, D.C.
Orange County
Los Angeles
Chicago CBD
Dallas/Fort Worth
National Total
San Diego
Philadelphia CBD
Atlanta
New Jersey
Tampa Bay
South Florida
Denver
Suburban Philadelphia
Suburban Maryland
Northern Virginia
Y-o-Y Change in Asking Rents (4Q14 vs. 4Q13)
(%)
$30.05
$29.44
$21.06
$20.27
$15.32
$15.22
$14.71
$12.50
$12.10
$9.71
$9.66
$8.57
$7.06
$6.01
$5.62
$1.84
$0 $10 $20 $30 $40
San Francisco
Manhattan (MT)
Washington, D.C.
Houston
Miami
West LA
Denver
Manhattan (DT)
Downtown LA
Tampa Bay
Chicago
Philadelphia CBD
San Diego
Dallas
New Jersey
Atlanta
($/sf)
Landlord Effective Rents- SERI 2014
82.2%
38.8%
28.5%
18.9%
17.4%
16.0%
14.4%
11.9%
10.6%
8.9%
5.9%
5.7%
-1.1%
-2.3%
-9.3%
-18.0%
-25% 0% 25% 50% 75% 100%
Atlanta
Chicago
Denver
Houston
Tampa Bay
West LA
Manhattan (DT)
San Diego
Miami
Philadelphia CBD
Manhattan (MT)
San Francisco
New Jersey
Downtown LA
Washington, D.C.
Dallas
(%)
Y-o-Y Change in Landlord Effective Rents (2013 vs 2012)*
Rents - SERI Report*
2. NATIONAL MARKETS AT A GLANCE
Corporate Lic. # 00388260savills-studley.com
Building Sales - Cap Rates, Sales Volume, Distress & $/PSF*
$9.20
$7.90
$6.18
$4.23
$3.47
$2.95
$2.83
$2.60
$2.45
$2.43
$2.13
$1.98
$1.94
$1.85
$1.83
$1.82
$1.69
$1.06
$0.73
$0.72
Boston
Los Angeles
Chicago
Washington, D.C.
Dallas/Fort Worth
Silicon Valley
Houston
Atlanta
Northern Virginia
Denver
Seattle
Philadelphia
New Jersey
San Diego
Orange County
Phoenix
Miami
Tampa Bay
Raleigh/Durham
Suburban Maryland
$ Billions
Office Sales Volume - 2014*
$1,318
$979
$928
$819
$816
$804
$389
$356
$321
$320
$316
$309
$291
$249
$246
$240
$235
$186
$159
$15
Chicago
Los Angeles
Northern Virginia
Boston
New Jersey
Atlanta
Orange County
Philadelphia CBD
Manhattan
San Francisco
Dallas/Fort Worth
San Diego
Miami
Houston
Broward County
Seattle
Silicon Valley
Tampa Bay
Denver
Washington, D.C.
$Millions
Value of Distressed Properties
$576
$488
$367
$336
$293
$272
$258
$223
$217
$211
$210
$202
$192
$165
$155
$149
$147
$145
$142
$138
$135
$0 $100 $200 $300 $400 $500 $600
Washington, D.C.
San Francisco
Silicon Valley
Boston
Northern Virginia
Los Angeles
Seattle
San Diego
Chicago
Houston
Orange County
Miami
Philadelphia
Denver
Phoenix
Raleigh/Durham
Tampa Bay
Atlanta
Suburban Maryland
New Jersey
Dallas/Fort Worth
Average Price Per Square Foot - Last Four Quarters*
($)
* Source: Real Capital Analytics
4.4%
5.1%
5.6%
5.7%
5.8%
5.9%
6.0%
6.0%
6.5%
6.7%
6.8%
6.8%
6.8%
6.9%
6.9%
7.0%
7.1%
Manhattan
San Francisco
Silicon Valley
Washington, D.C.
Seattle
Miami
Boston
Los Angeles
Orange County
San Diego
Atlanta
Northern Virginia
Philadelphia
New Jersey
Raleigh/Durham
Chicago
Tampa Bay
(%)
Average Cap Rate - Last Four Quarters
* Manhattan ($21.6 billion), San Francisco ($21.3 billion)
* Manhattan: $716
3. NATIONAL MARKETS AT A GLANCE
Corporate Lic. # 00388260savills-studley.com
Availability & Leasing
-3.2
-2.7
-2.4
-2.0
-1.8
-1.7
-1.5
-1.4
-1.4
-1.3
-1.2
-1.1
-1.0
-0.9
-0.5
0.1
0.5
0.7
0.9
0.9
-3.5 -2.5 -1.5 -0.5 0.5 1.5 2.5
Tampa Bay
San Francisco
San Diego
South Florida
Chicago CBD
Suburban Philadelphia
Manhattan
Silicon Valley
Denver
Atlanta
New Jersey
Los Angeles
National Total
Orange County
Houston
Washington, D.C.
Philadelphia CBD
Northern Virginia
Dallas/Fort Worth
Suburban Maryland
Availability Rate PP Change (Y-O-Y)
8.1%
10.5%
10.8%
14.1%
14.3%
14.6%
15.5%
16.2%
16.9%
17.5%
17.5%
17.8%
17.9%
18.5%
18.7%
18.9%
21.4%
21.7%
21.9%
27.7%
0% 10% 20% 30%
San Francisco
Silicon Valley
Manhattan
Washington, D.C.
Philadelphia CBD
Orange County
Chicago CBD
Denver
National Total
Tampa Bay
San Diego
Houston
Los Angeles
South Florida
Suburban Maryland
Suburban Philadelphia
Atlanta
Dallas/Fort Worth
Northern Virginia
New Jersey
Availability Rate Comparison
(%)
23.5%
20.9%
14.2%
10.9%
6.6%
4.5%
2.5%
1.9%
1.5%
1.0%
-2.9%
-3.1%
-8.4%
-11.4%
-13.0%
-16.2%
-21.2%
-30% -10% 10% 30%
Denver
Silicon Valley
Orange County
San Diego
Houston
Chicago
Los Angeles
Boston
Dallas/Fort Worth
Washington, D.C.
Atlanta
San Francisco
Philadelphia CBD
South Florida
Manhattan
Tampa Bay
Seattle
Y-o-Y Change in Avail. Sublet
(%)
7.8
6.3
6.2
4.7
3.5
3.4
3.4
3.1
3.0
3.0
2.9
2.7
2.7
2.7
1.7
1.5
1.1
1.1
0 4 8
Houston
Manhattan
Dallas/Fort Worth
Atlanta
New Jersey
San Francisco
Boston
Denver
Los Angeles
Orange County
Phoenix
Chicago
Seattle
Silicon Valley
Tampa Bay
San Diego
Philadelphia
Miami/Dade-County
(MSF)
Net Absorption- YTD
52.7%
12.4%
11.1%
4.9%
3.0%
2.0%
-2.1%
-4.8%
-5.3%
-6.9%
-7.9%
-16.7%
-19.5%
-22.7%
-23.7%
-24.7%
-25.8%
-27.8%
-32.3%
-40.7%
-60%-40%-20% 0% 20% 40% 60%
Washington, D.C.
Orange County
Los Angeles
Manhattan
Chicago CBD
San Francisco
South Florida
Tampa Bay
Dallas/Fort Worth
National Total
Houston
Suburban Philadelphia
Suburban Maryland
San Diego
New Jersey
Virginia
Silicon Valley
Denver
Atlanta
Philadelphia
(%)
Leasing in Last 12 Months -
Y-o-Y Change
115.9%
113.5%
113.4%
113.3%
109.8%
107.6%
106.9%
106.3%
100.3%
98.6%
98.1%
90.8%
83.6%
80.0%
79.3%
78.2%
77.9%
74.4%
74.3%
72.8%
0% 30% 60% 90% 120% 150%
Washington, D.C.
San Francisco
Los Angeles
Dallas/Fort Worth
Manhattan
Houston
South Florida
Tampa Bay
Orange County
Chicago CBD
National Total
Philadelphia
Northern Virginia
Atlanta
Denver
San Diego
Suburban Philadelphia
New Jersey
Suburban Maryland
Silicon Valley
Leasing in Last 12 Months as % of
Market's Five-Year Leasing Average
(%)
4. NATIONAL MARKETS AT A GLANCE
Corporate Lic. # 00388260savills-studley.com
Construction Pipeline*
89.2%
84.5%
75.8%
74.0%
73.1%
69.9%
67.1%
65.7%
64.4%
60.3%
59.7%
55.7%
49.6%
40.5%
39.9%
38.5%
29.5%
0% 20% 40% 60% 80% 100%
Silicon Valley
New Jersey
Philadelphia Region
Chicago
Atlanta
Boston
San Francisco
Dallas/Fort Worth
Houston
Phoenix
Raleigh/Durham
Manhattan
Washington, D.C.
Seattle
Denver
San Diego
Los Angeles
(%)
Pre-Leased Rate
6.0%
5.8%
5.9%
5.3%
5.1%
5.6%
6.3%
5.8%
6.0%
6.3%
7.0%
6.9%
6.7%
6.3%
8.7%
7.2%
7.5%
7.3%
7.1%
9.2%
3.8%
4.6%
4.6%
4.6%
4.6%
4.6%
4.9%
4.9%
4.9%
5.1%
5.4%
5.6%
5.6%
5.7%
6.1%
6.2%
6.4%
6.7%
6.7%
7.9%
0% 3% 5% 8% 10%
Denver
Houston
Dallas/Fort Worth
Seattle
Washington, D.C.
Raleigh
Boston
Orange County
San Francisco
Silicon Valley
Philadelphia
San Diego
U.S.
Tampa Bay
Chicago
New Jersey
Manhattan City
Miami
Atlanta
Los Angeles
(%)
Unemployment Rate
Year-End
2013
Year-End
2014
4.7%
5.3%
2.2%
4.6%
0.5%
1.8%
4.3%
4.3%
3.0%
2.9%
2.4%
1.7%
2.2%
2.8%
1.6%
0.6%
3.4%
0.3%
1.9%
-0.1%
-0.6%
7.6%
7.5%
6.1%
5.7%
5.1%
4.1%
4.1%
3.5%
3.2%
3.2%
3.0%
2.6%
2.5%
2.3%
2.3%
2.3%
2.1%
1.5%
1.3%
1.1%
0.3%
-2% -1% 0% 1% 2% 3% 4% 5% 6% 7% 8%
Silicon Valley
Raleigh/Durham
Dallas/Fort Worth
San Francisco
San Diego
Houston
Phoenix
South Florida
Atlanta
Seattle
U.S.
Los Angeles
Boston
Denver
Manhattan
Orange County
Tampa Bay
Philadelphia
Chicago
New Jersey
Washington, D.C.
Change in Office-Using Employment (December 2014 - December 2013)
2013 2014
(%)
17.9
7.8
7.6
6.9
6.1
6.1
6.0
5.8
5.6
3.0
2.9
2.9
2.7
2.0
1.9
1.1
0.0 3.0 6.0 9.0 12.0 15.0 18.0
Houston
Dallas/Fort Worth
Silicon Valley
Washington, D.C.
Manhattan
Chicago
Seattle
Boston
San Francisco
Philadelphia Region
Denver
Phoenix
Los Angeles
Raleigh/Durham
Atlanta
New Jersey
(MSF)
Under Construction
*Source: CoStar. Includes all actively marketed properties that have commenced work on building foundation
Employment Data*
*Source: Bureau Labor Statistics
5. NATIONAL MARKETS AT A GLANCE
Corporate Lic. # 00388260savills-studley.com
Projected Annual Growth Rates (2011-2015)*
6.9%
6.8%
6.7%
4.6%
4.5%
4.4%
4.3%
3.8%
3.3%
3.0%
3.0%
2.9%
2.6%
2.5%
2.1%
1.9%
1.1%
0% 2% 4% 6% 8%
Chicago
Tampa Bay
Atlanta
San Francisco
Silicon Valley
San Diego
Philadelphia
Average
Miami
New Jersey
Los Angeles
Houston
Manhattan
Orange County
Dallas
Denver
Washington DC
Existing Home Prices
(%)
3.1%
3.1%
2.8%
2.6%
2.6%
2.5%
2.5%
2.3%
2.3%
2.2%
2.2%
2.0%
1.9%
1.9%
1.7%
1.6%
1.5%
0.0% 1.0% 2.0% 3.0% 4.0%
Houston
Dallas
San Francisco
Silicon Valley
Atlanta
San Diego
Orange County
Los Angeles
Average
Denver
Manhattan
Philadelphia
Tampa Bay
New Jersey
Chicago
Washington DC
Miami
Overall Employment
(%)
5.1%
5.1%
5.1%
5.0%
4.3%
4.2%
4.2%
4.1%
4.0%
3.9%
3.9%
3.4%
3.1%
3.0%
2.9%
2.7%
2.5%
0% 1% 2% 3% 4% 5% 6%
San Francisco
Dallas
Houston
Silicon Valley
Atlanta
Manhattan
Los Angeles
Denver
San Diego
Average
Orange County
Chicago
New Jersey
Washington DC
Tampa Bay
Miami
Philadelphia
Metro Gross City Product
(%)
2.1%
2.0%
1.7%
1.5%
1.3%
1.2%
1.2%
1.1%
1.0%
1.0%
1.0%
0.8%
0.8%
0.5%
0.4%
0.3%
0.2%
0.0% 0.5% 1.0% 1.5% 2.0% 2.5%
Dallas
Houston
Atlanta
San Diego
Tampa Bay
Washington DC
Denver
Average
Orange County
Miami
Los Angeles
Silicon Valley
San Francisco
Chicago
New Jersey
Philadelphia
Manhattan
Population
(%)
*Source: Moody’s Economy.com Data
Projected Annual Growth Rates (2011-2015)*