Download to read offline


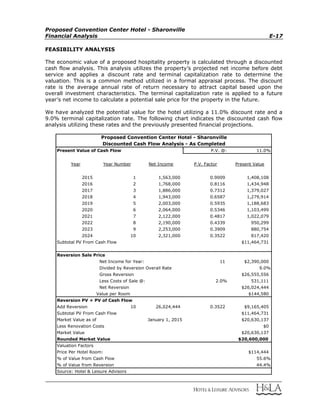


The report analyzes the feasibility of developing a 180-room select-service hotel directly connected to the Sharonville Convention Center in Sharonville, Ohio. Key points include: - The hotel would target the convention center market and benefit from being the only hotel physically attached to the center. - Market analysis shows demand is driven by commercial travelers, group business, and smaller amounts of leisure travel. Occupancy averages 56% annually. - The report forecasts the new hotel capturing 50-60% of convention center and group business, resulting in stabilized occupancy of 58.5% after opening in 2015.


