Mapping Visual Perceptions using Google Street View
1. Perceptual Maps: Mapping the visual perception of
travelers in a city using google street view as sensor
Keywords: Psychogeography, computer vision, Art, Flaneur/Baudelaire
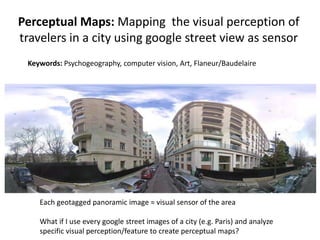
Each geotagged panoramic image = visual sensor of the area
What if I use every google street images of a city (e.g. Paris) and analyze
specific visual perception/feature to create perceptual maps?
2. Example: Claustrophobia Map - sensing the
“openness” of urban spaces.
Question: Where are the most open spaces in Paris?
how much sky can I perceive if I travel there?
People perception
angle when traveling
3. Mapping the perception
Each colored point on the map
represents the degree of “openness” of
an area (computed for each associated
google street view image)
Dark area = Average openness=
Orange/Red point (yellow point)
6. Level of green perception in
the network of Paris
(Perceptual GPS: I want a “green” travel,
guide me using such a map!)
7. unachieved personal research project
TODO
• Exploring other visual features (e.g. mapping the
“colourfulness” of an area), detecting specific textures (e.g.
mapping architectural styles in a city)
• Perceptual GPS: programming travels in a city according to visual
perceptions (see also “random GPS” /“serendipity in a physical
network” project)
---
- What is the goal of such kind of maps?”
- just the pleasure to explore new maps: mapping the visual
perception of travelers in a city. (not enough time to explore
fully the concept)
Contact: n.maisonneuve@gmail.com (nicolas maisonneuve)