SEGMENTATION AND
TARGETING
Basics
Market Definition
Segmentation Research
and Methods
Behavior-Based
Segmentation
PROJECT REPORT FINAL REPORT
Presented by:-
NAME OF STUDENT:
ROLL NO:
Batch:
2.
Market Segmentation
Marketsegmentation is the
subdividing of a market into distinct
subsets of customers.
Segments
Members are different between
segments but similar within.
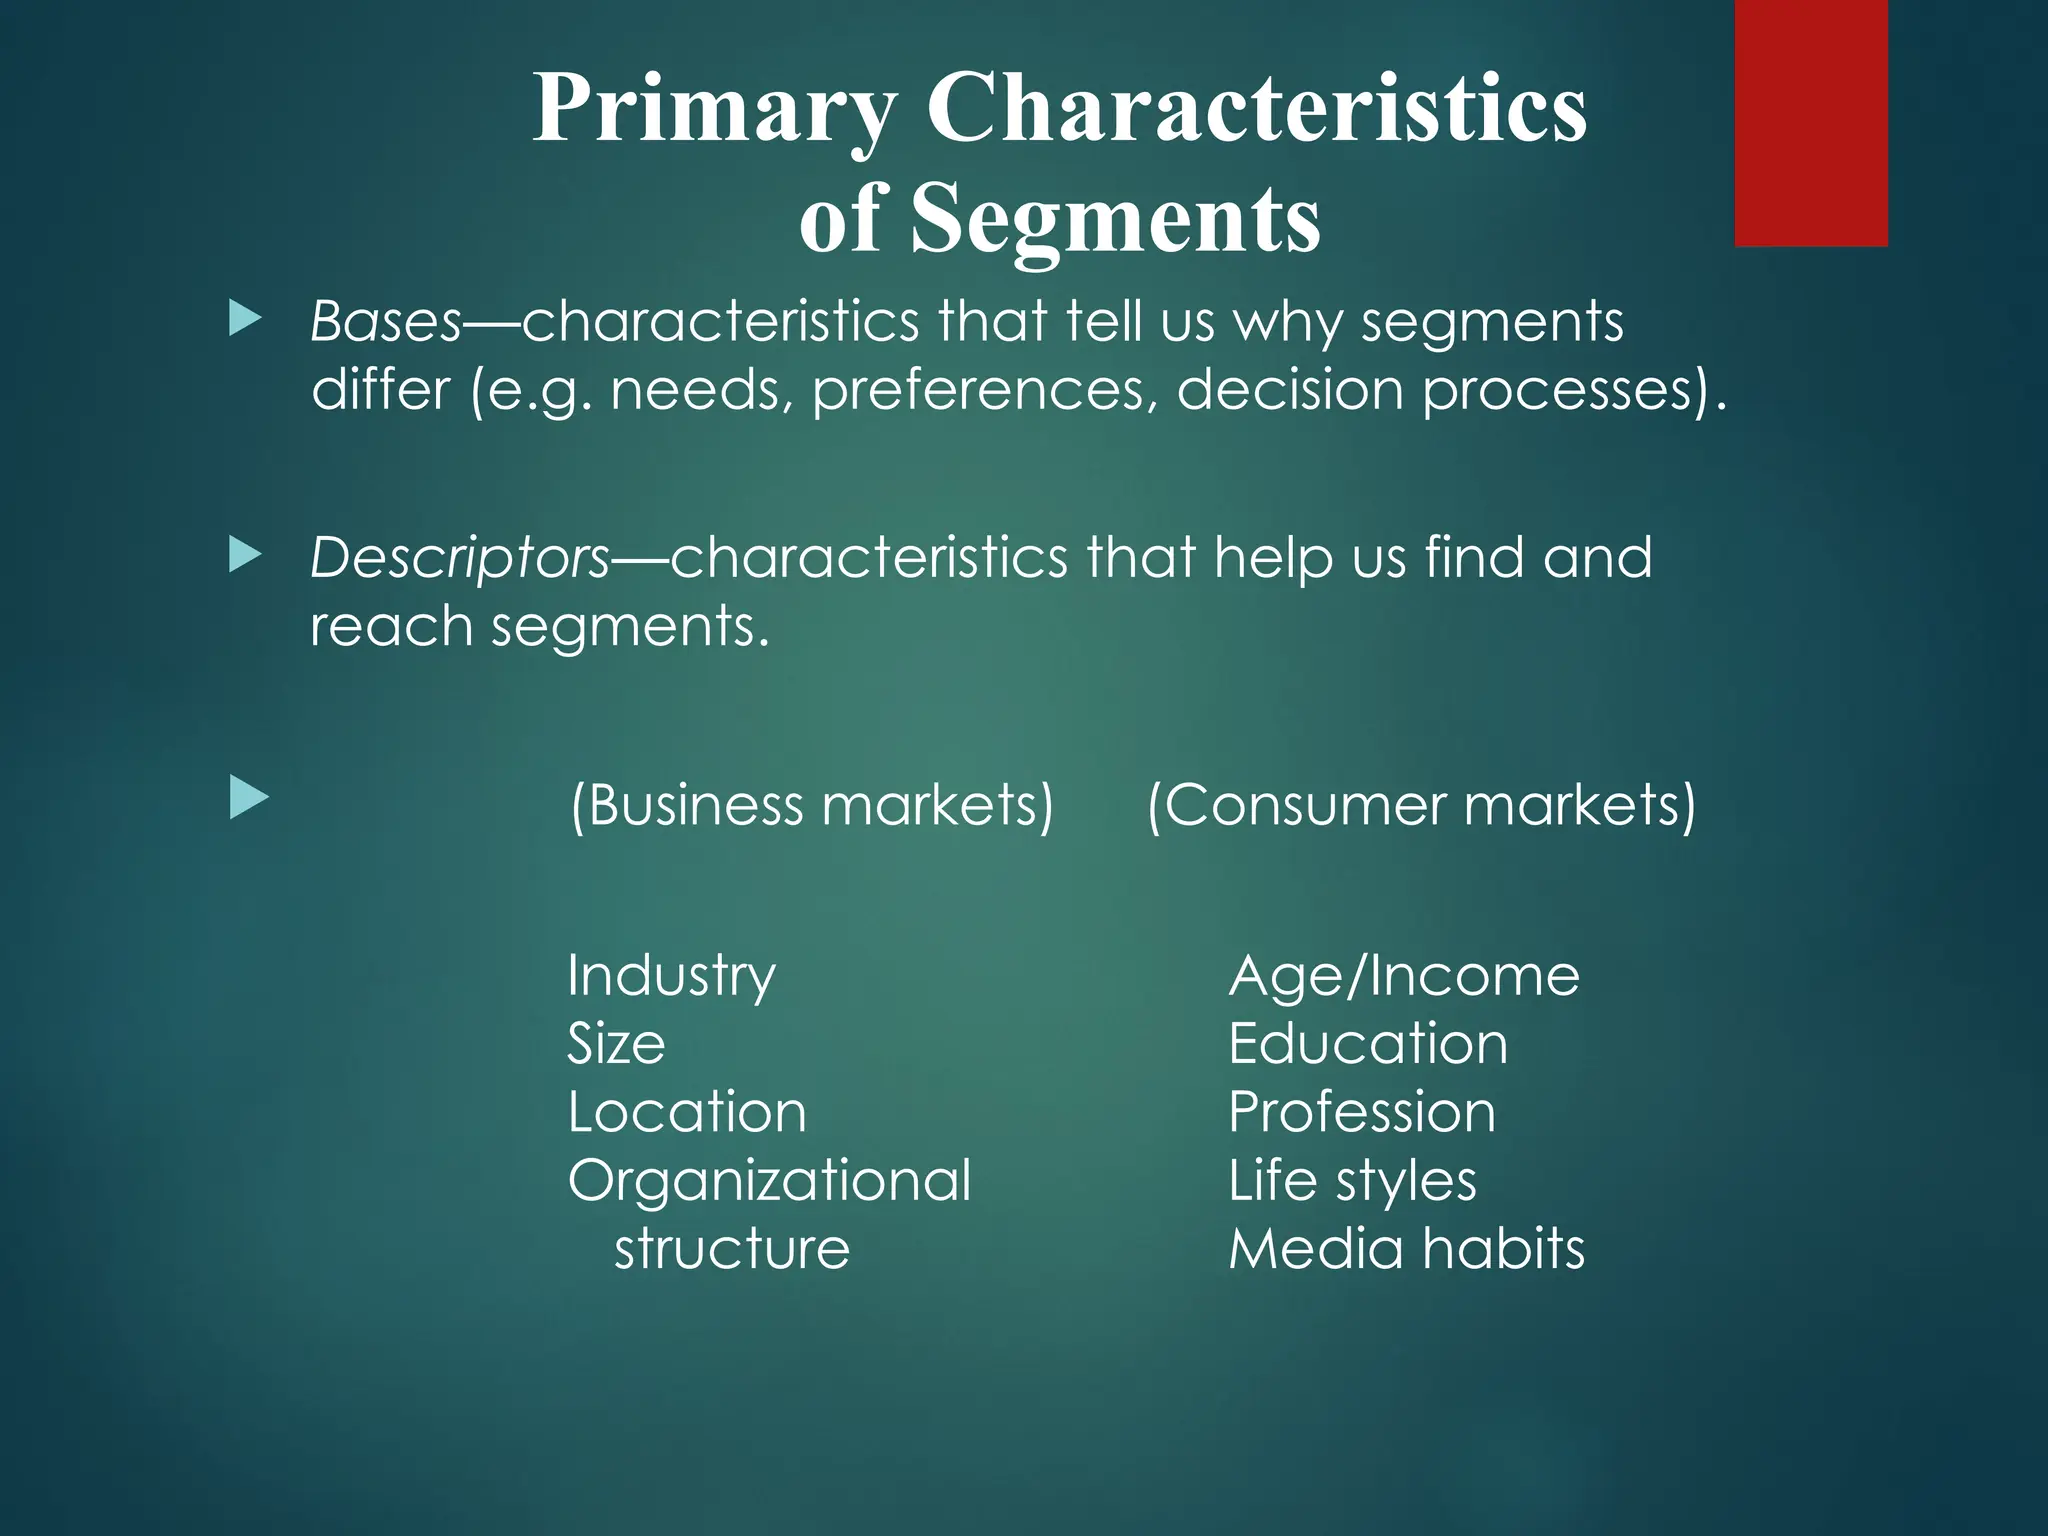
Primary Characteristics
of Segments
Bases—characteristics that tell us why segments
differ (e.g. needs, preferences, decision processes).
Descriptors—characteristics that help us find and
reach segments.
(Business markets) (Consumer markets)
Industry Age/Income
Size Education
Location Profession
Organizational Life styles
structure Media habits
5.
A Two-Stage Approach
inBusiness Markets
Macro-Segments:
First stage/rough cut
Industry/application
Firm size
Micro-Segments:
Second-stage/fine cut
Different customer needs, wants, values within macro-
segment
6.
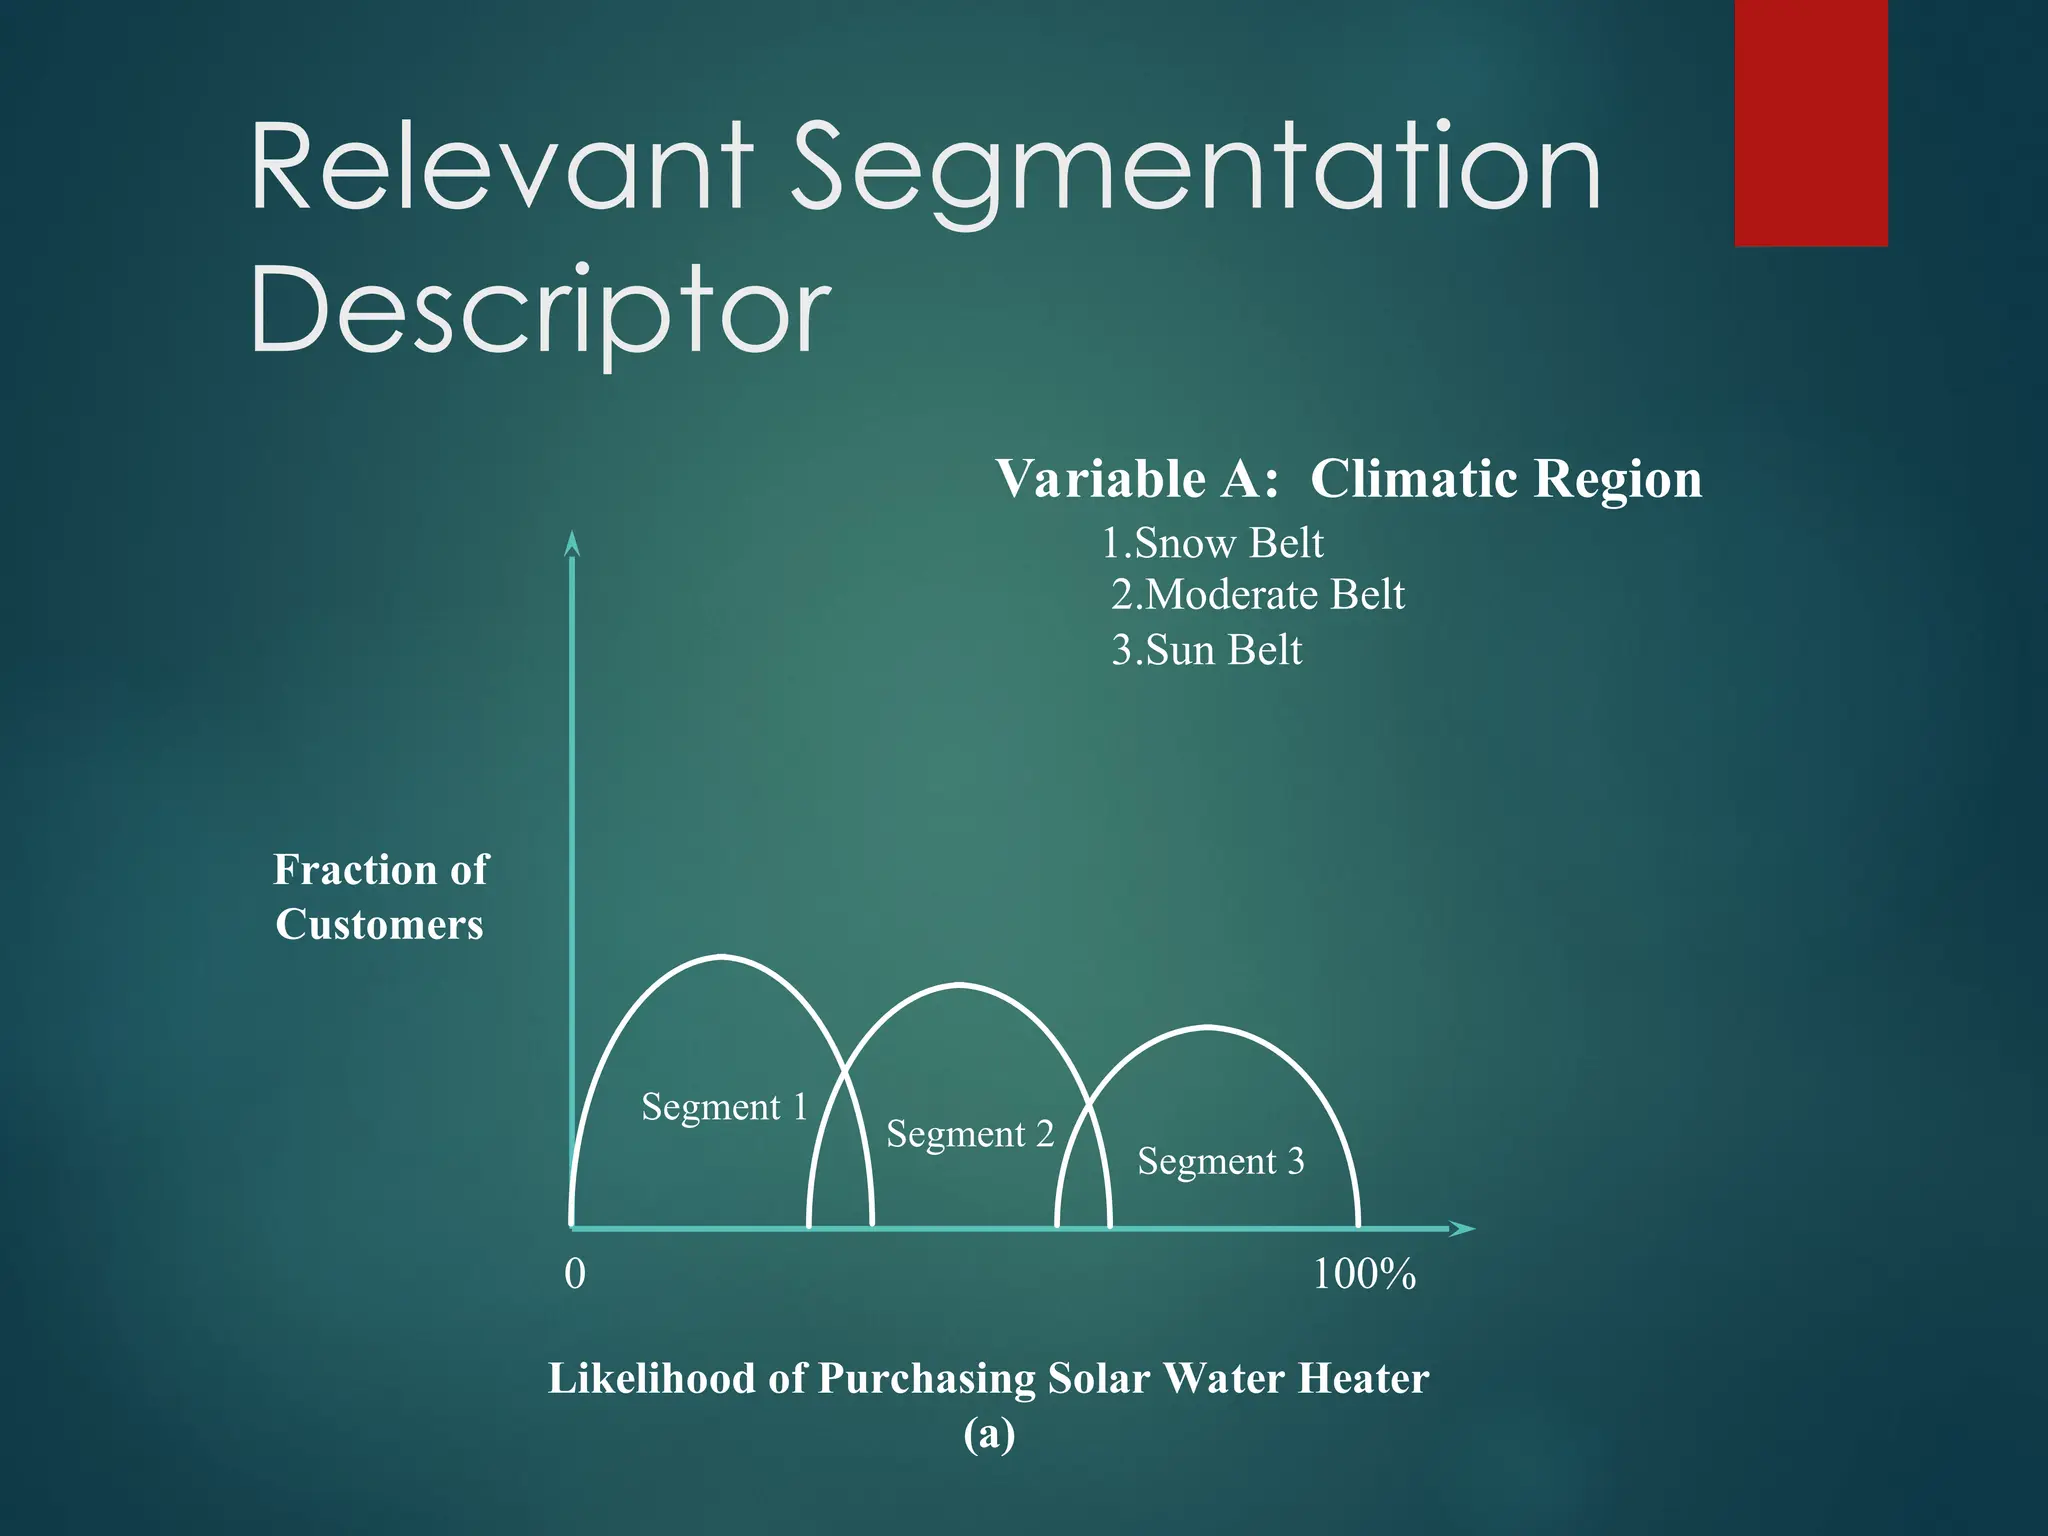
Relevant Segmentation
Descriptor
Variable A:Climatic Region
1.Snow Belt
2.Moderate Belt
3.Sun Belt
Fraction of
Customers
Likelihood of Purchasing Solar Water Heater
(a)
0 100%
Segment 1
Segment 2
Segment 3
7.
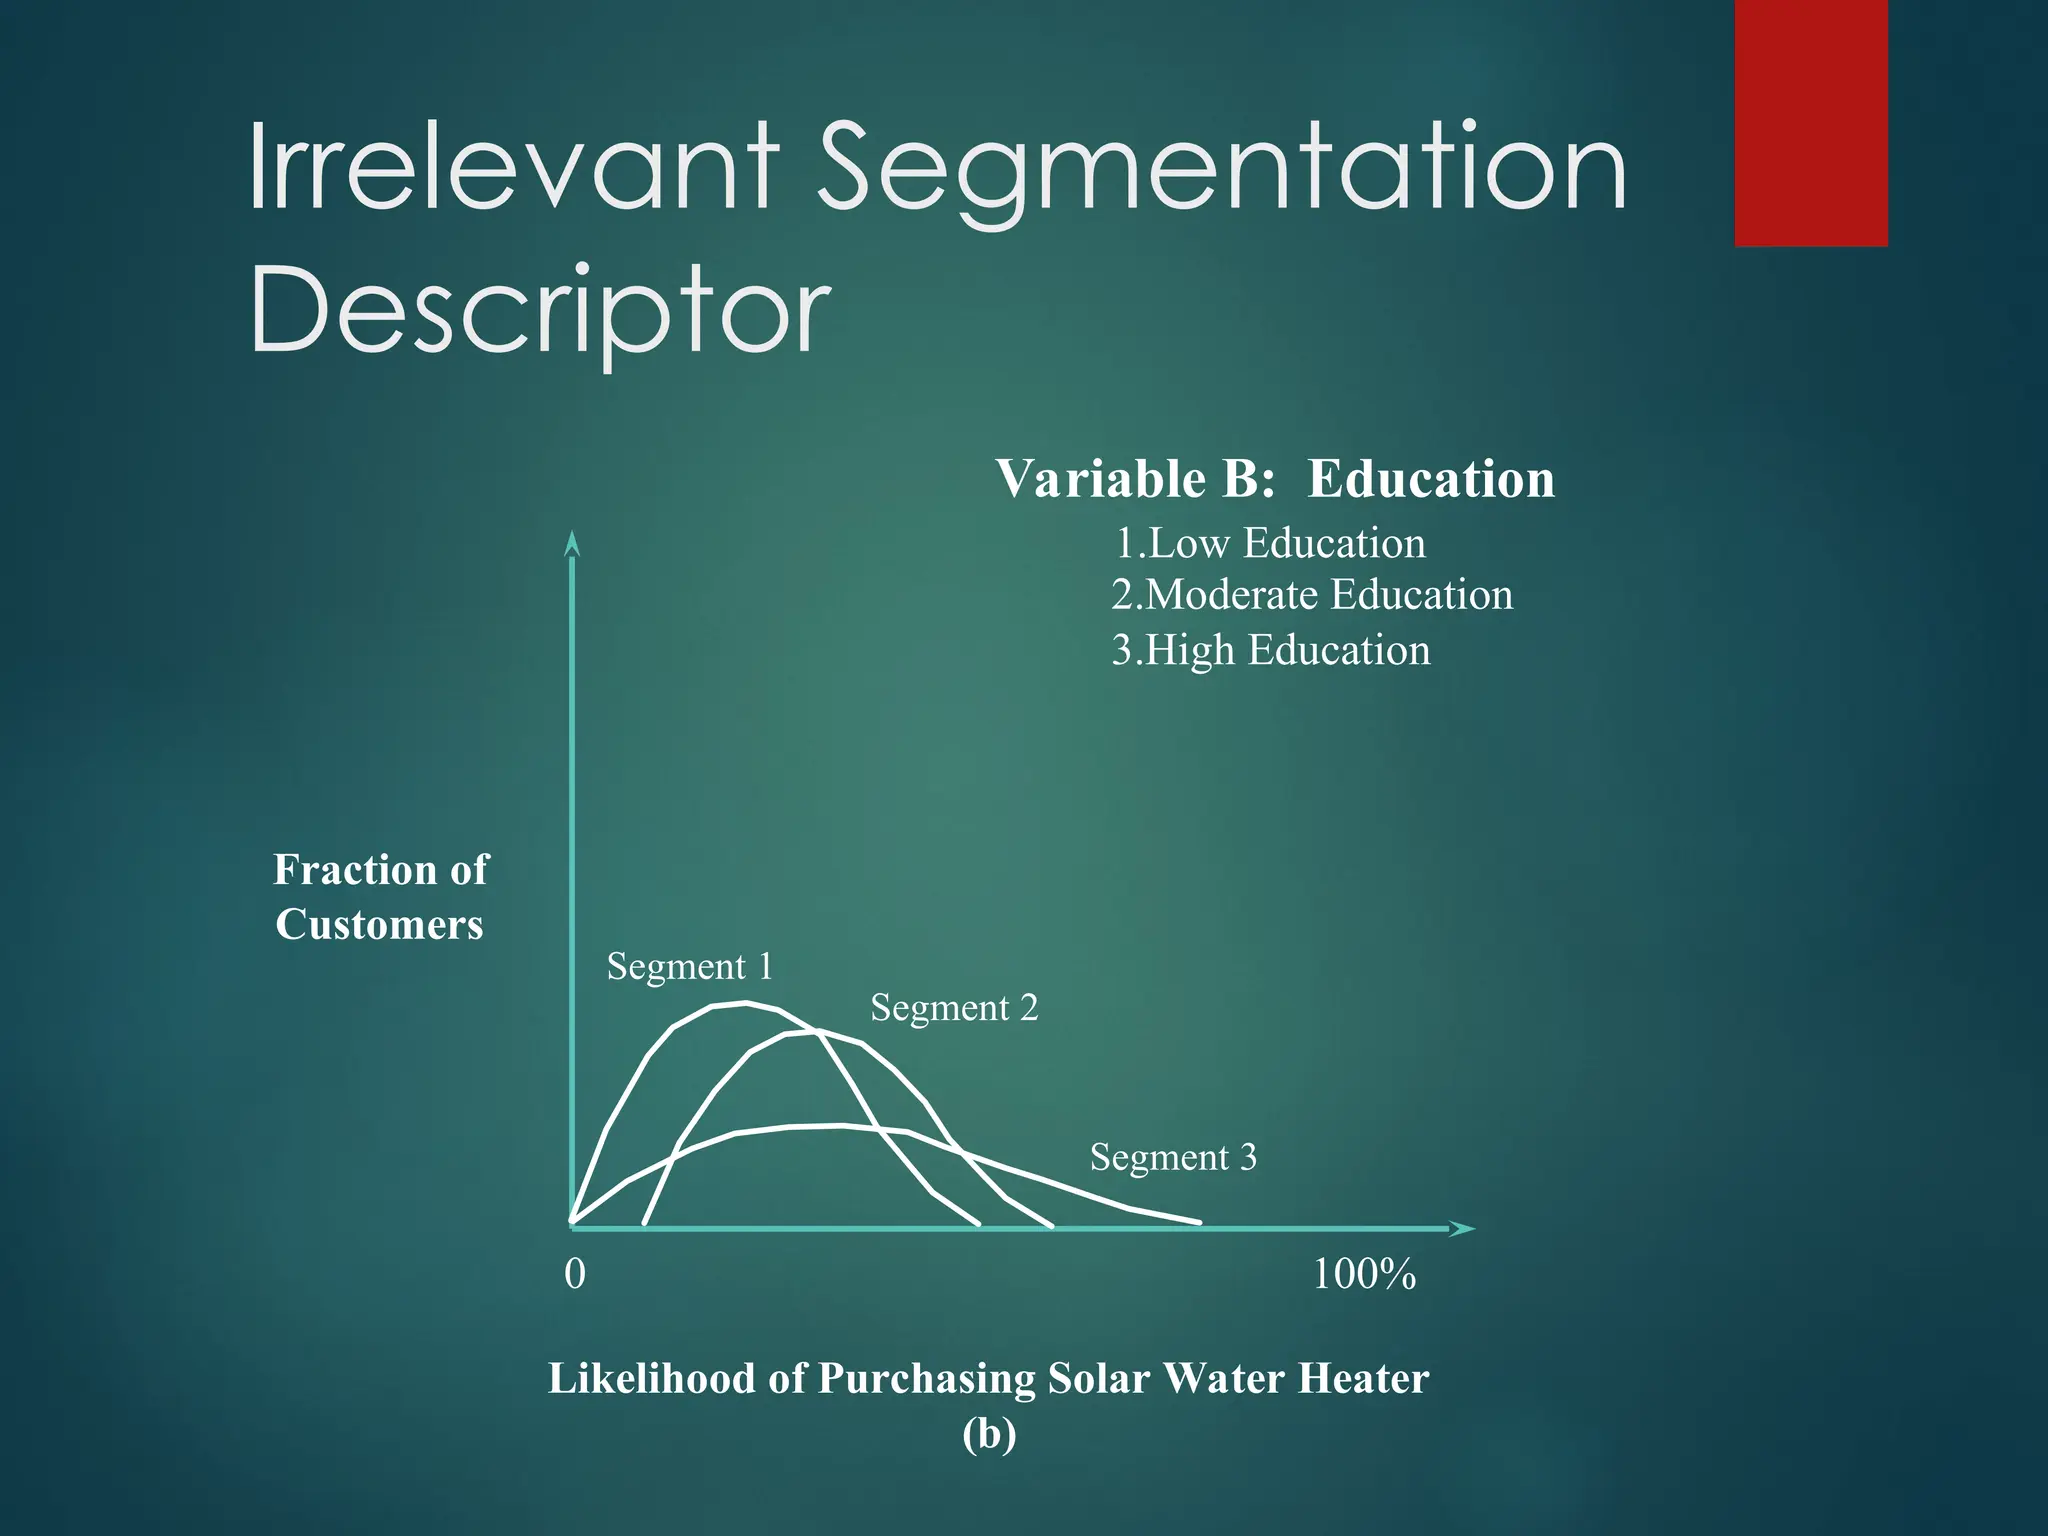
Likelihood of PurchasingSolar Water Heater
(b)
Irrelevant Segmentation
Descriptor
Fraction of
Customers
0 100%
Variable B: Education
1.Low Education
2.Moderate Education
3.High Education
Segment 1
Segment 2
Segment 3
8.
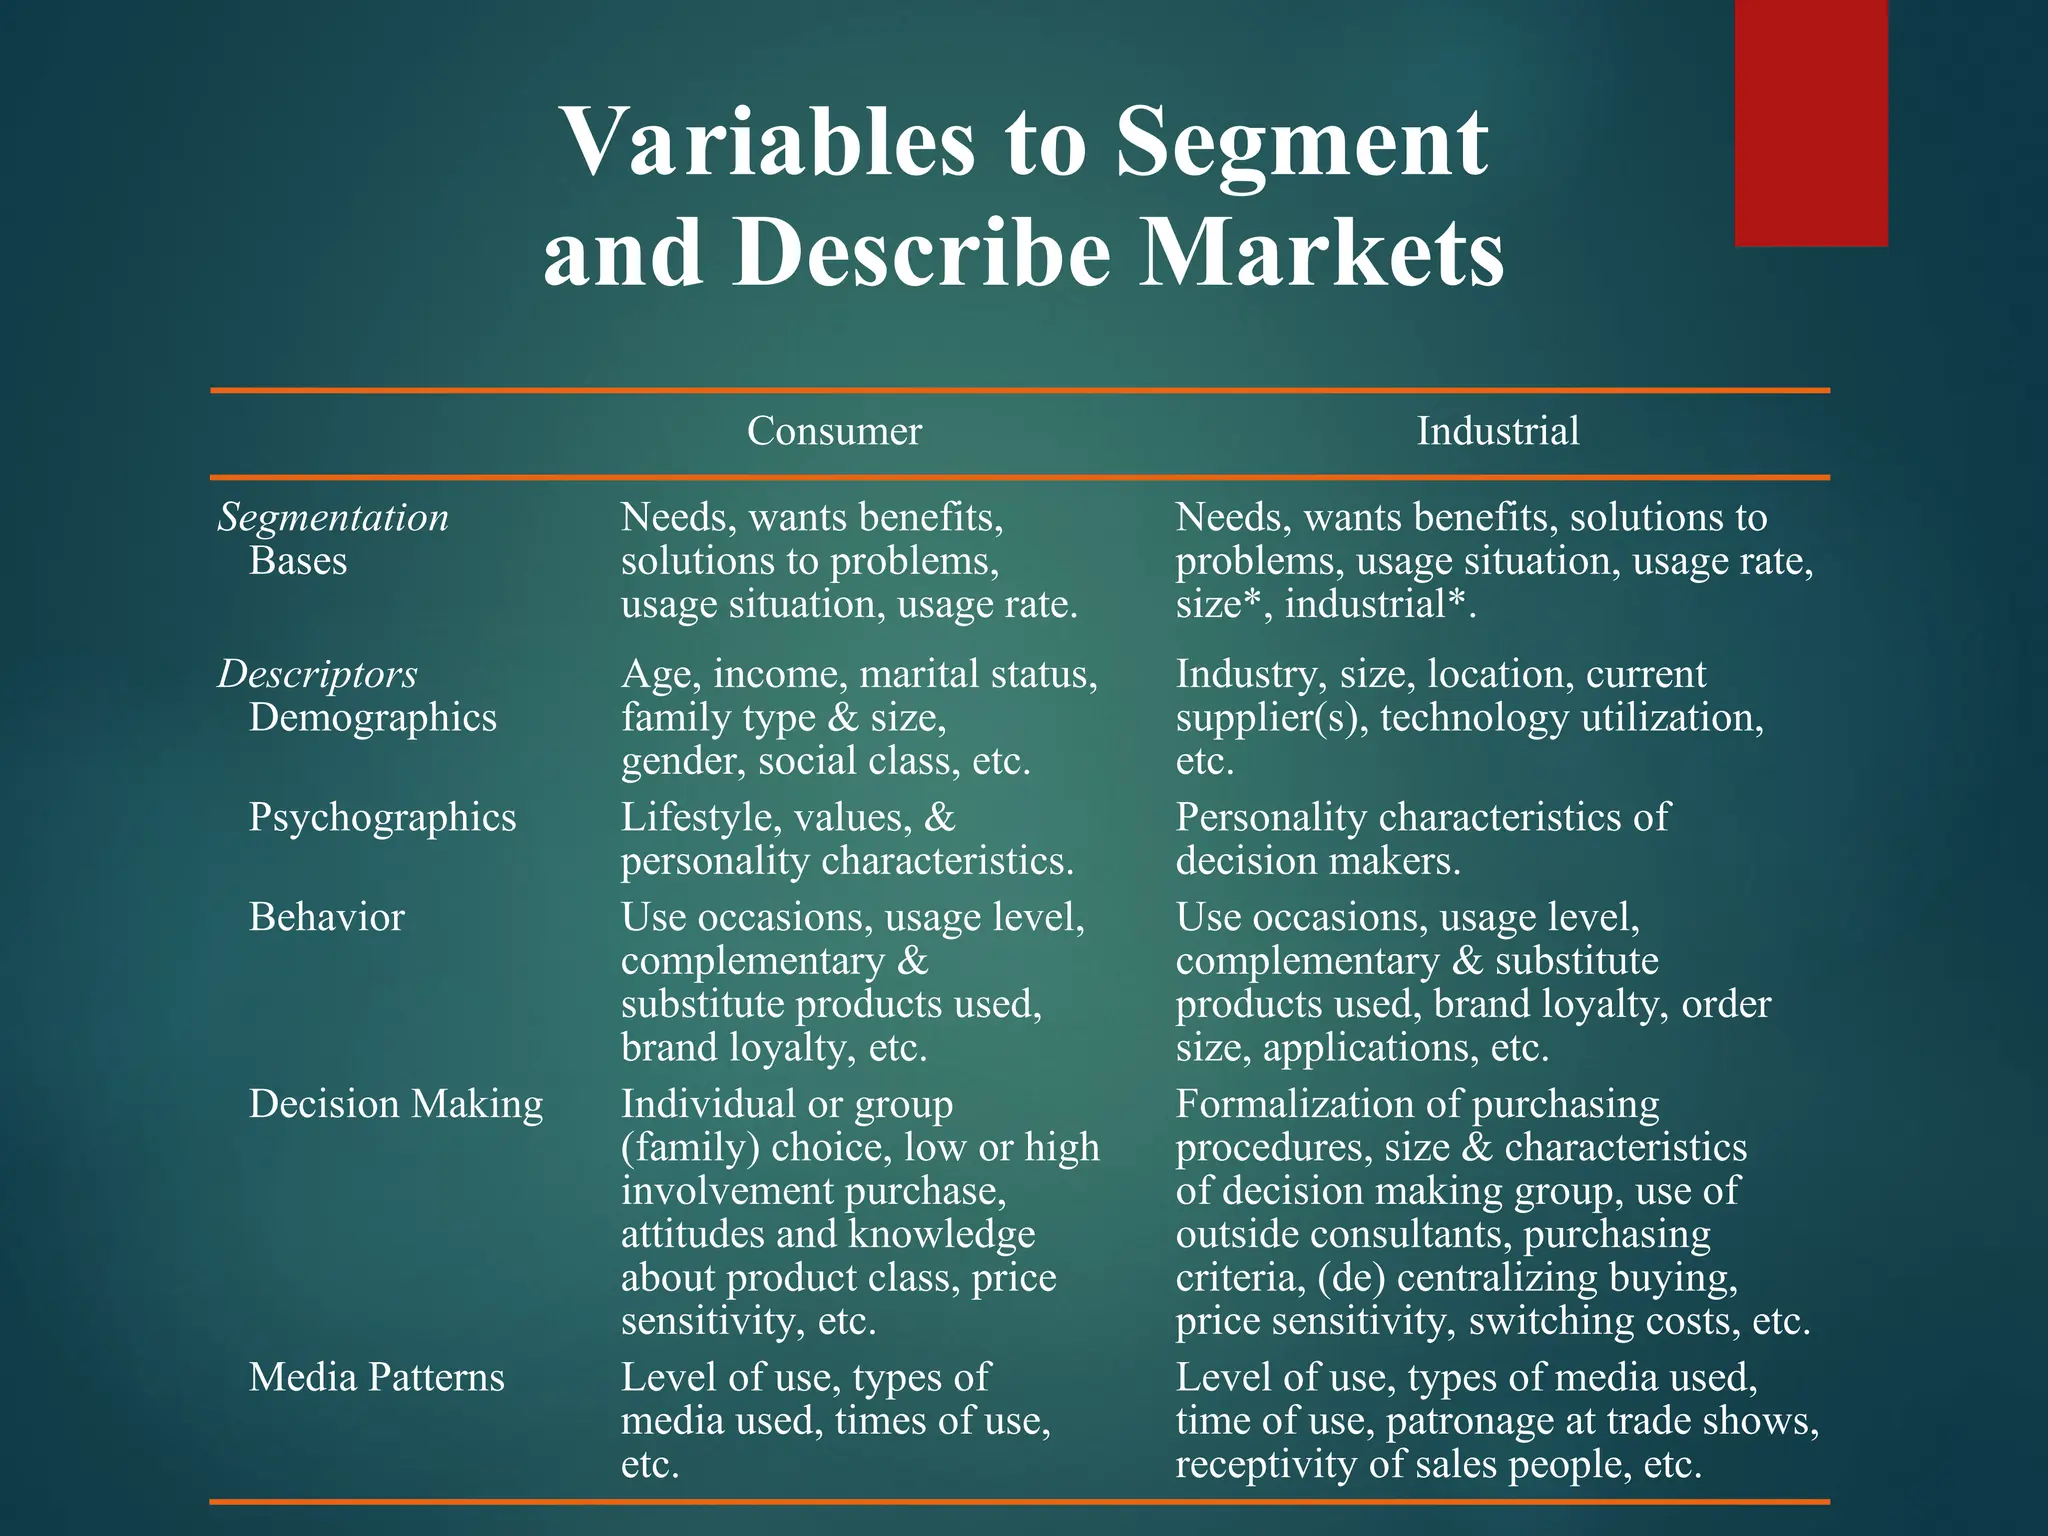
Variables to Segment
andDescribe Markets
Consumer Industrial
Segmentation Needs, wants benefits, Needs, wants benefits, solutions to
Bases solutions to problems, problems, usage situation, usage rate,
usage situation, usage rate. size*, industrial*.
Descriptors Age, income, marital status, Industry, size, location, current
Demographics family type & size, supplier(s), technology utilization,
gender, social class, etc. etc.
Psychographics Lifestyle, values, & Personality characteristics of
personality characteristics. decision makers.
Behavior Use occasions, usage level, Use occasions, usage level,
complementary & complementary & substitute
substitute products used, products used, brand loyalty, order
brand loyalty, etc. size, applications, etc.
Decision Making Individual or group Formalization of purchasing
(family) choice, low or high procedures, size & characteristics
involvement purchase, of decision making group, use of
attitudes and knowledge outside consultants, purchasing
about product class, price criteria, (de) centralizing buying,
sensitivity, etc. price sensitivity, switching costs, etc.
Media Patterns Level of use, types of Level of use, types of media used,
media used, times of use, time of use, patronage at trade shows,
etc. receptivity of sales people, etc.
9.
Segmentation in Action
Wesegment our customers by letter volume, by
postage volume, by the type of equipment they use.
Then we segment on whether they buy or lease
equipment.
Based on this knowledge, we target our marketing
messages, fine tune our sales tactics, learn which
benefits appeal to which customers and zero in on key
decision makers at a company.
—Kathleen Synnot, VP, Worldwide Marketing
Mailing Systems Division, Pitney Bowes, Inc.
[quoted in Marketing Masters (Walden and Lawler)]
10.
Segmentation
If you’re notthinking segments, you’re not
thinking. To think segments means you have to
think about what drives customers, customer
groups, and the choices that are or might be
available to them.
—Levitt, Marketing Imagination
11.
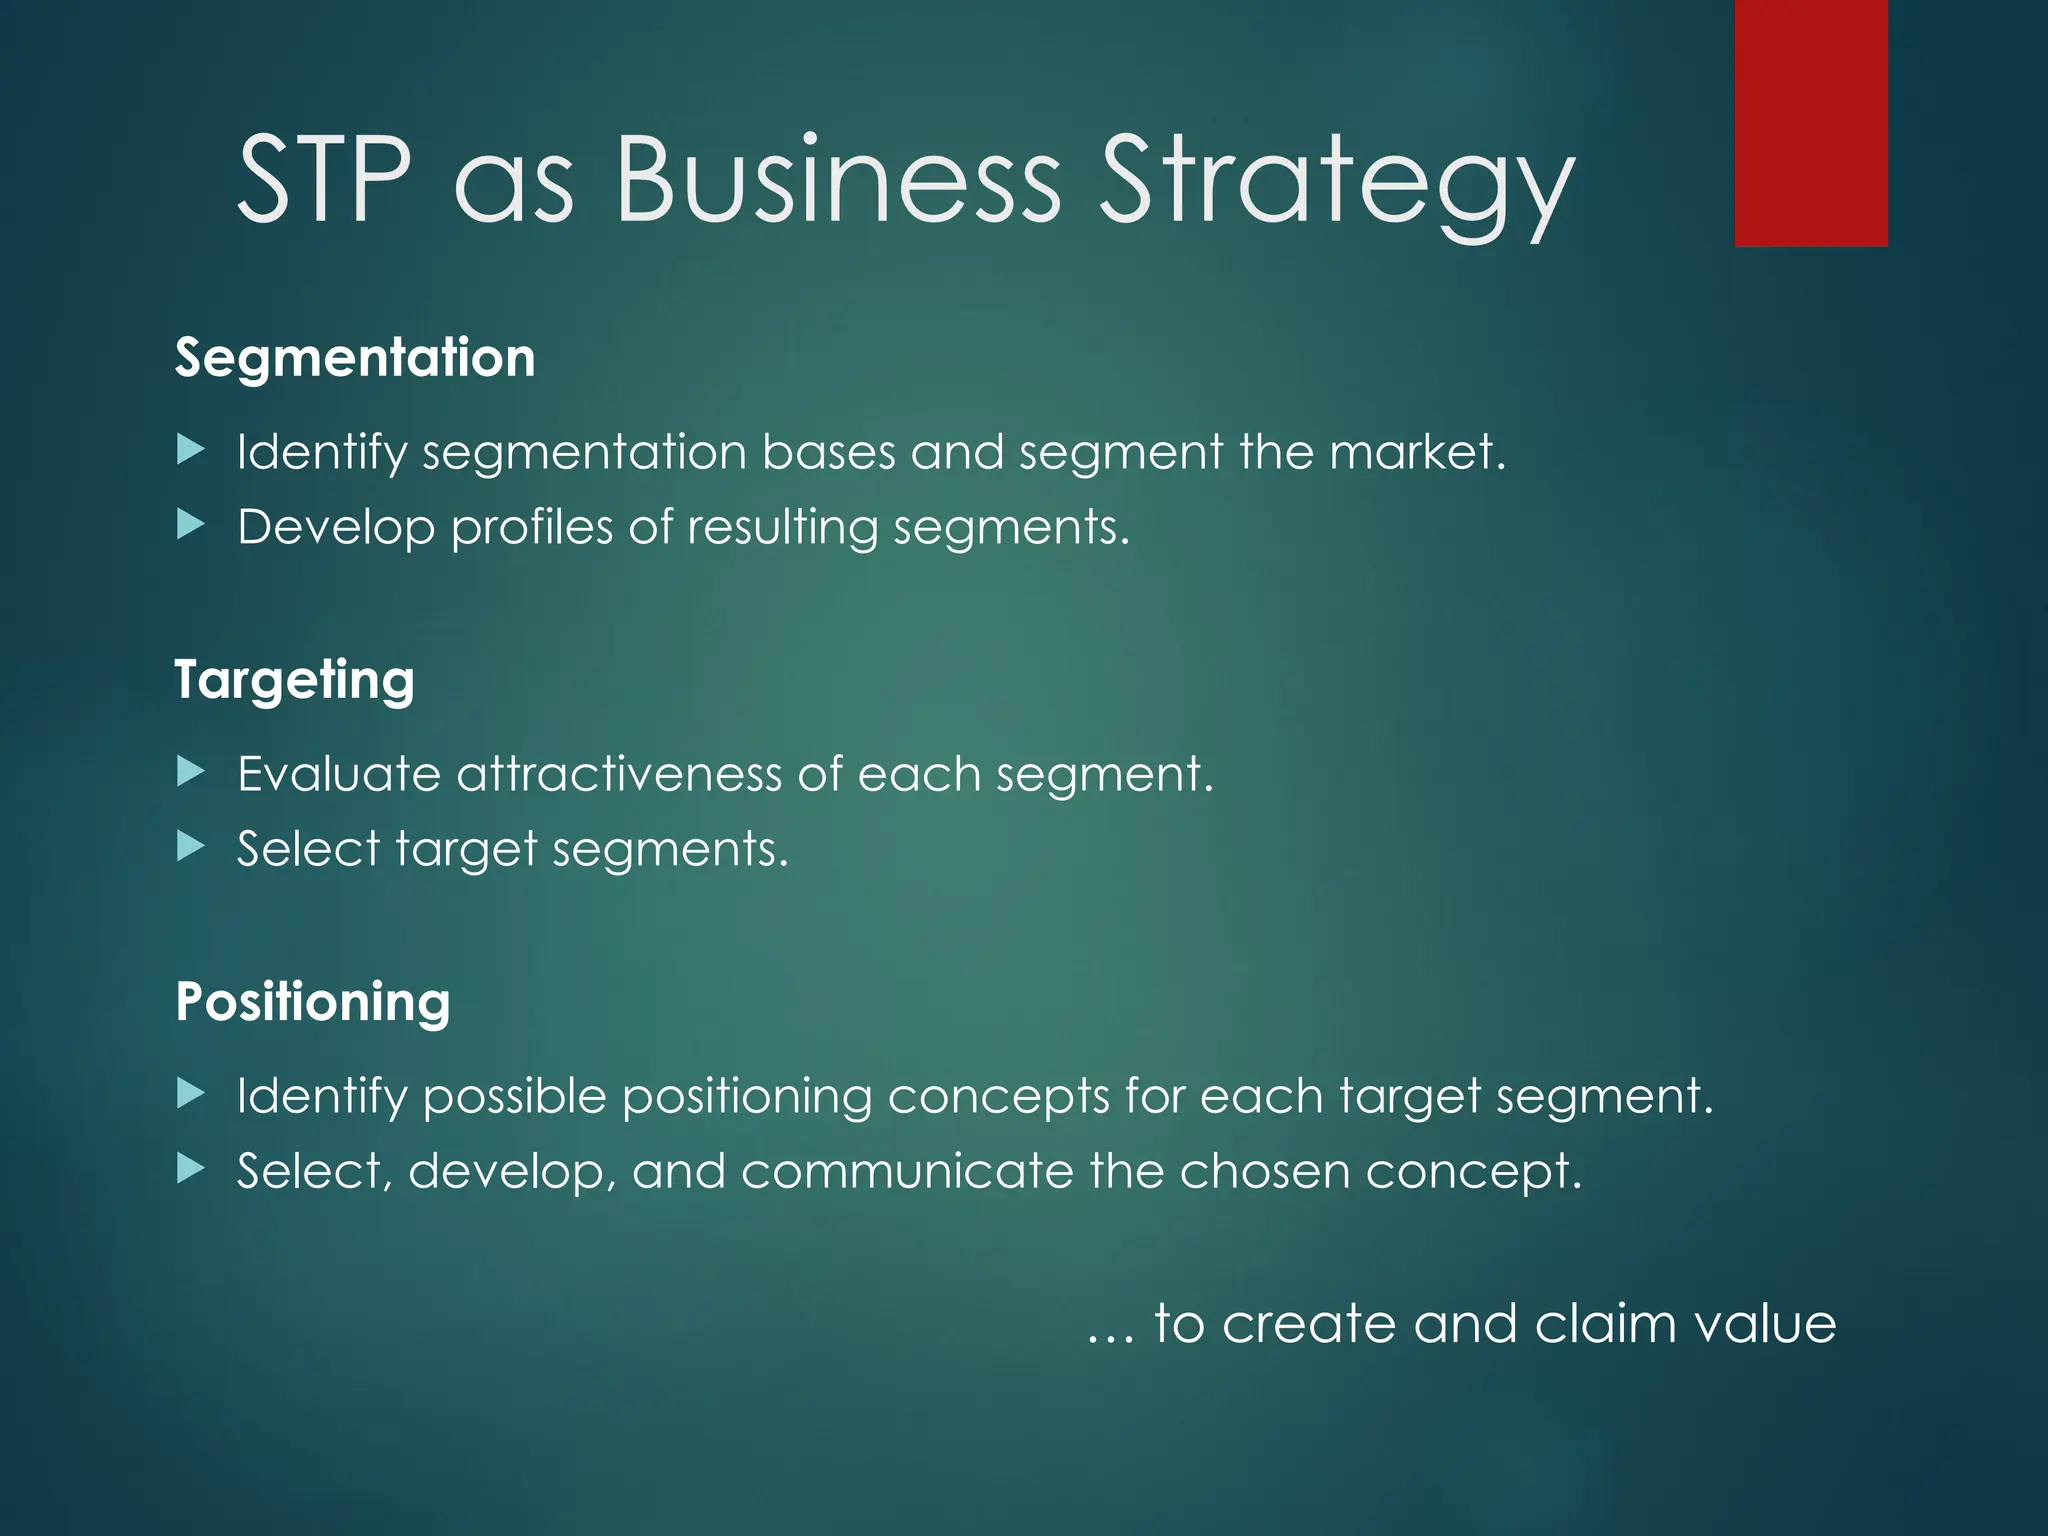
STP as BusinessStrategy
Segmentation
Identify segmentation bases and segment the market.
Develop profiles of resulting segments.
Targeting
Evaluate attractiveness of each segment.
Select target segments.
Positioning
Identify possible positioning concepts for each target segment.
Select, develop, and communicate the chosen concept.
… to create and claim value
12.
Overview of Methodsfor STP
Clustering and discriminant
analysis
Choice-based segmentation
Perceptual mapping
- later
13.
..
.
D
.
.
..
.
.
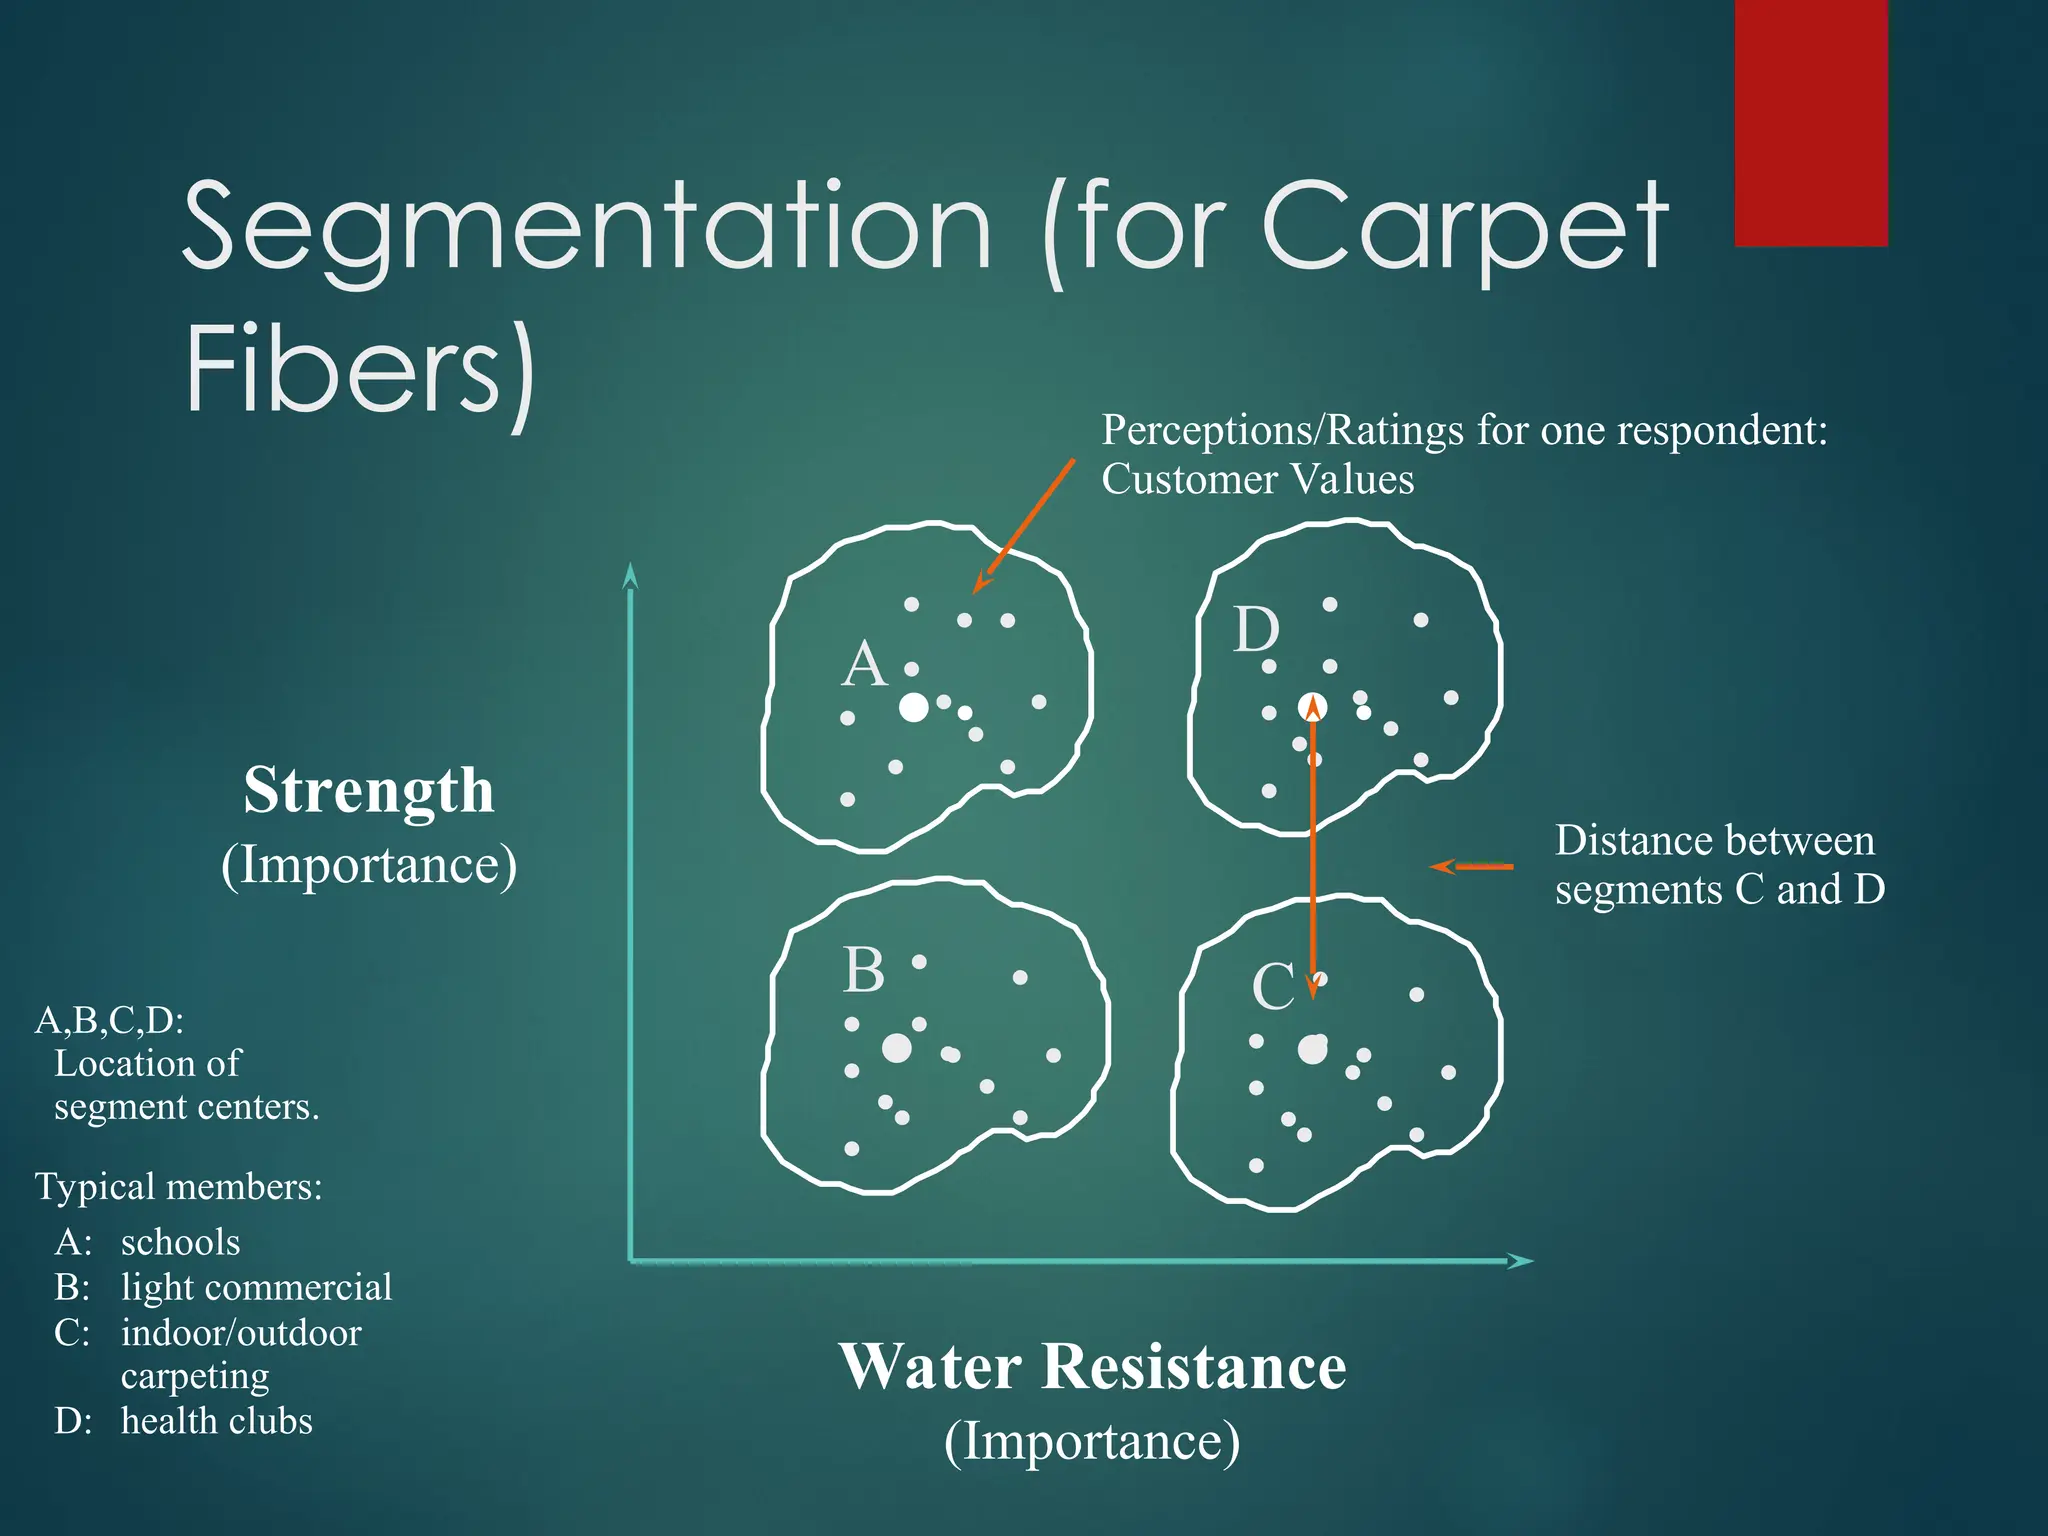
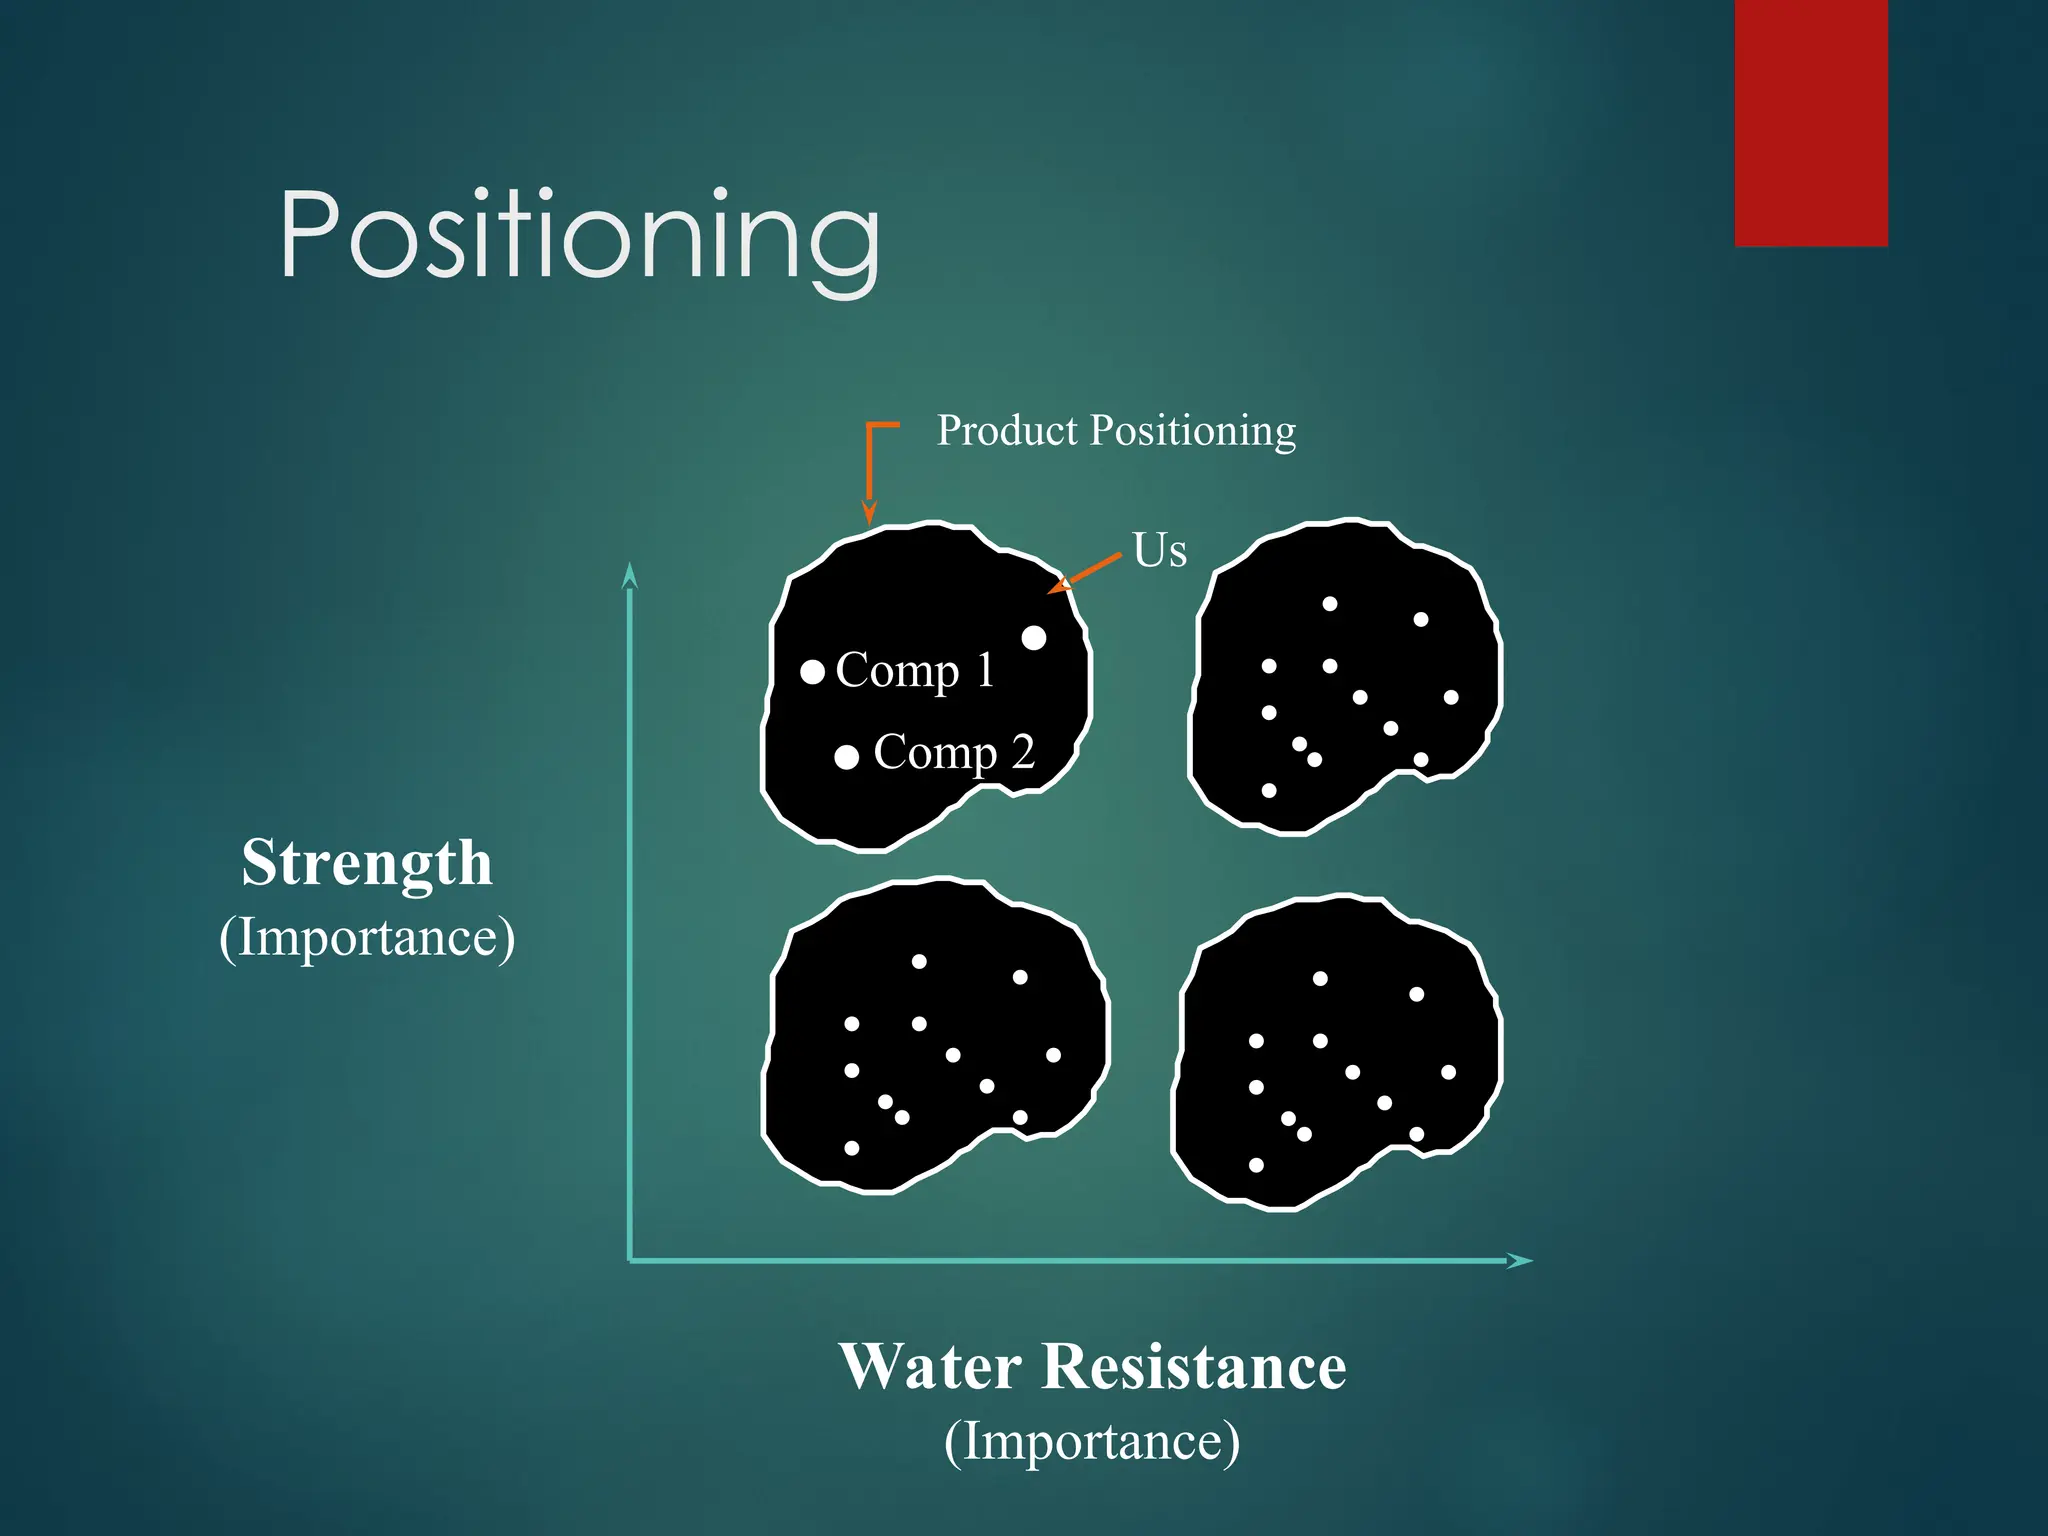
Segmentation (for Carpet
Fibers)
A,B,C,D:
Locationof
segment centers.
Typical members:
A: schools
B: light commercial
C: indoor/outdoor
carpeting
D: health clubs
Distance between
segments C and D
.
..
. .
.
Strength
(Importance)
Water Resistance
(Importance)
.....
.
..
A
.....
.
..
. .
.
.
.....
.
..
. .
.
.
...
..
.. C
B
Perceptions/Ratings for one respondent:
Customer Values
.
A Note onPositioning
Positioning involves designing an offering so that the target
segment members perceive it in a distinct and valued way
relative to competitors.
Three ways to position an offering:
1. Unique (“Only product/service with XXX”)
2. Difference (“More than twice the [feature] vs.
[competitor]”)
3. Similarities (“Same functionality as
[competitor];
lower price”)
What are you telling your targeted segments?
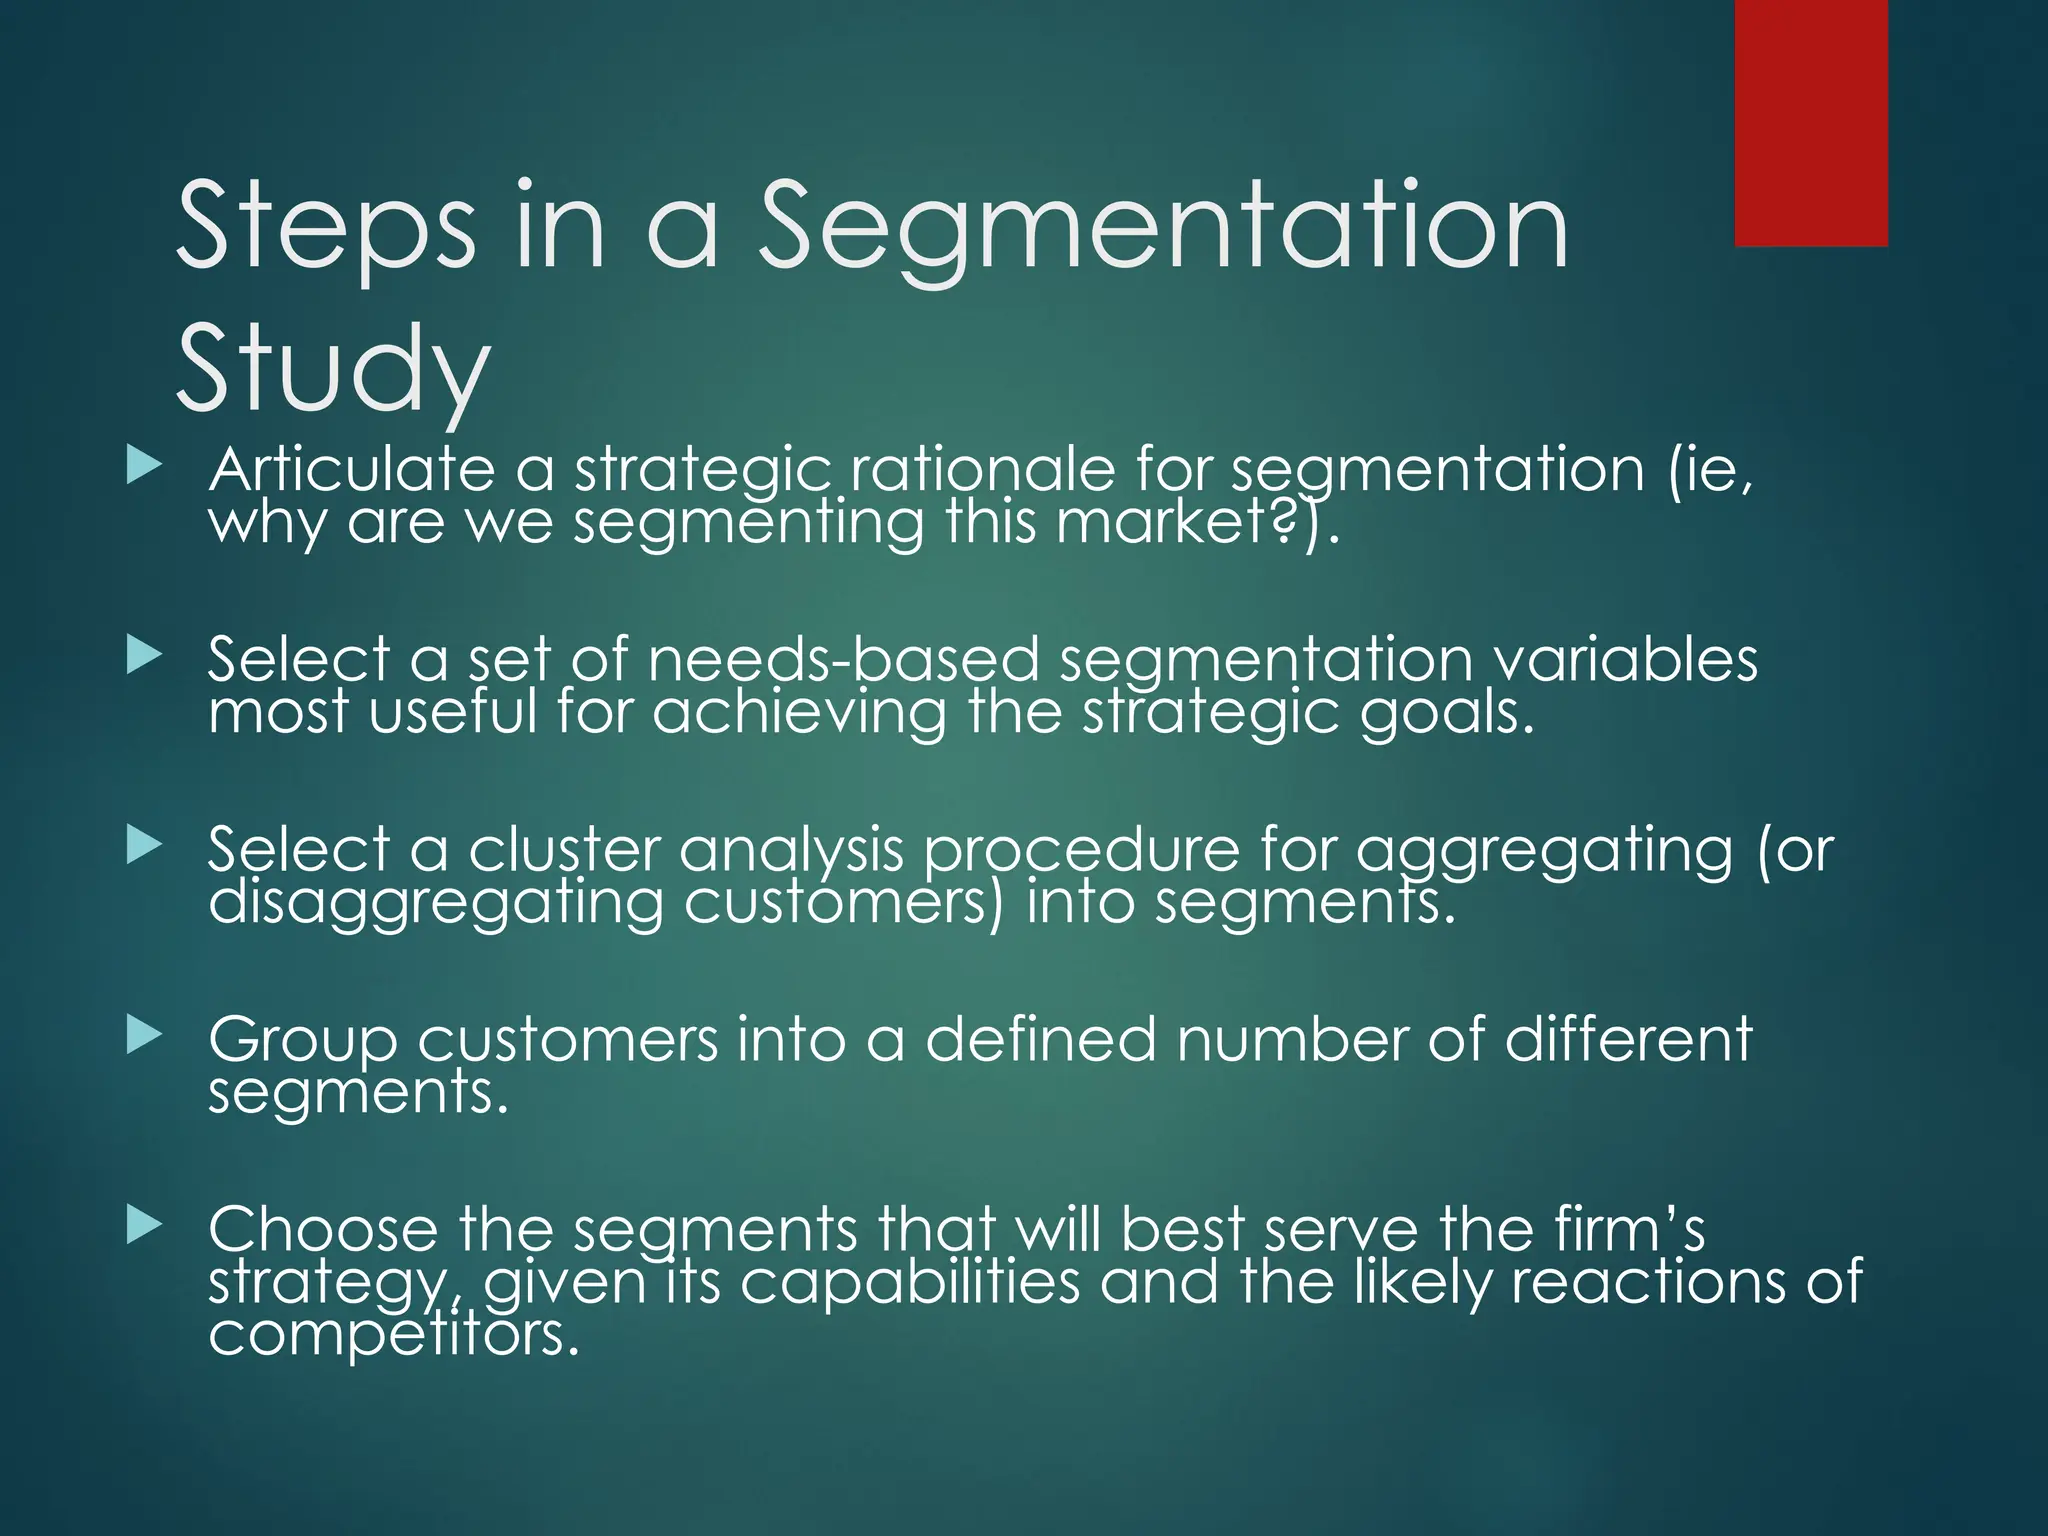
Steps in aSegmentation
Study
Articulate a strategic rationale for segmentation (ie,
why are we segmenting this market?).
Select a set of needs-based segmentation variables
most useful for achieving the strategic goals.
Select a cluster analysis procedure for aggregating (or
disaggregating customers) into segments.
Group customers into a defined number of different
segments.
Choose the segments that will best serve the firm’s
strategy, given its capabilities and the likely reactions of
competitors.
19.
Segmentation: Methods
Overview
Factoranalysis (to reduce data before
cluster analysis).
Cluster analysis to form segments.
Discriminant analysis to describe
segments.
20.
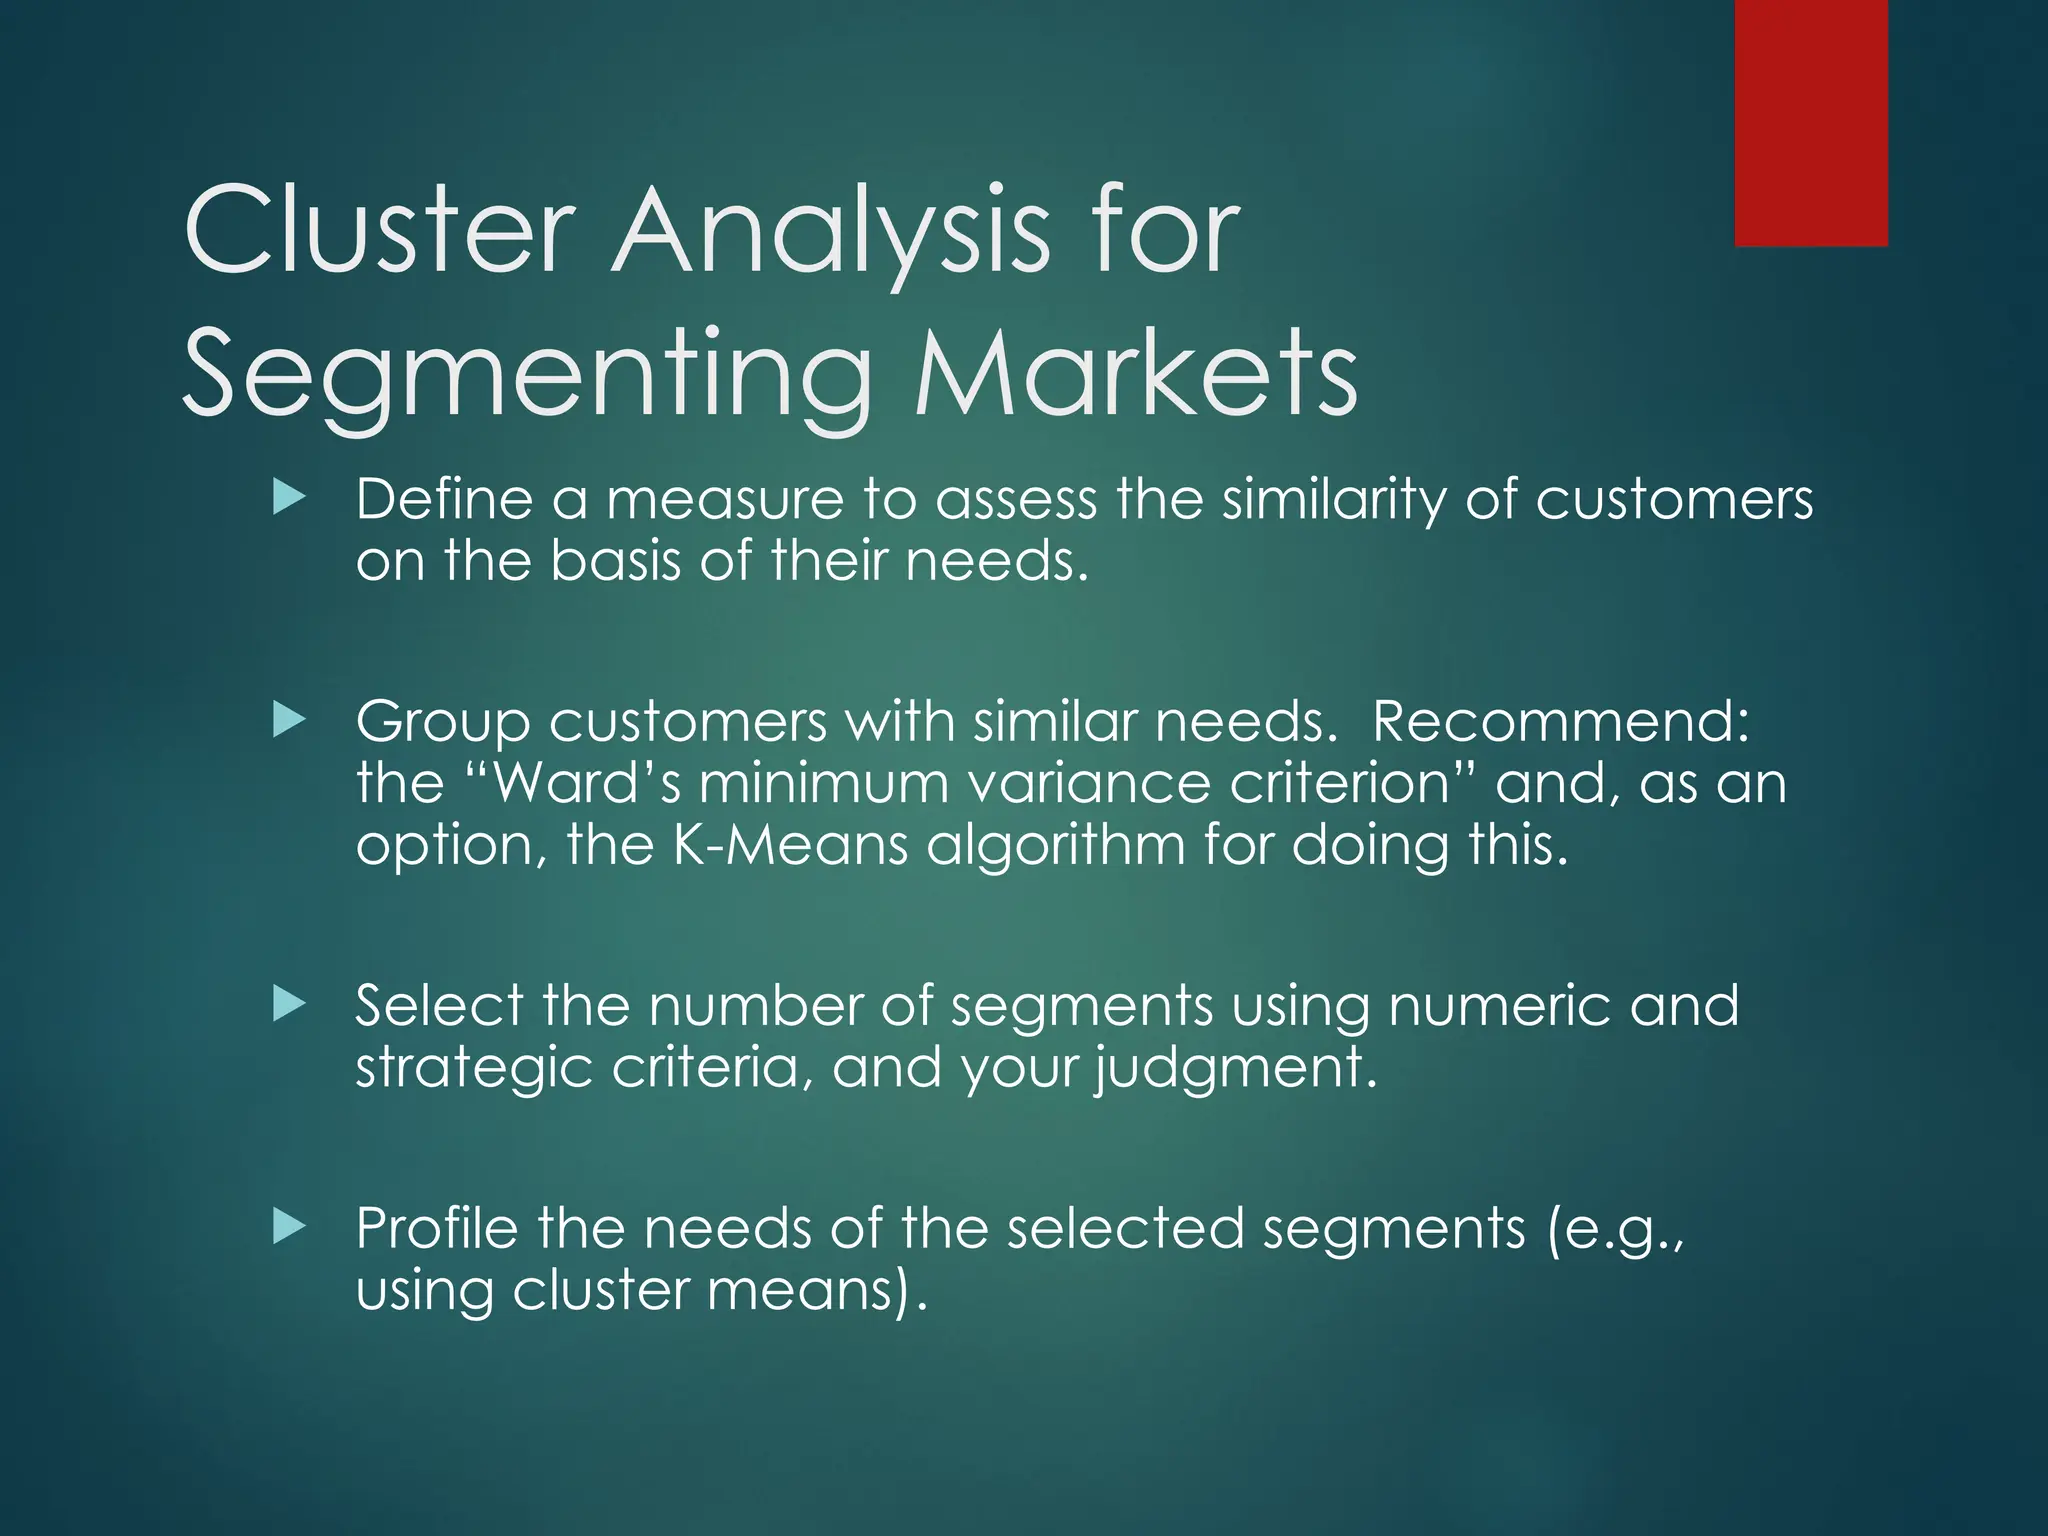
Cluster Analysis for
SegmentingMarkets
Define a measure to assess the similarity of customers
on the basis of their needs.
Group customers with similar needs. Recommend:
the “Ward’s minimum variance criterion” and, as an
option, the K-Means algorithm for doing this.
Select the number of segments using numeric and
strategic criteria, and your judgment.
Profile the needs of the selected segments (e.g.,
using cluster means).
21.
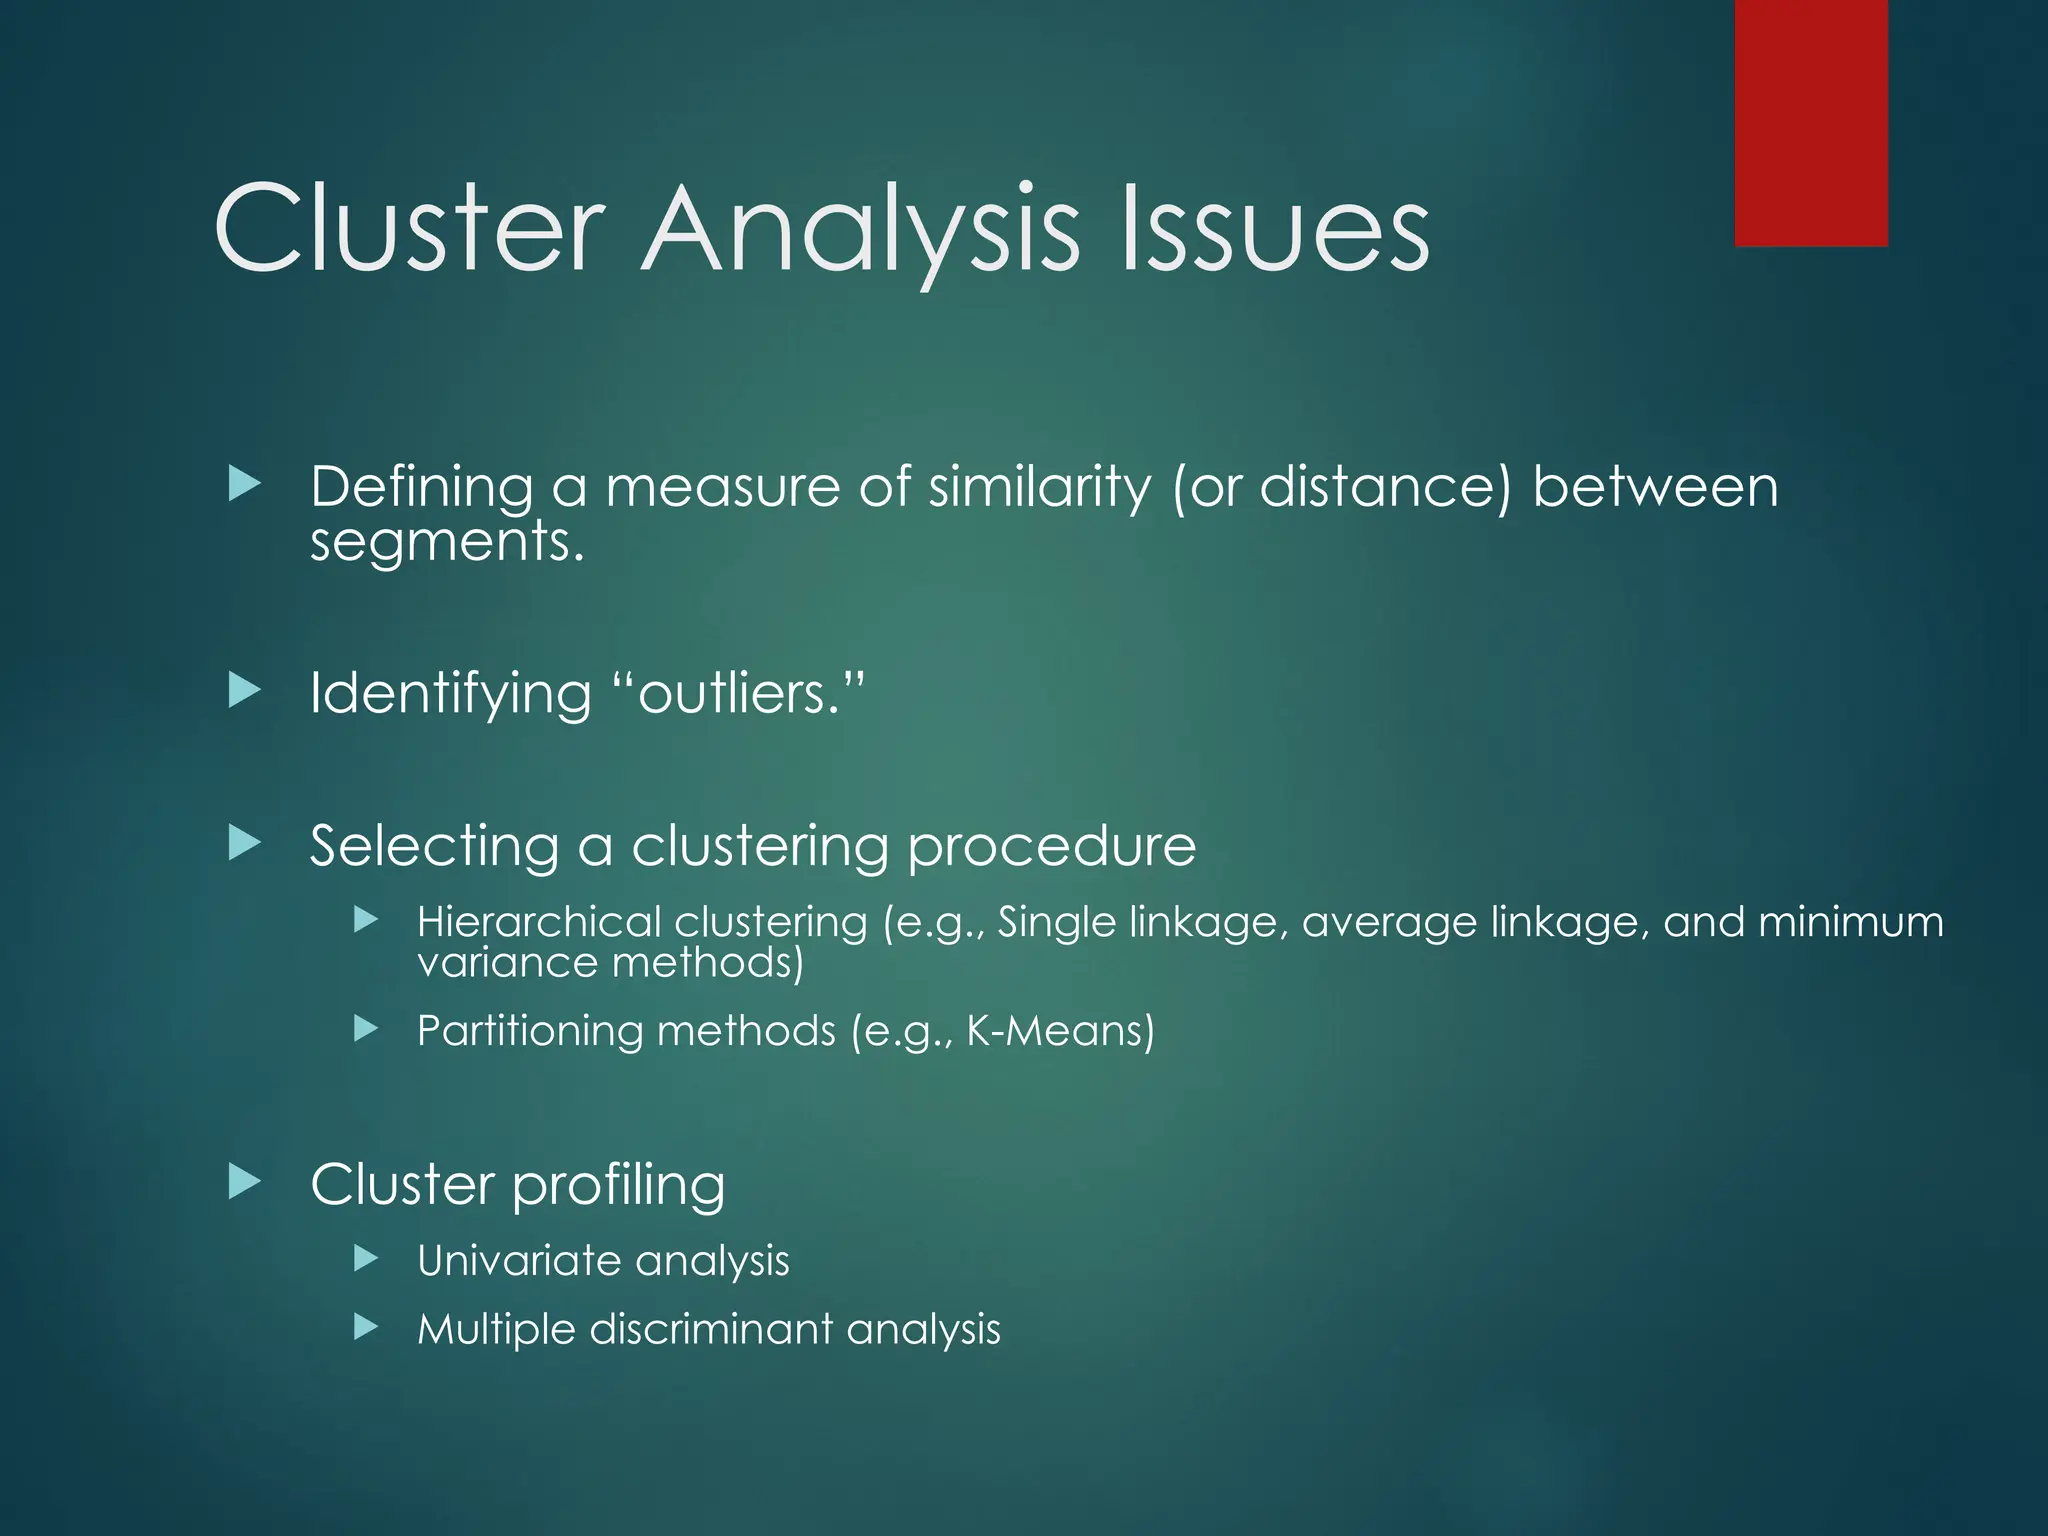
Cluster Analysis Issues
Defining a measure of similarity (or distance) between
segments.
Identifying “outliers.”
Selecting a clustering procedure
Hierarchical clustering (e.g., Single linkage, average linkage, and minimum
variance methods)
Partitioning methods (e.g., K-Means)
Cluster profiling
Univariate analysis
Multiple discriminant analysis
22.
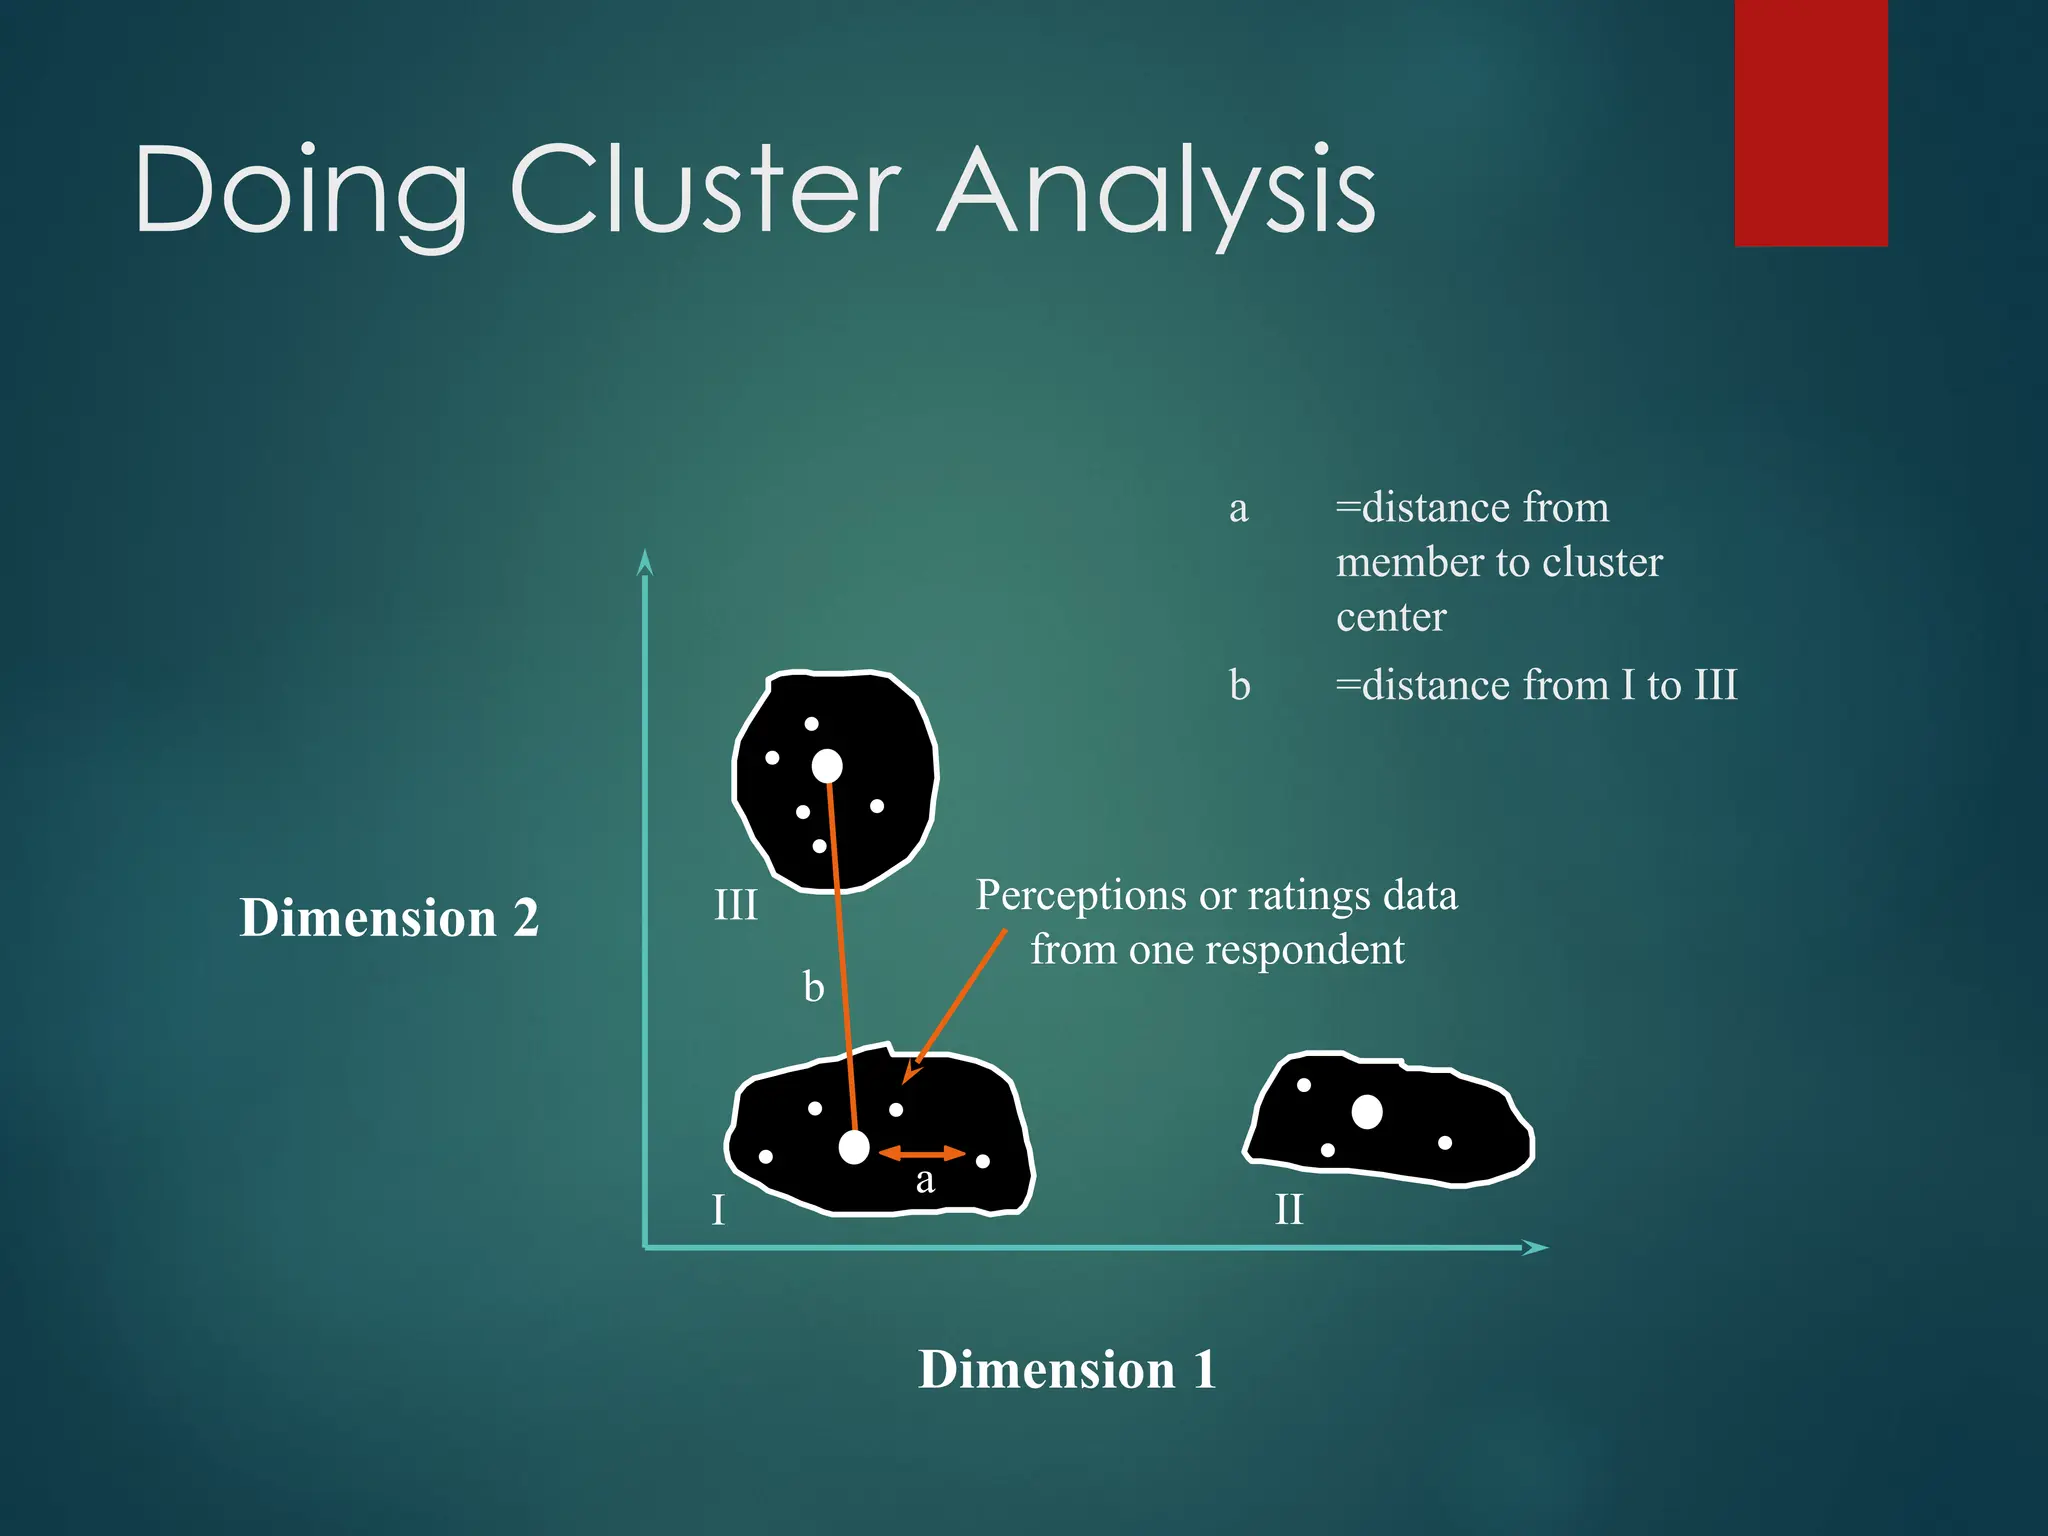
Doing Cluster Analysis
Dimension2
Dimension 1
•
•
•
•
•
•
•
•
•
•
• •
Perceptions or ratings data
from one respondent
III
a
I II
b
a =distance from
member to cluster
center
b =distance from I to III
23.
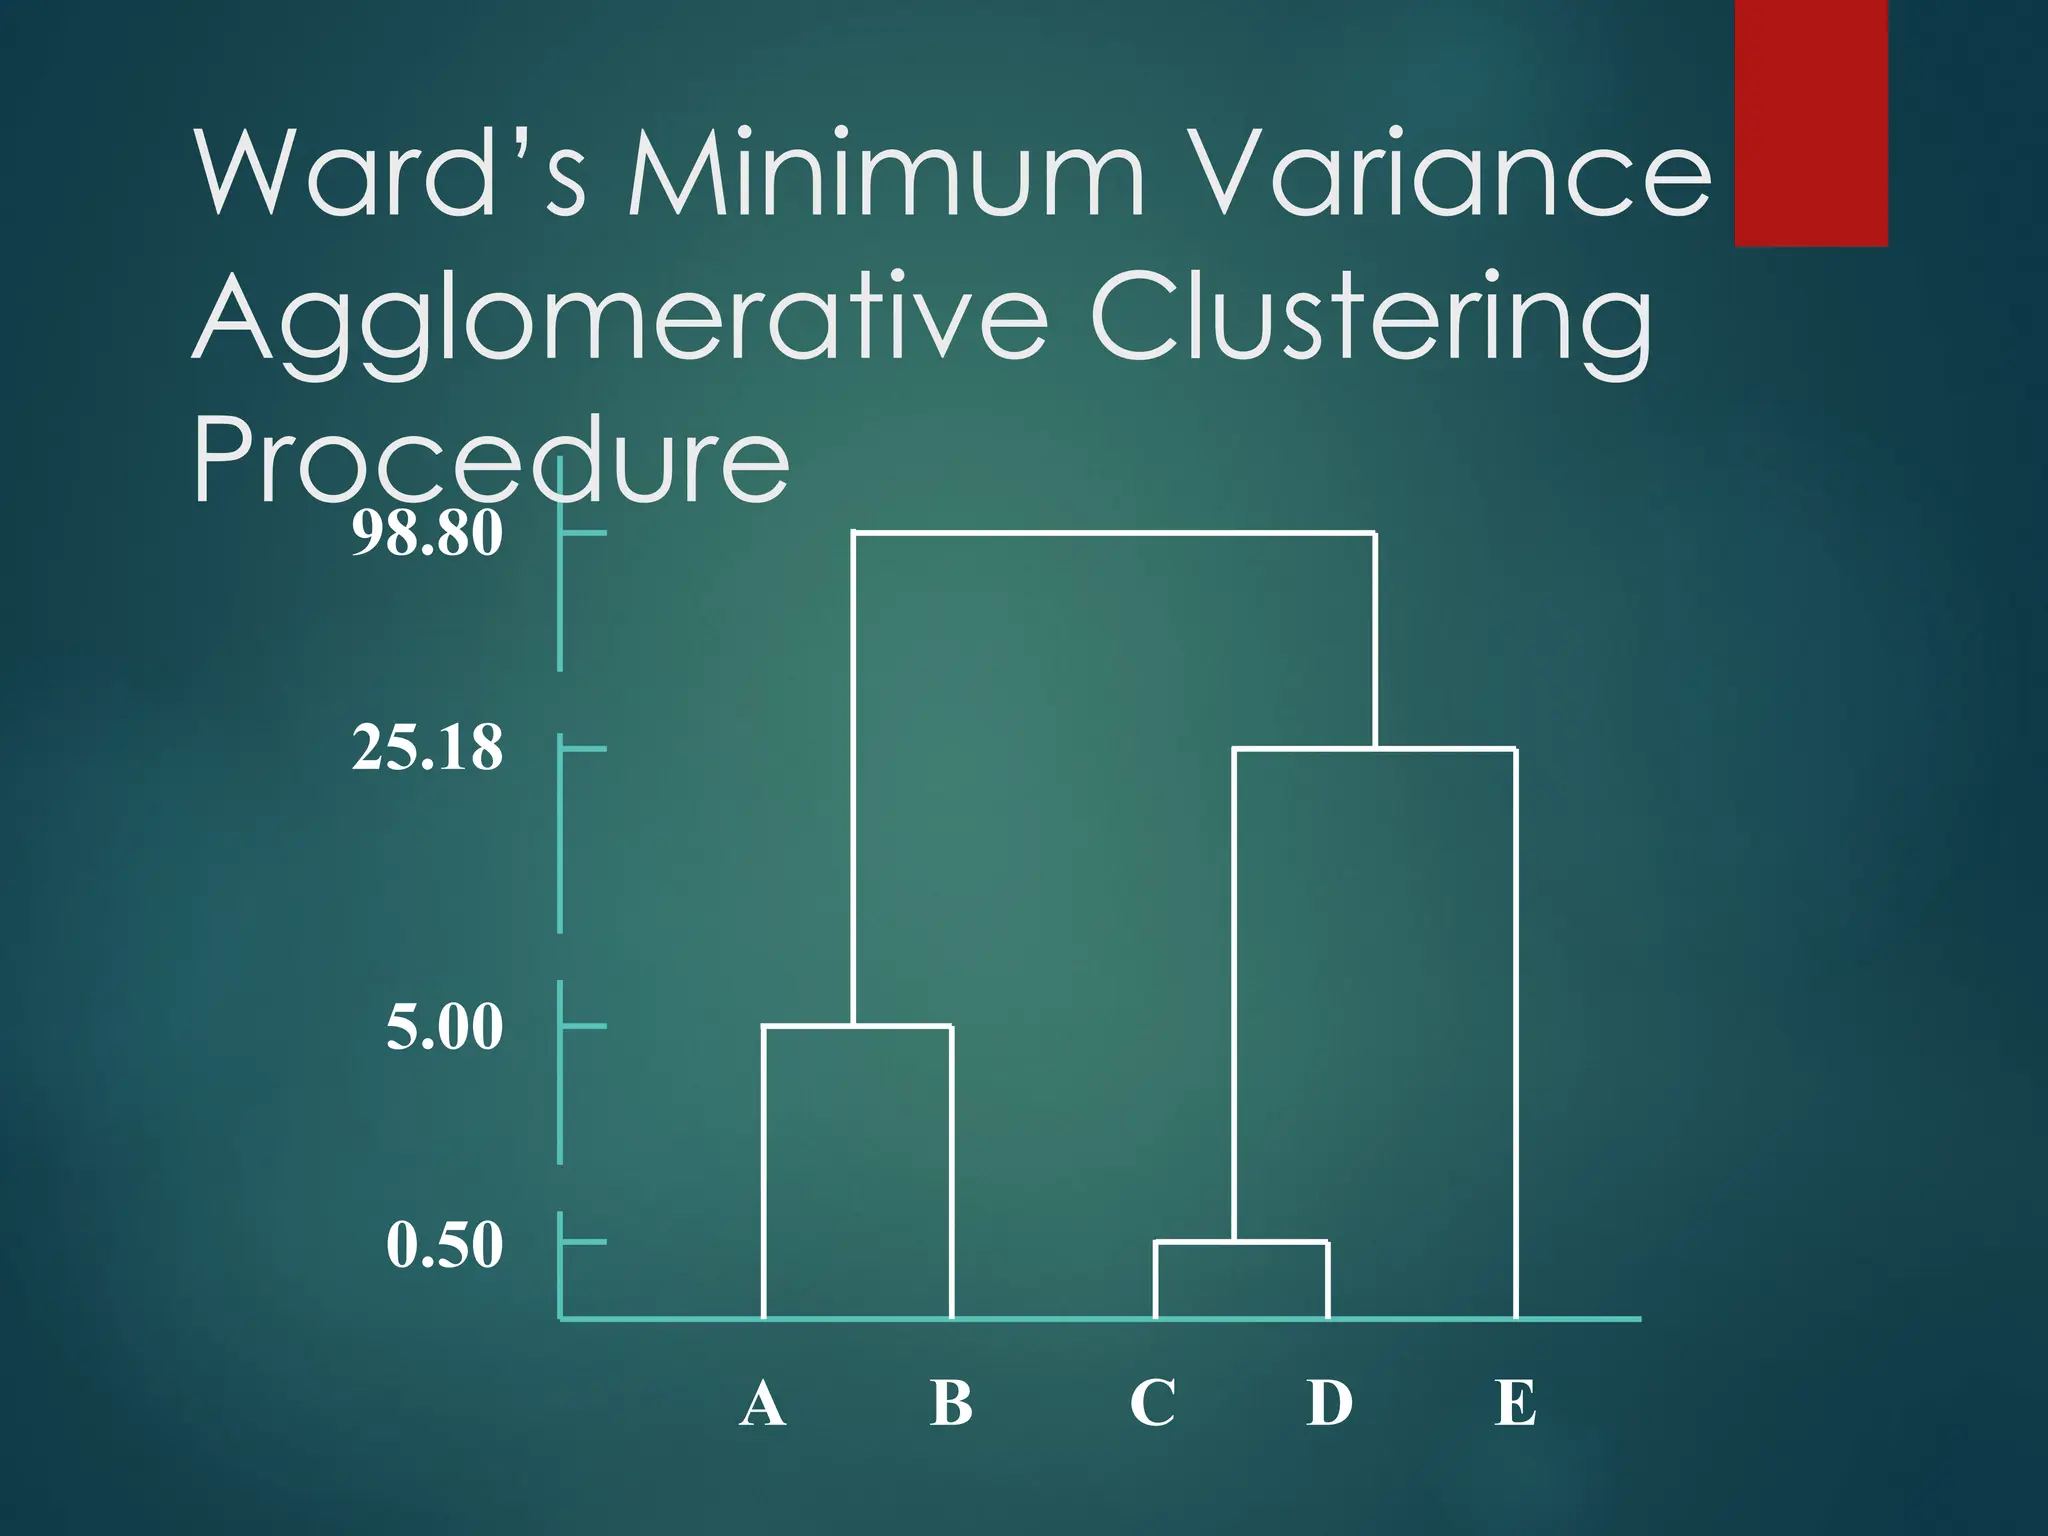
Ward’s Minimum Variance
AgglomerativeClustering
Procedure
First Stage: A = 2 B = 5 C = 9 D = 10 E = 15
Second Stage: AB = 4.5 BD = 12.5
AC = 24.5 BE = 50.0
AD = 32.0 CD = 0.5
AE = 84.5 CE = 18.0
BC = 8.0 DE = 12.5
Third Stage: CDA = 38.0 CDB = 14.0 CDE = 20.66 AB = 5.0
AE = 85.0 BE = 50.5
Fourth Stage: ABCD = 41.0 ABE= 93.17 CDE = 25.18
Fifth Stage: ABCDE = 98.8
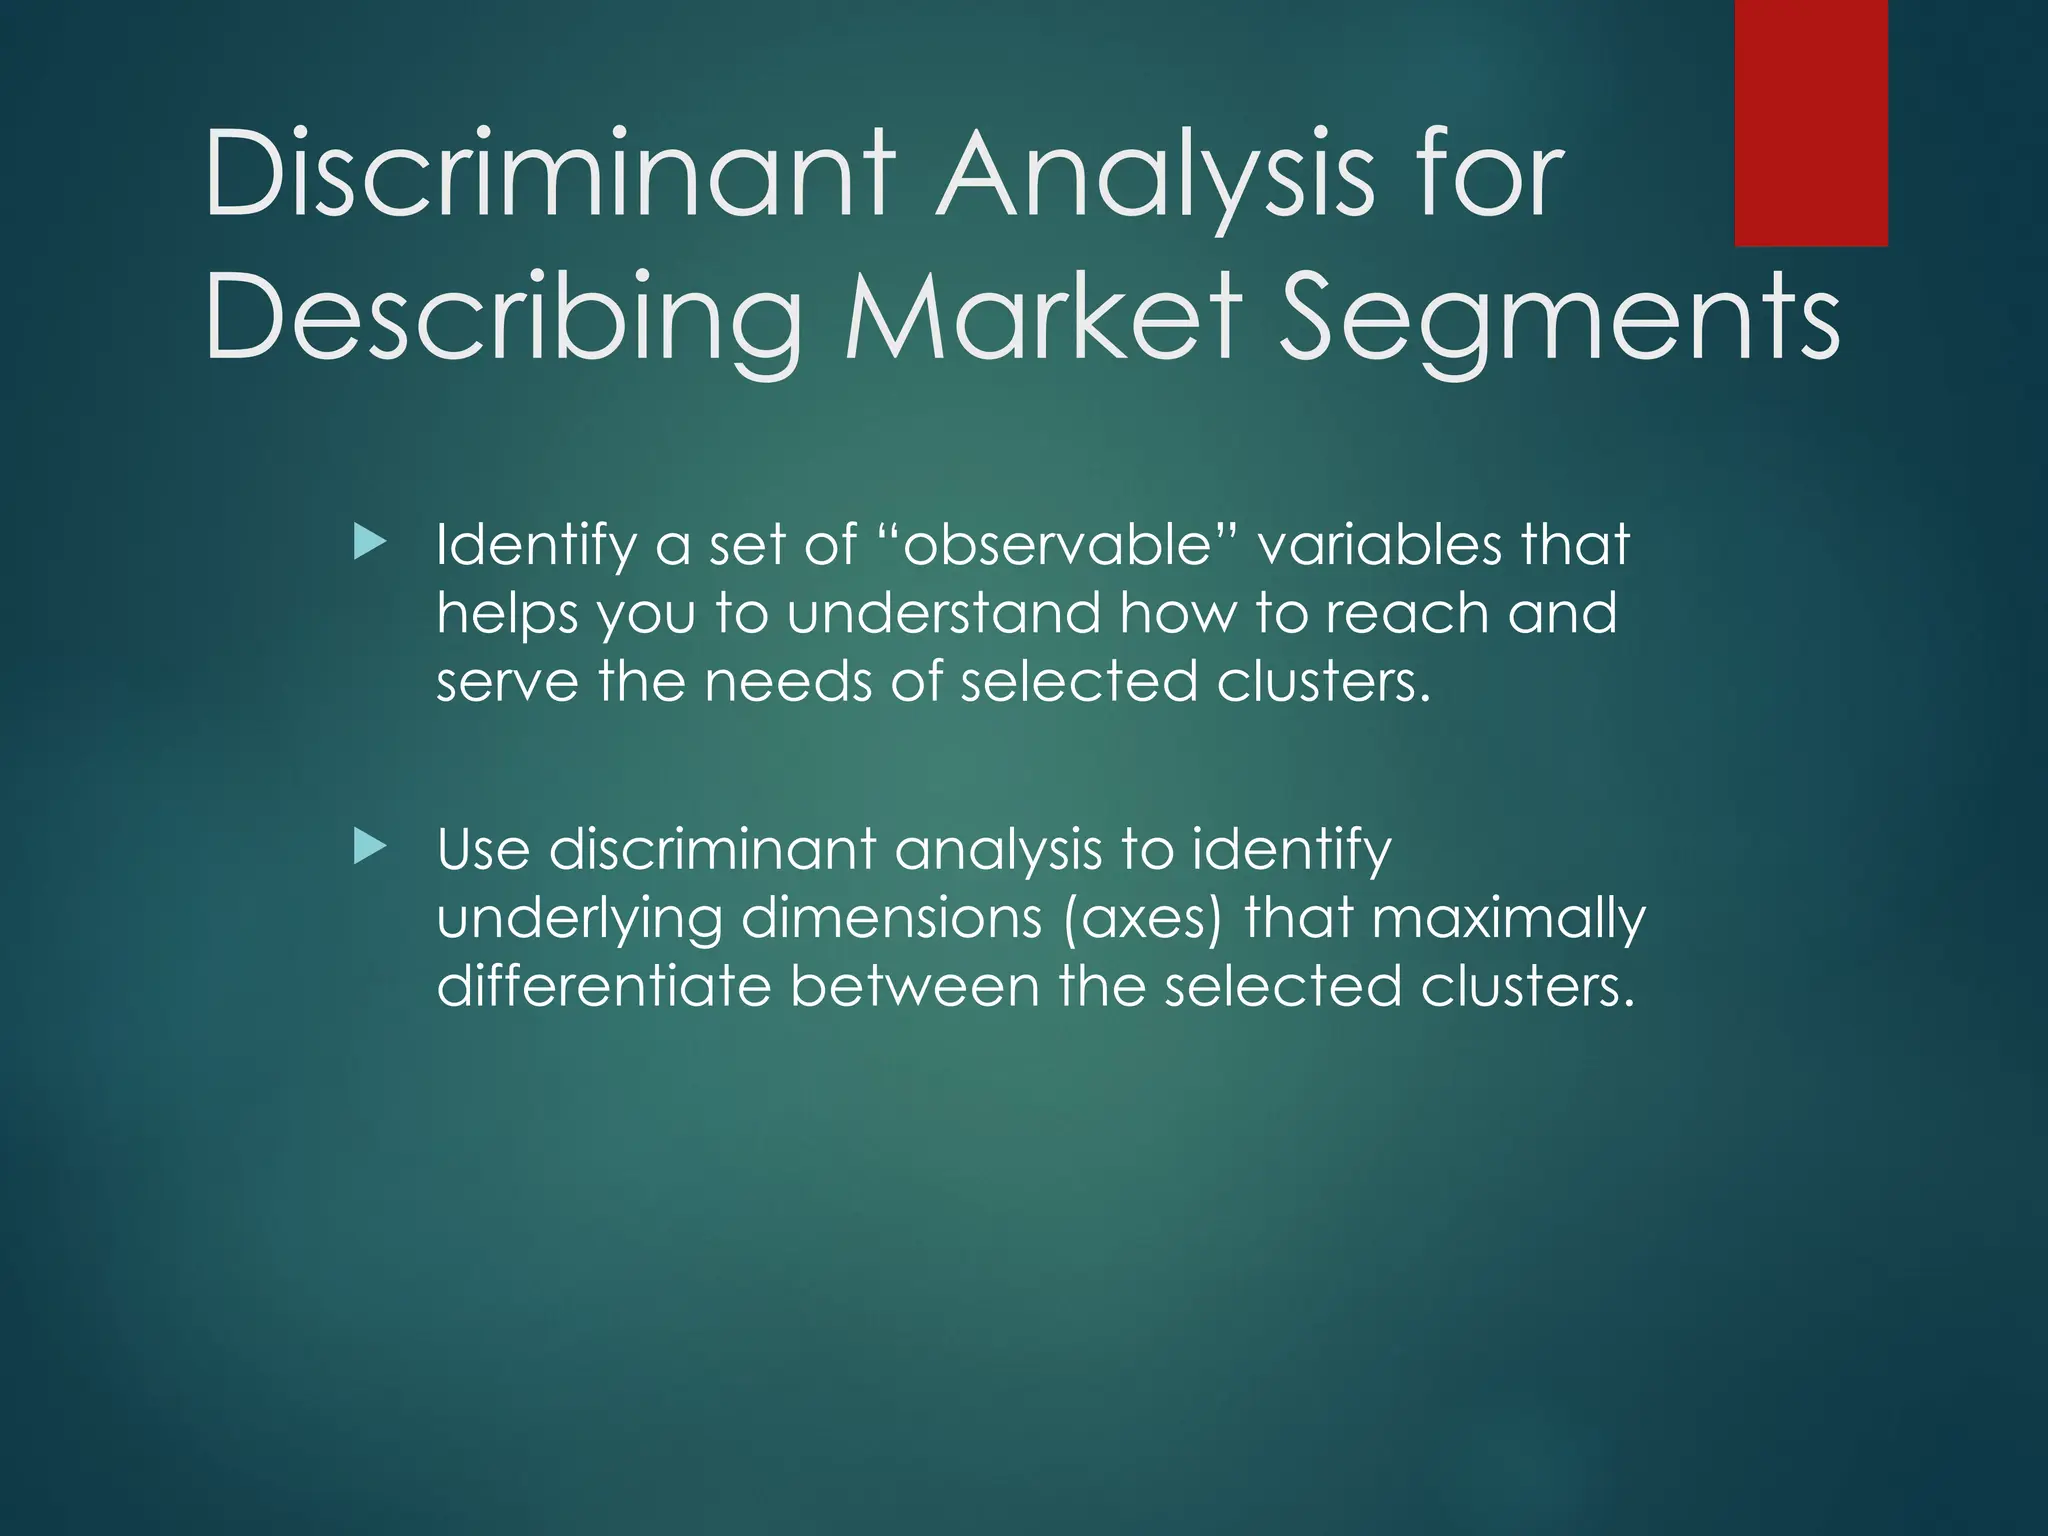
Discriminant Analysis for
DescribingMarket Segments
Identify a set of “observable” variables that
helps you to understand how to reach and
serve the needs of selected clusters.
Use discriminant analysis to identify
underlying dimensions (axes) that maximally
differentiate between the selected clusters.
26.
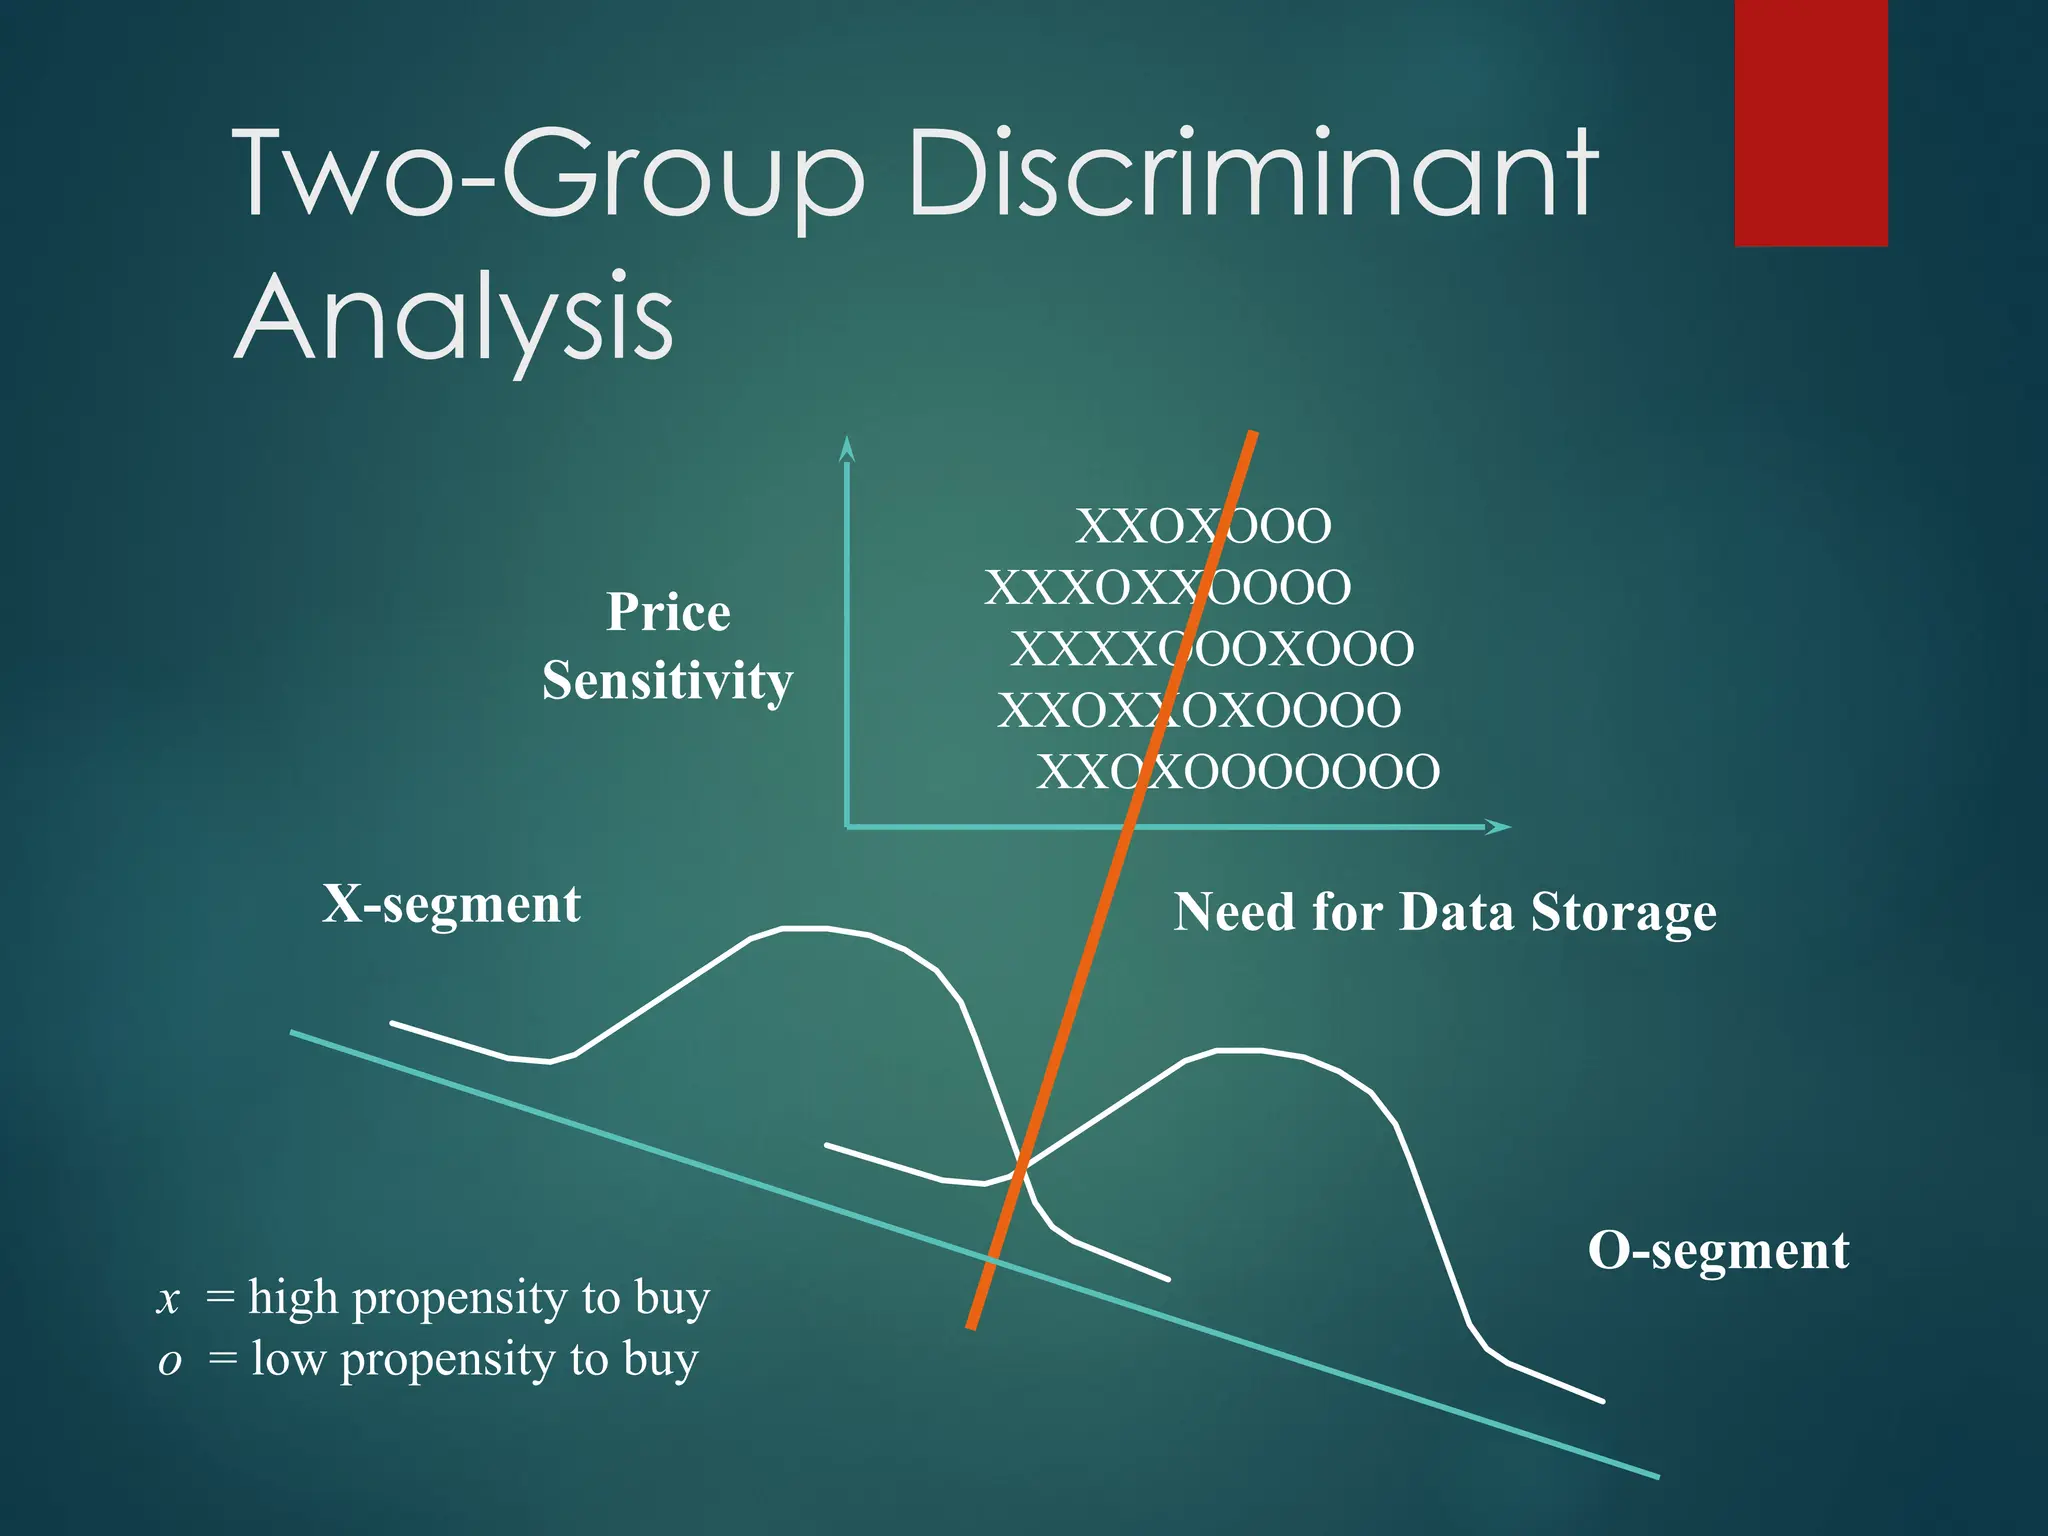
Two-Group Discriminant
Analysis
Need forData Storage
Price
Sensitivity
XXOXOOO
XXXOXXOOOO
XXXXOOOXOOO
XXOXXOXOOOO
XXOXOOOOOOO
X-segment
O-segment
x = high propensity to buy
o = low propensity to buy
27.
Interpreting Discriminant
Analysis Results
What proportion of the total variance in the descriptor data is
explained by the statistically significant discriminant axes?
Does the model have good predictability (“hit rate”) in each
cluster?
Can you identify good descriptors to find differences
between clusters? (Examine correlations between
discriminant axes and each descriptor variable).
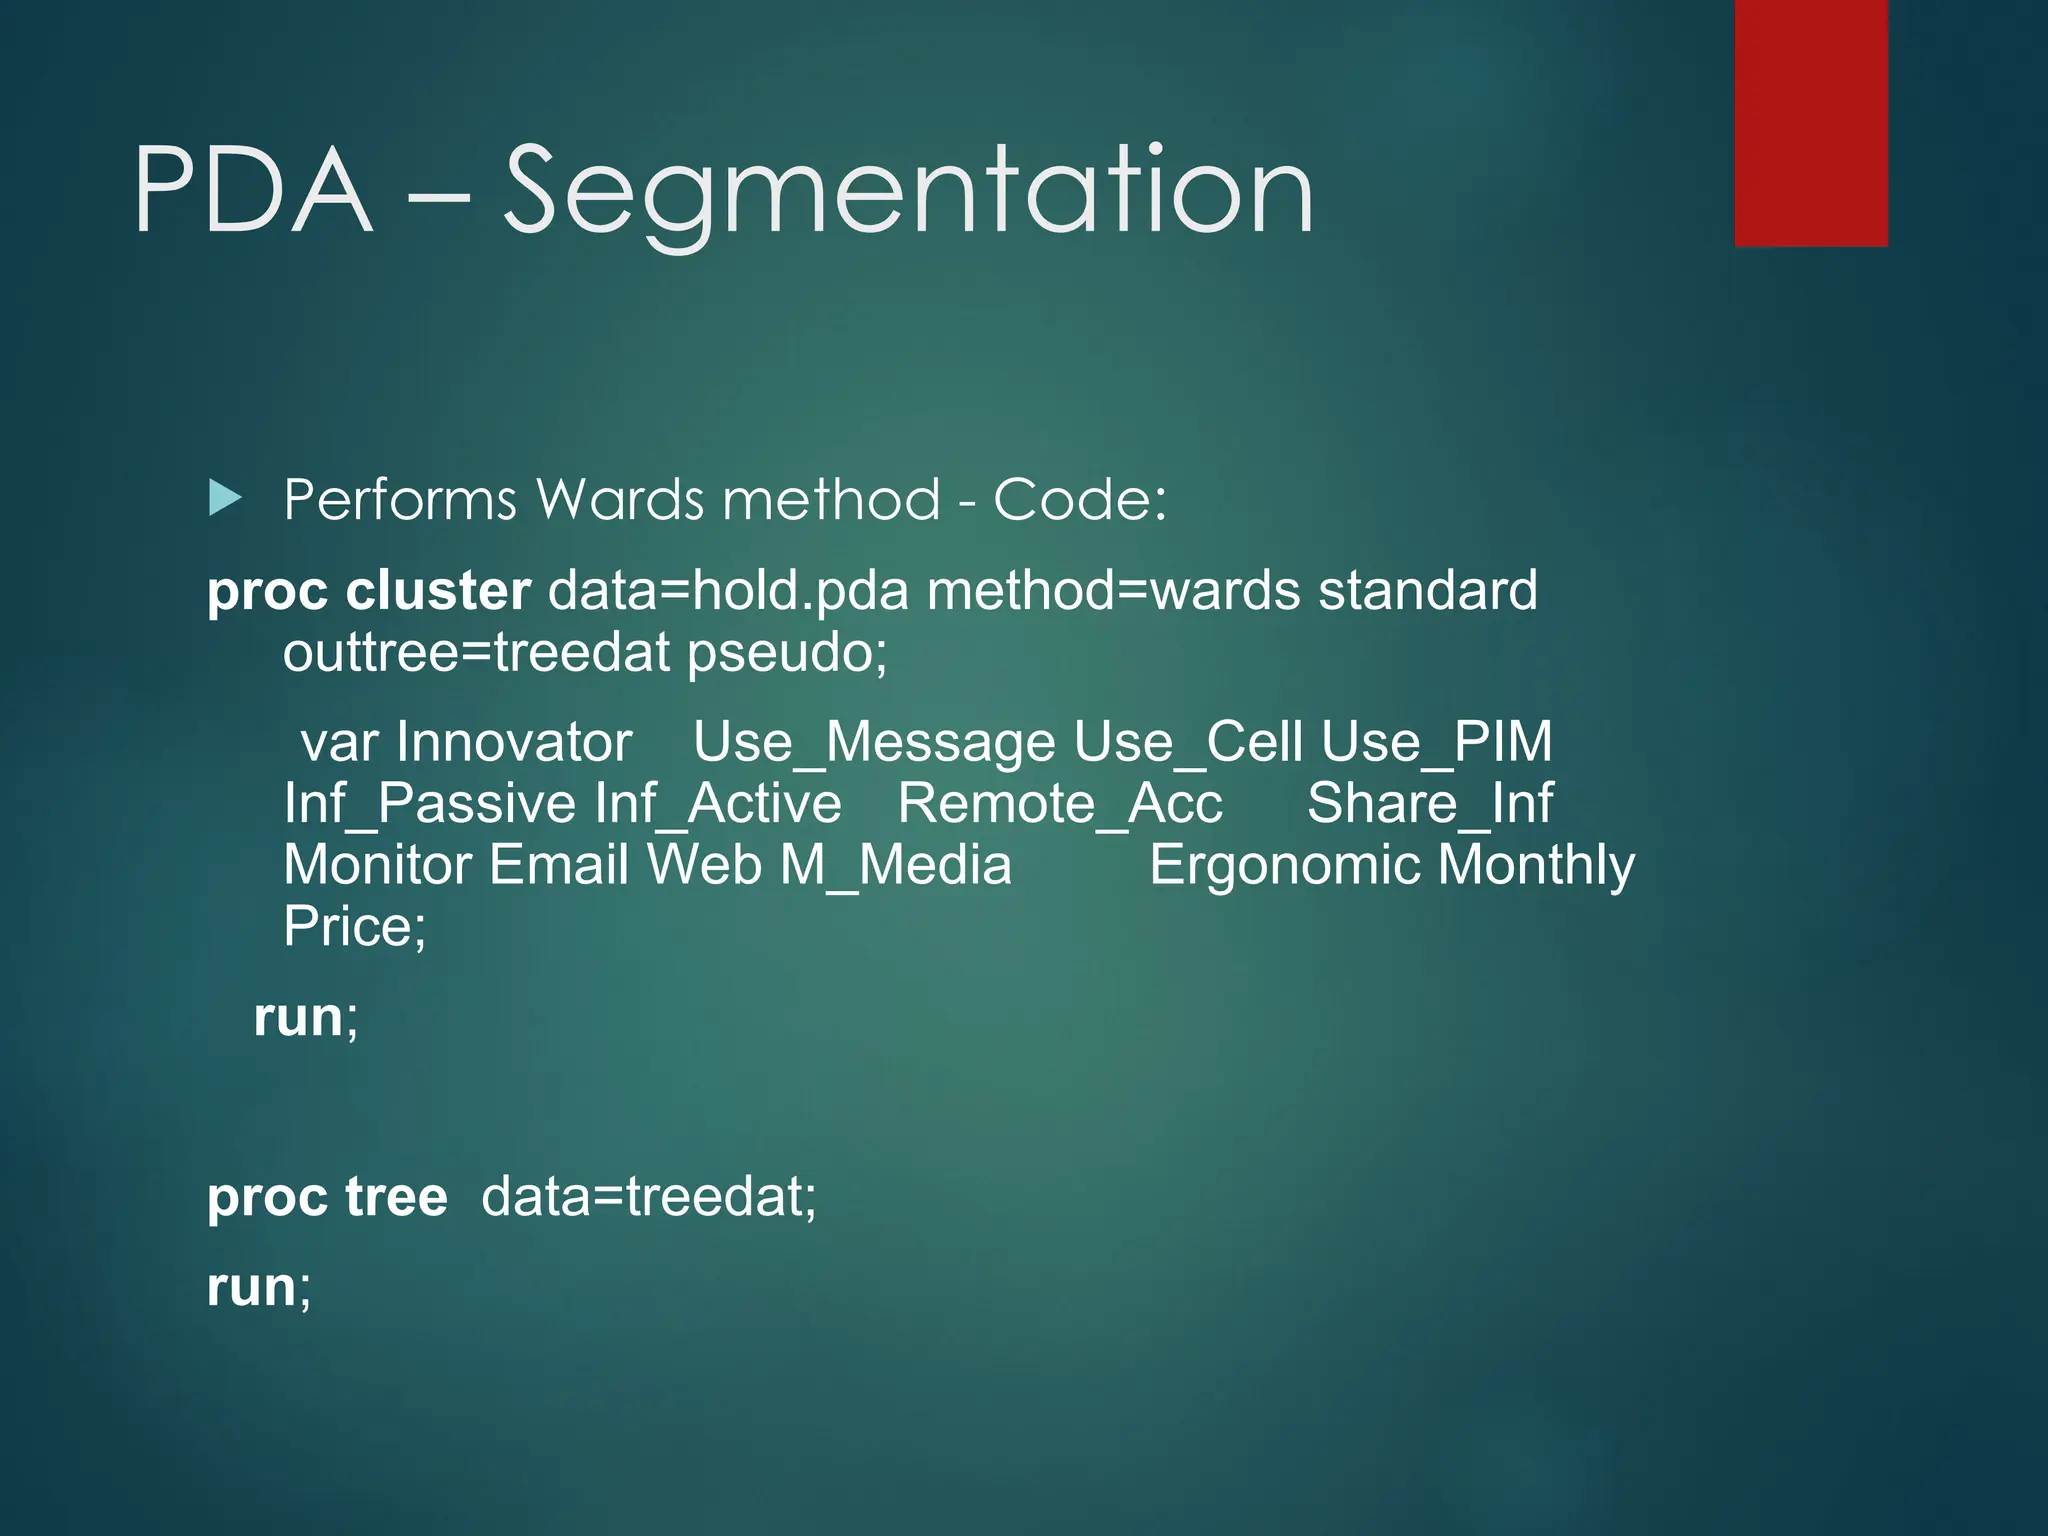
PDA – Segmentation
Performs Wards method - Code:
proc cluster data=hold.pda method=wards standard
outtree=treedat pseudo;
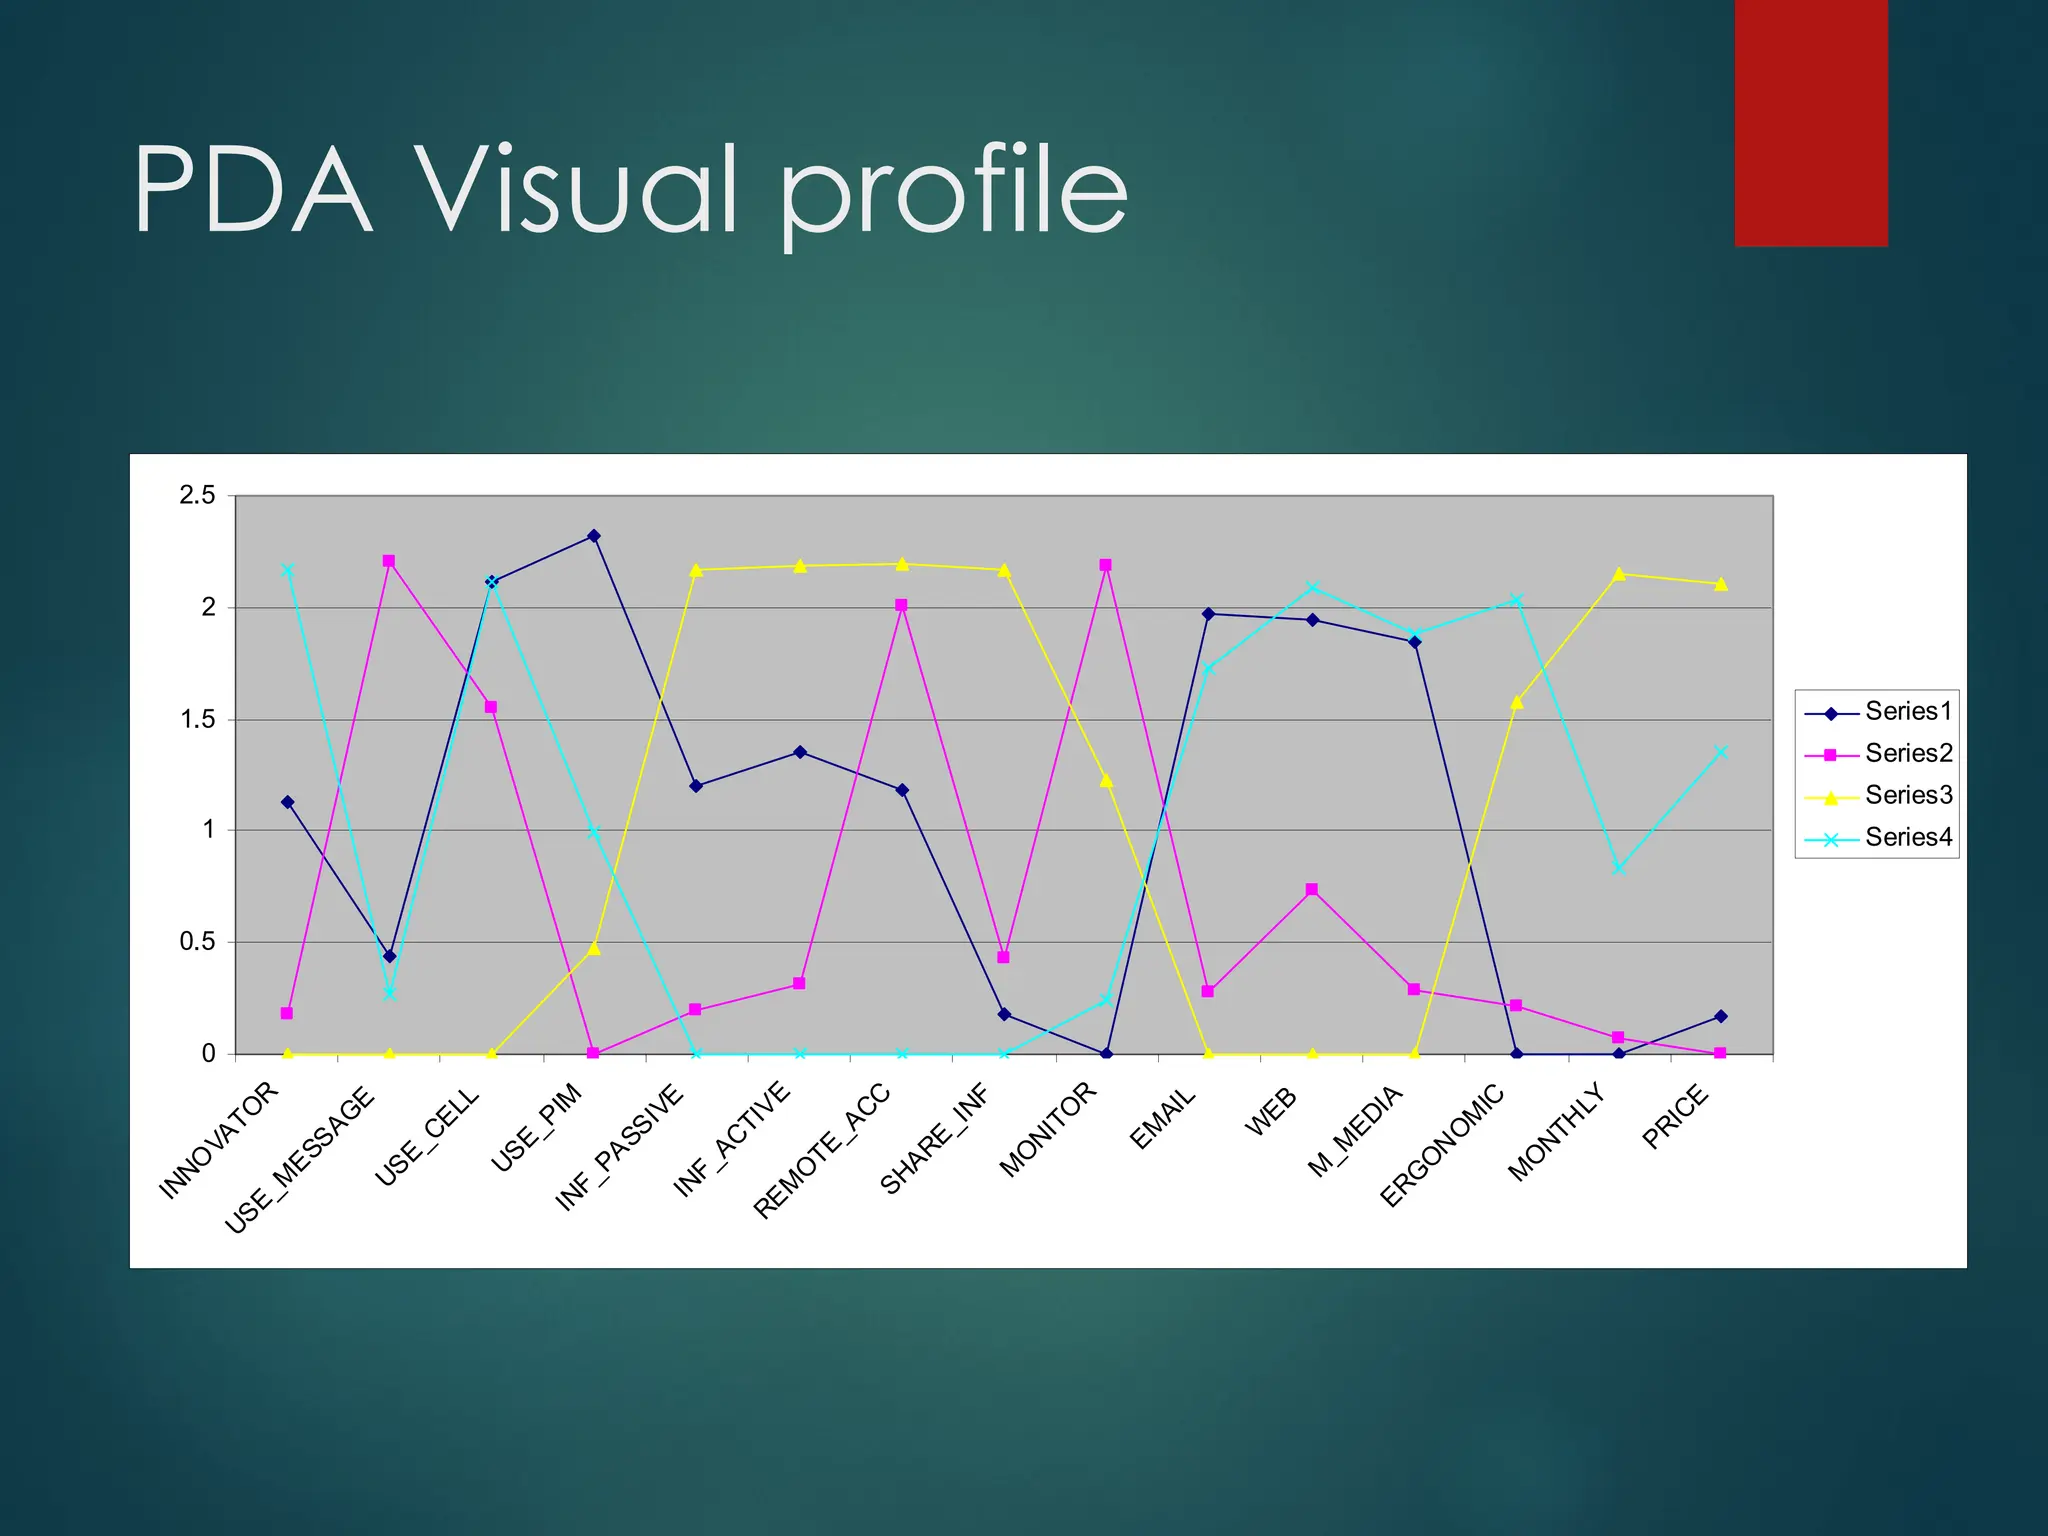
var Innovator Use_Message Use_Cell Use_PIM
Inf_Passive Inf_Active Remote_Acc Share_Inf
Monitor Email Web M_Media Ergonomic Monthly
Price;
run;
proc tree data=treedat;
run;
30.
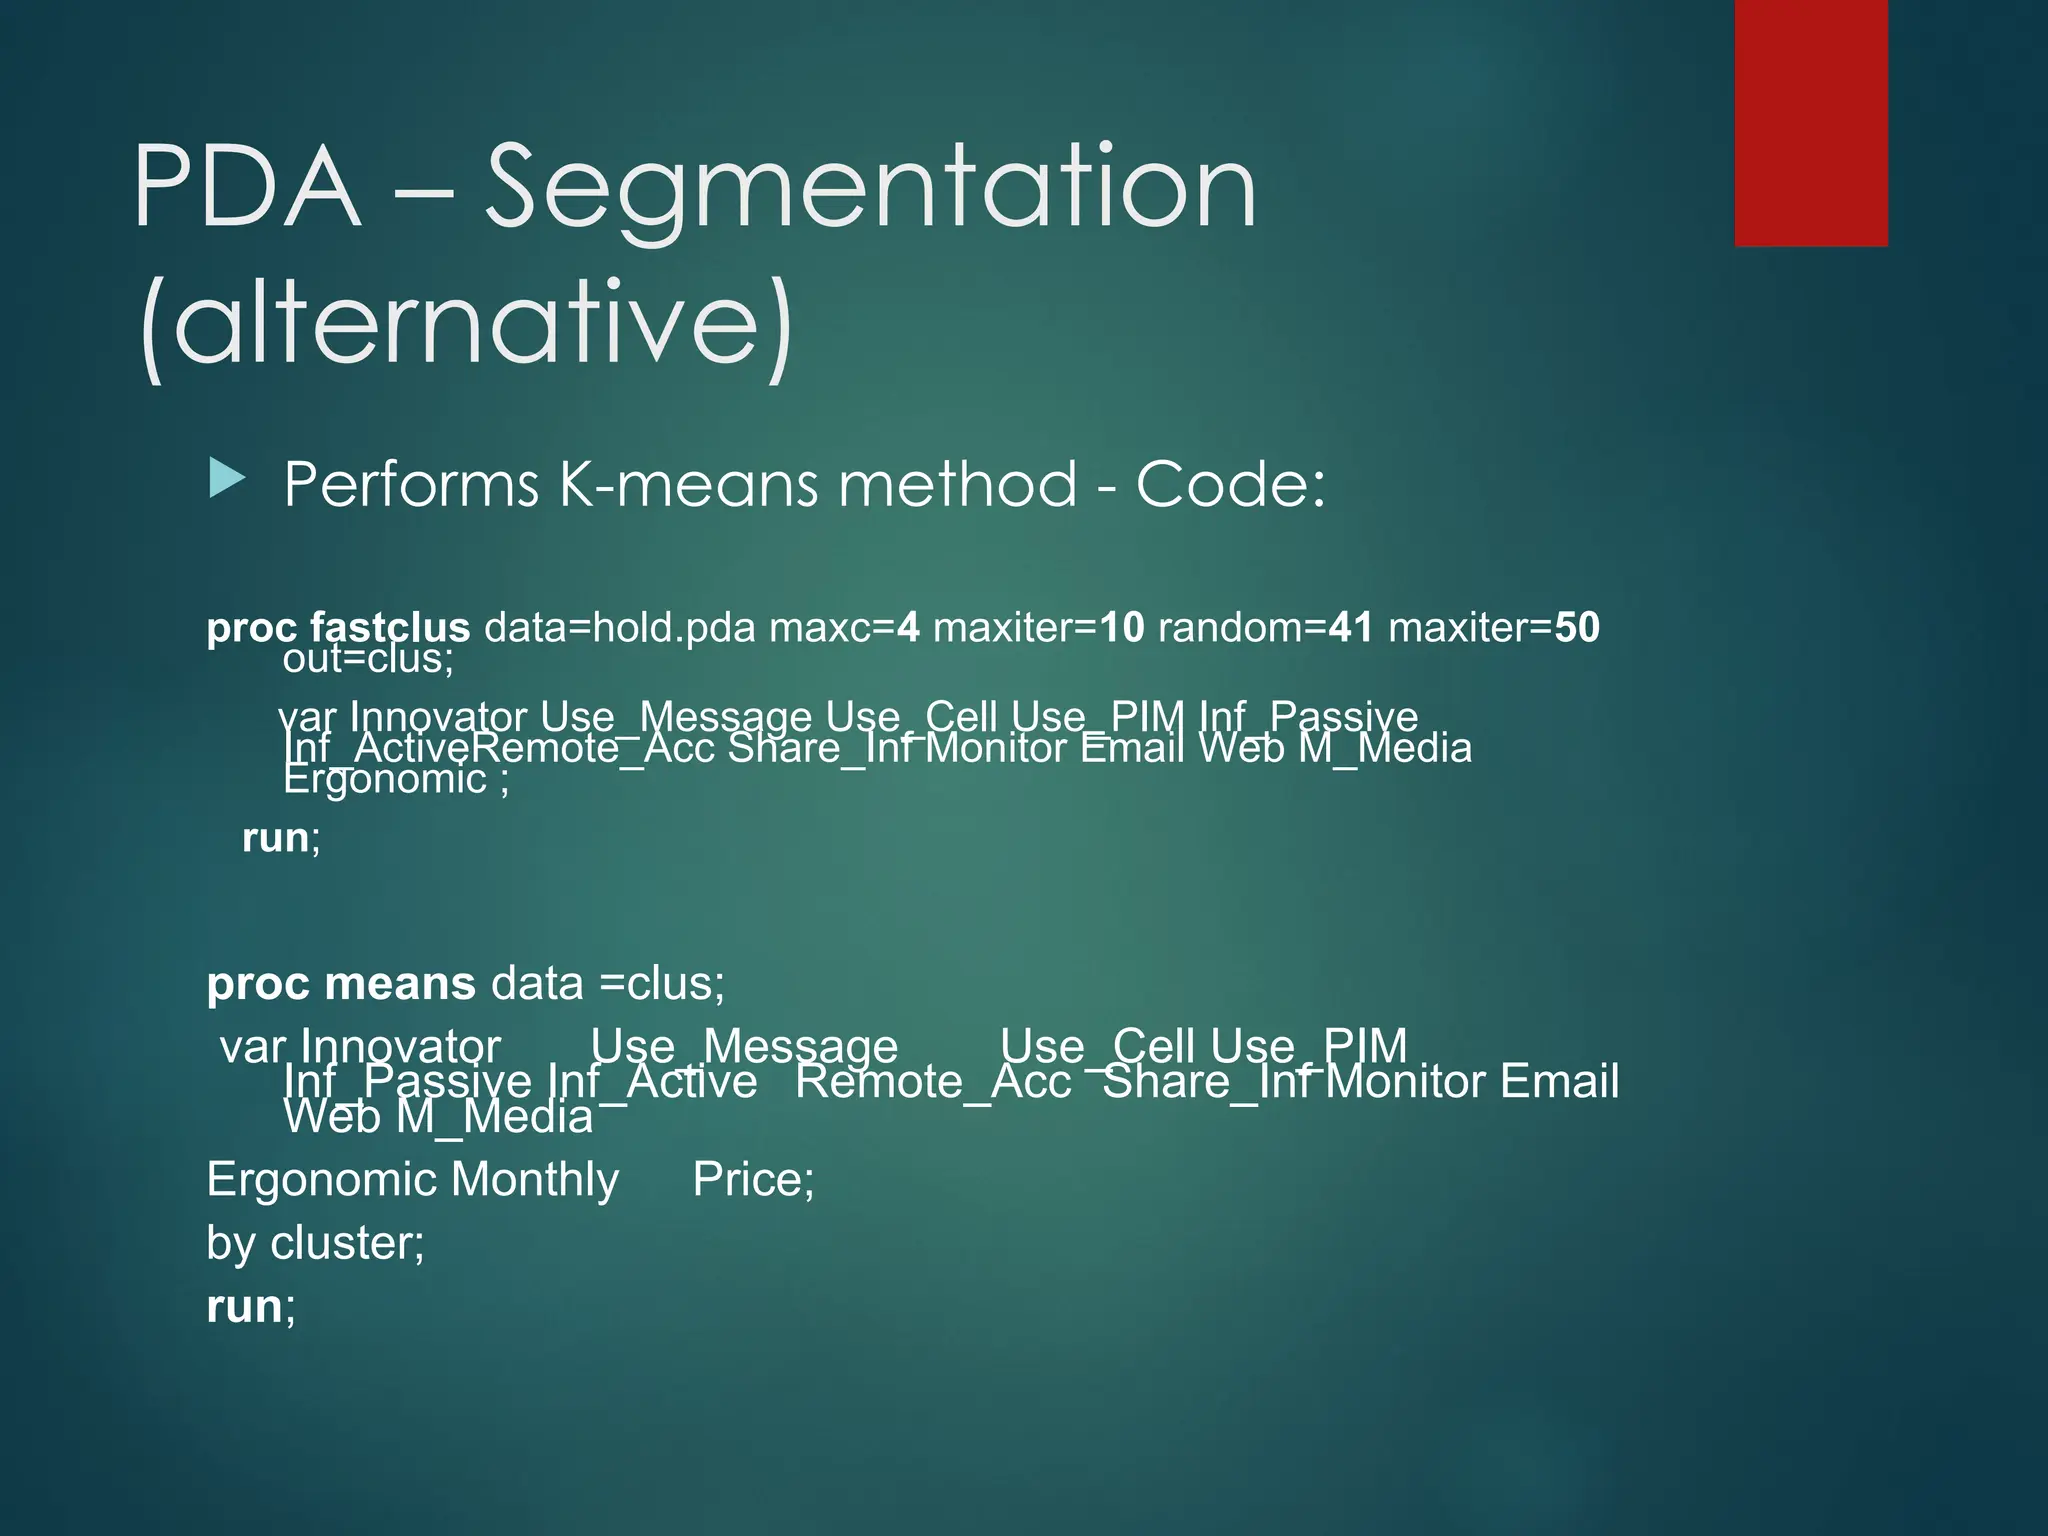
PDA – Segmentation
(alternative)
Performs K-means method - Code:
proc fastclus data=hold.pda maxc=4 maxiter=10 random=41 maxiter=50
out=clus;
var Innovator Use_Message Use_Cell Use_PIM Inf_Passive
Inf_ActiveRemote_Acc Share_Inf Monitor Email Web M_Media
Ergonomic ;
run;
proc means data =clus;
var Innovator Use_Message Use_Cell Use_PIM
Inf_Passive Inf_Active Remote_Acc Share_Inf Monitor Email
Web M_Media
Ergonomic Monthly Price;
by cluster;
run;
31.
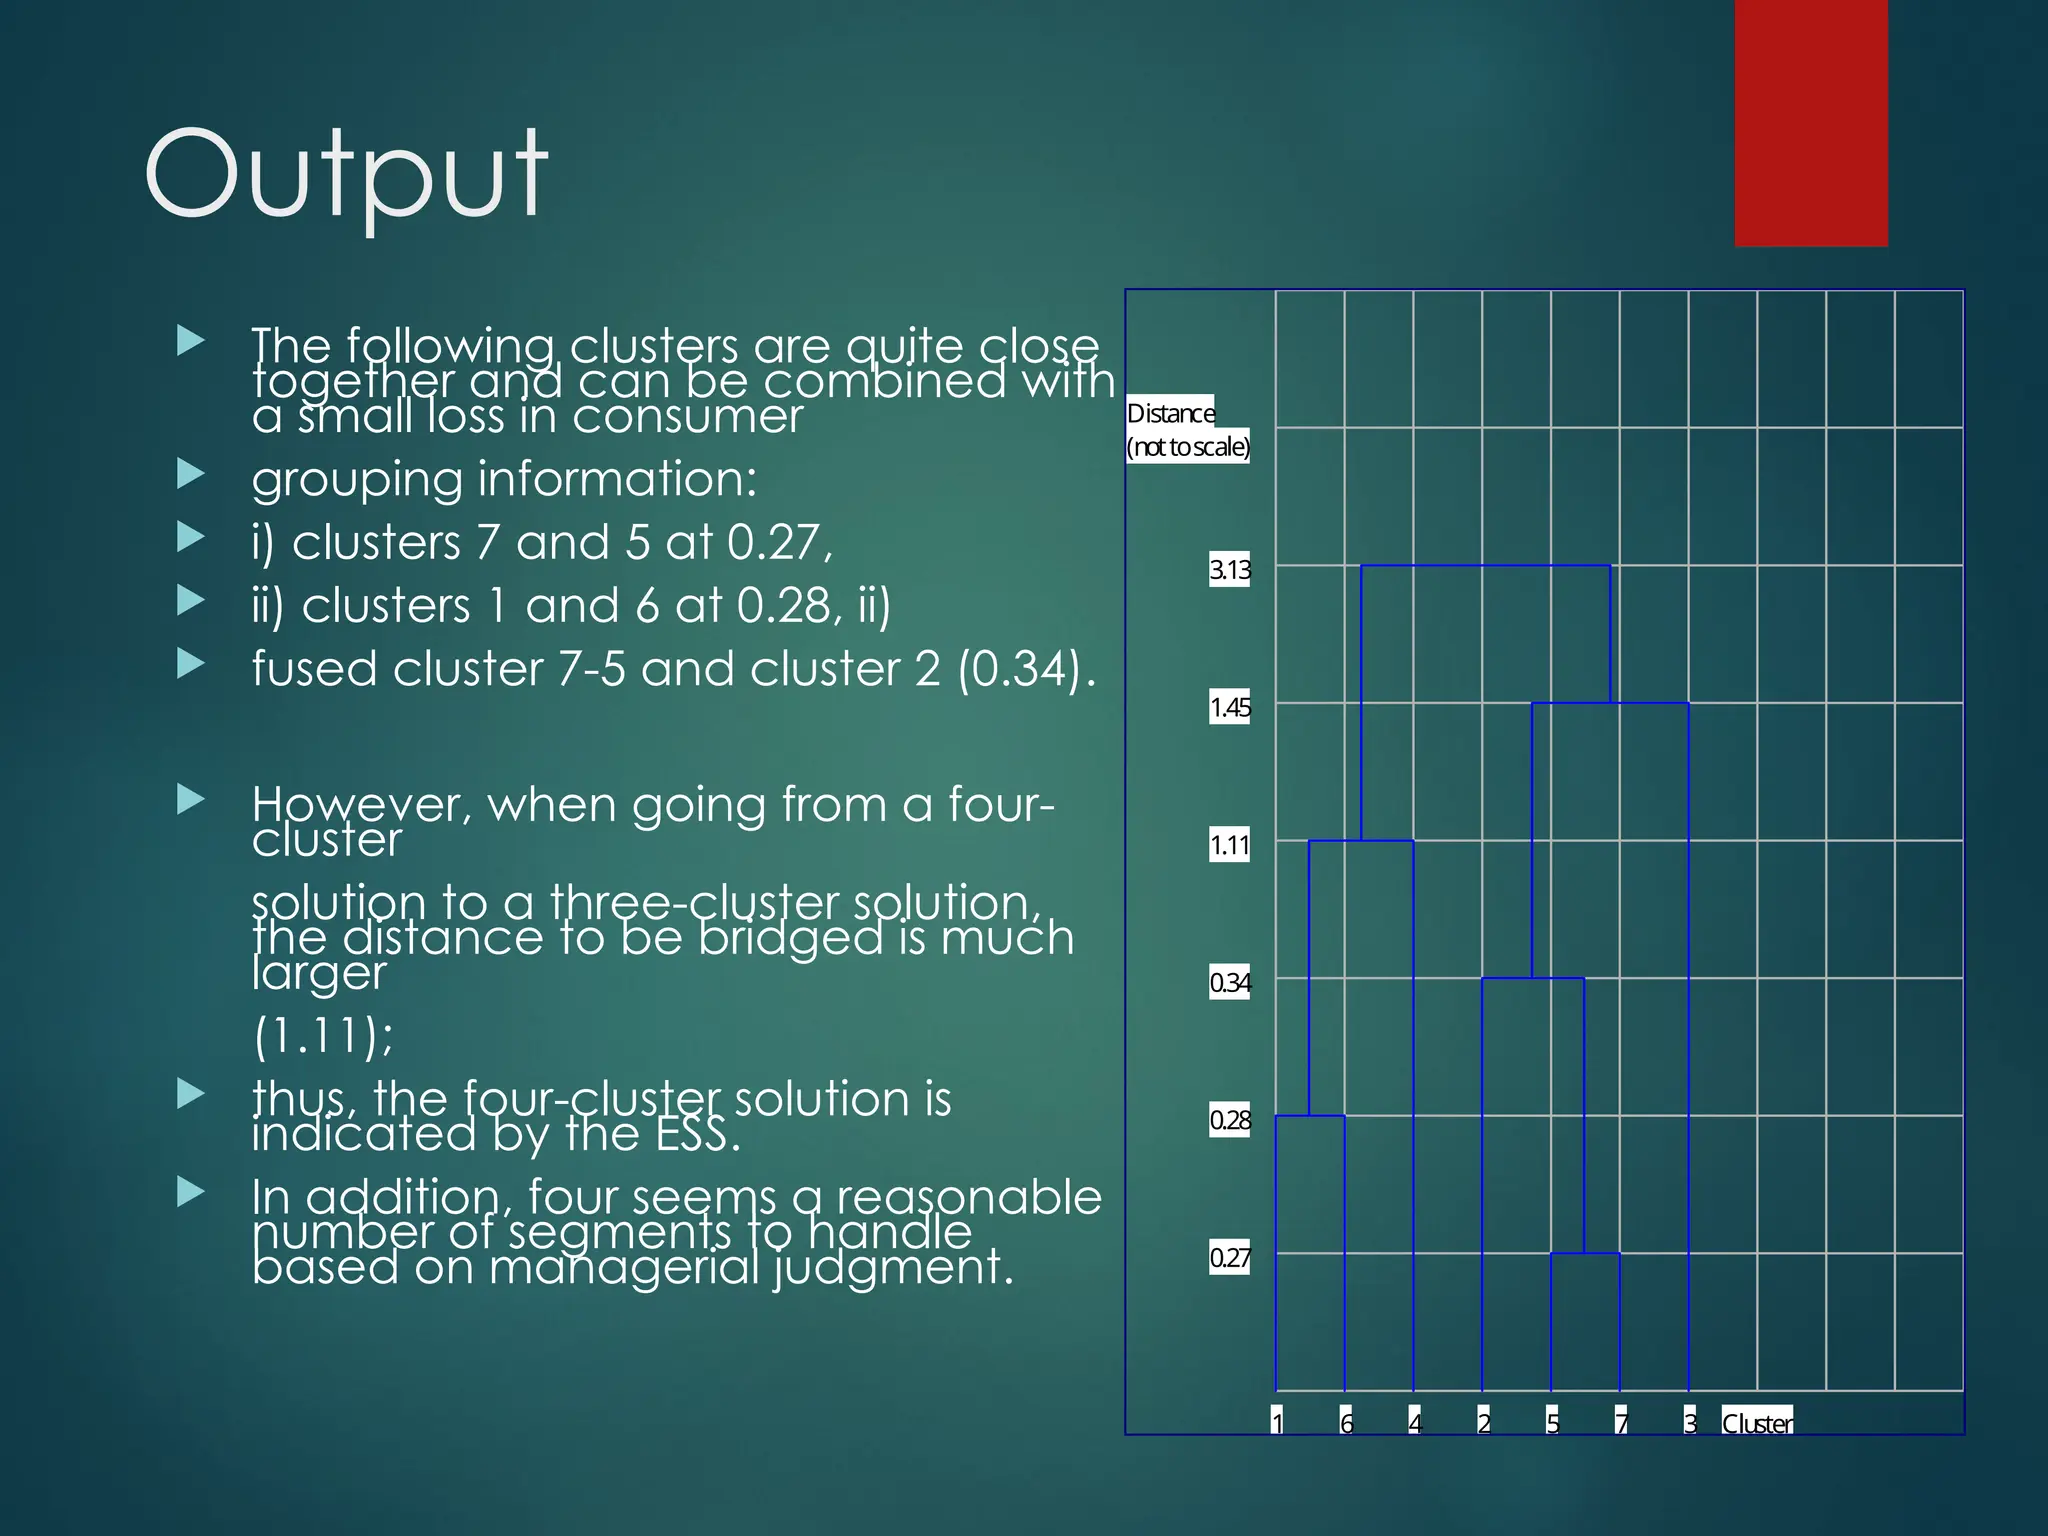
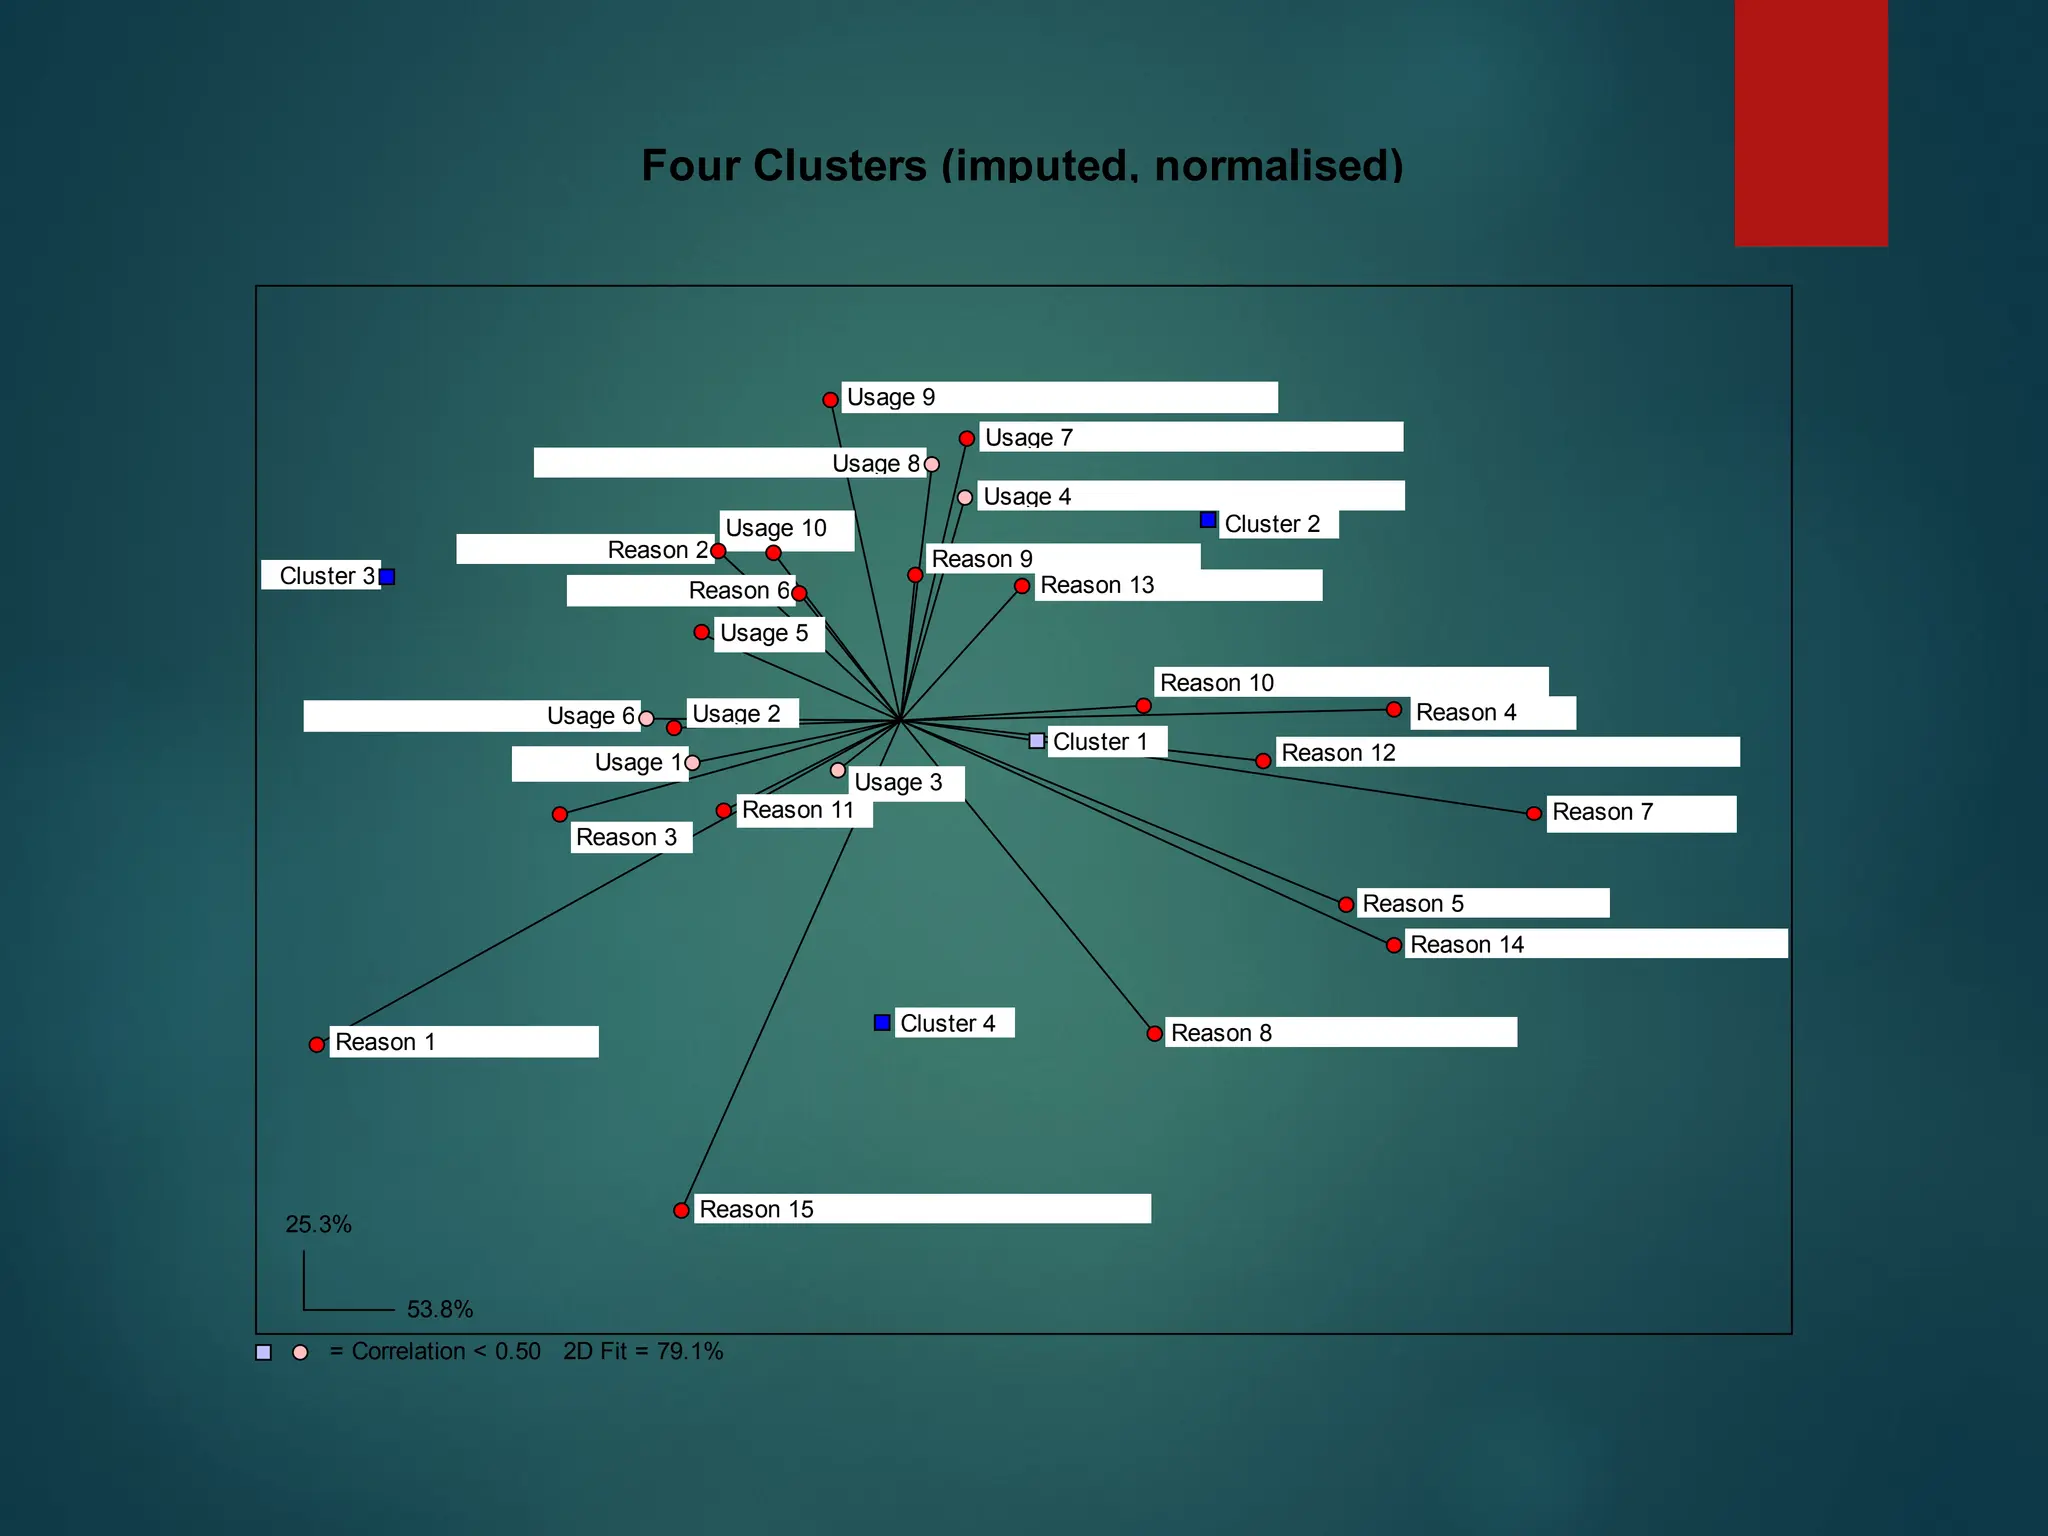
Output
The followingclusters are quite close
together and can be combined with
a small loss in consumer
grouping information:
i) clusters 7 and 5 at 0.27,
ii) clusters 1 and 6 at 0.28, ii)
fused cluster 7-5 and cluster 2 (0.34).
However, when going from a four-
cluster
solution to a three-cluster solution,
the distance to be bridged is much
larger
(1.11);
thus, the four-cluster solution is
indicated by the ESS.
In addition, four seems a reasonable
number of segments to handle
based on managerial judgment. 0.27
0.28
0.34
1.11
1.45
3.13
7
6 5
4 3
2
1 Cluster
(nottoscale)
Distance
32.
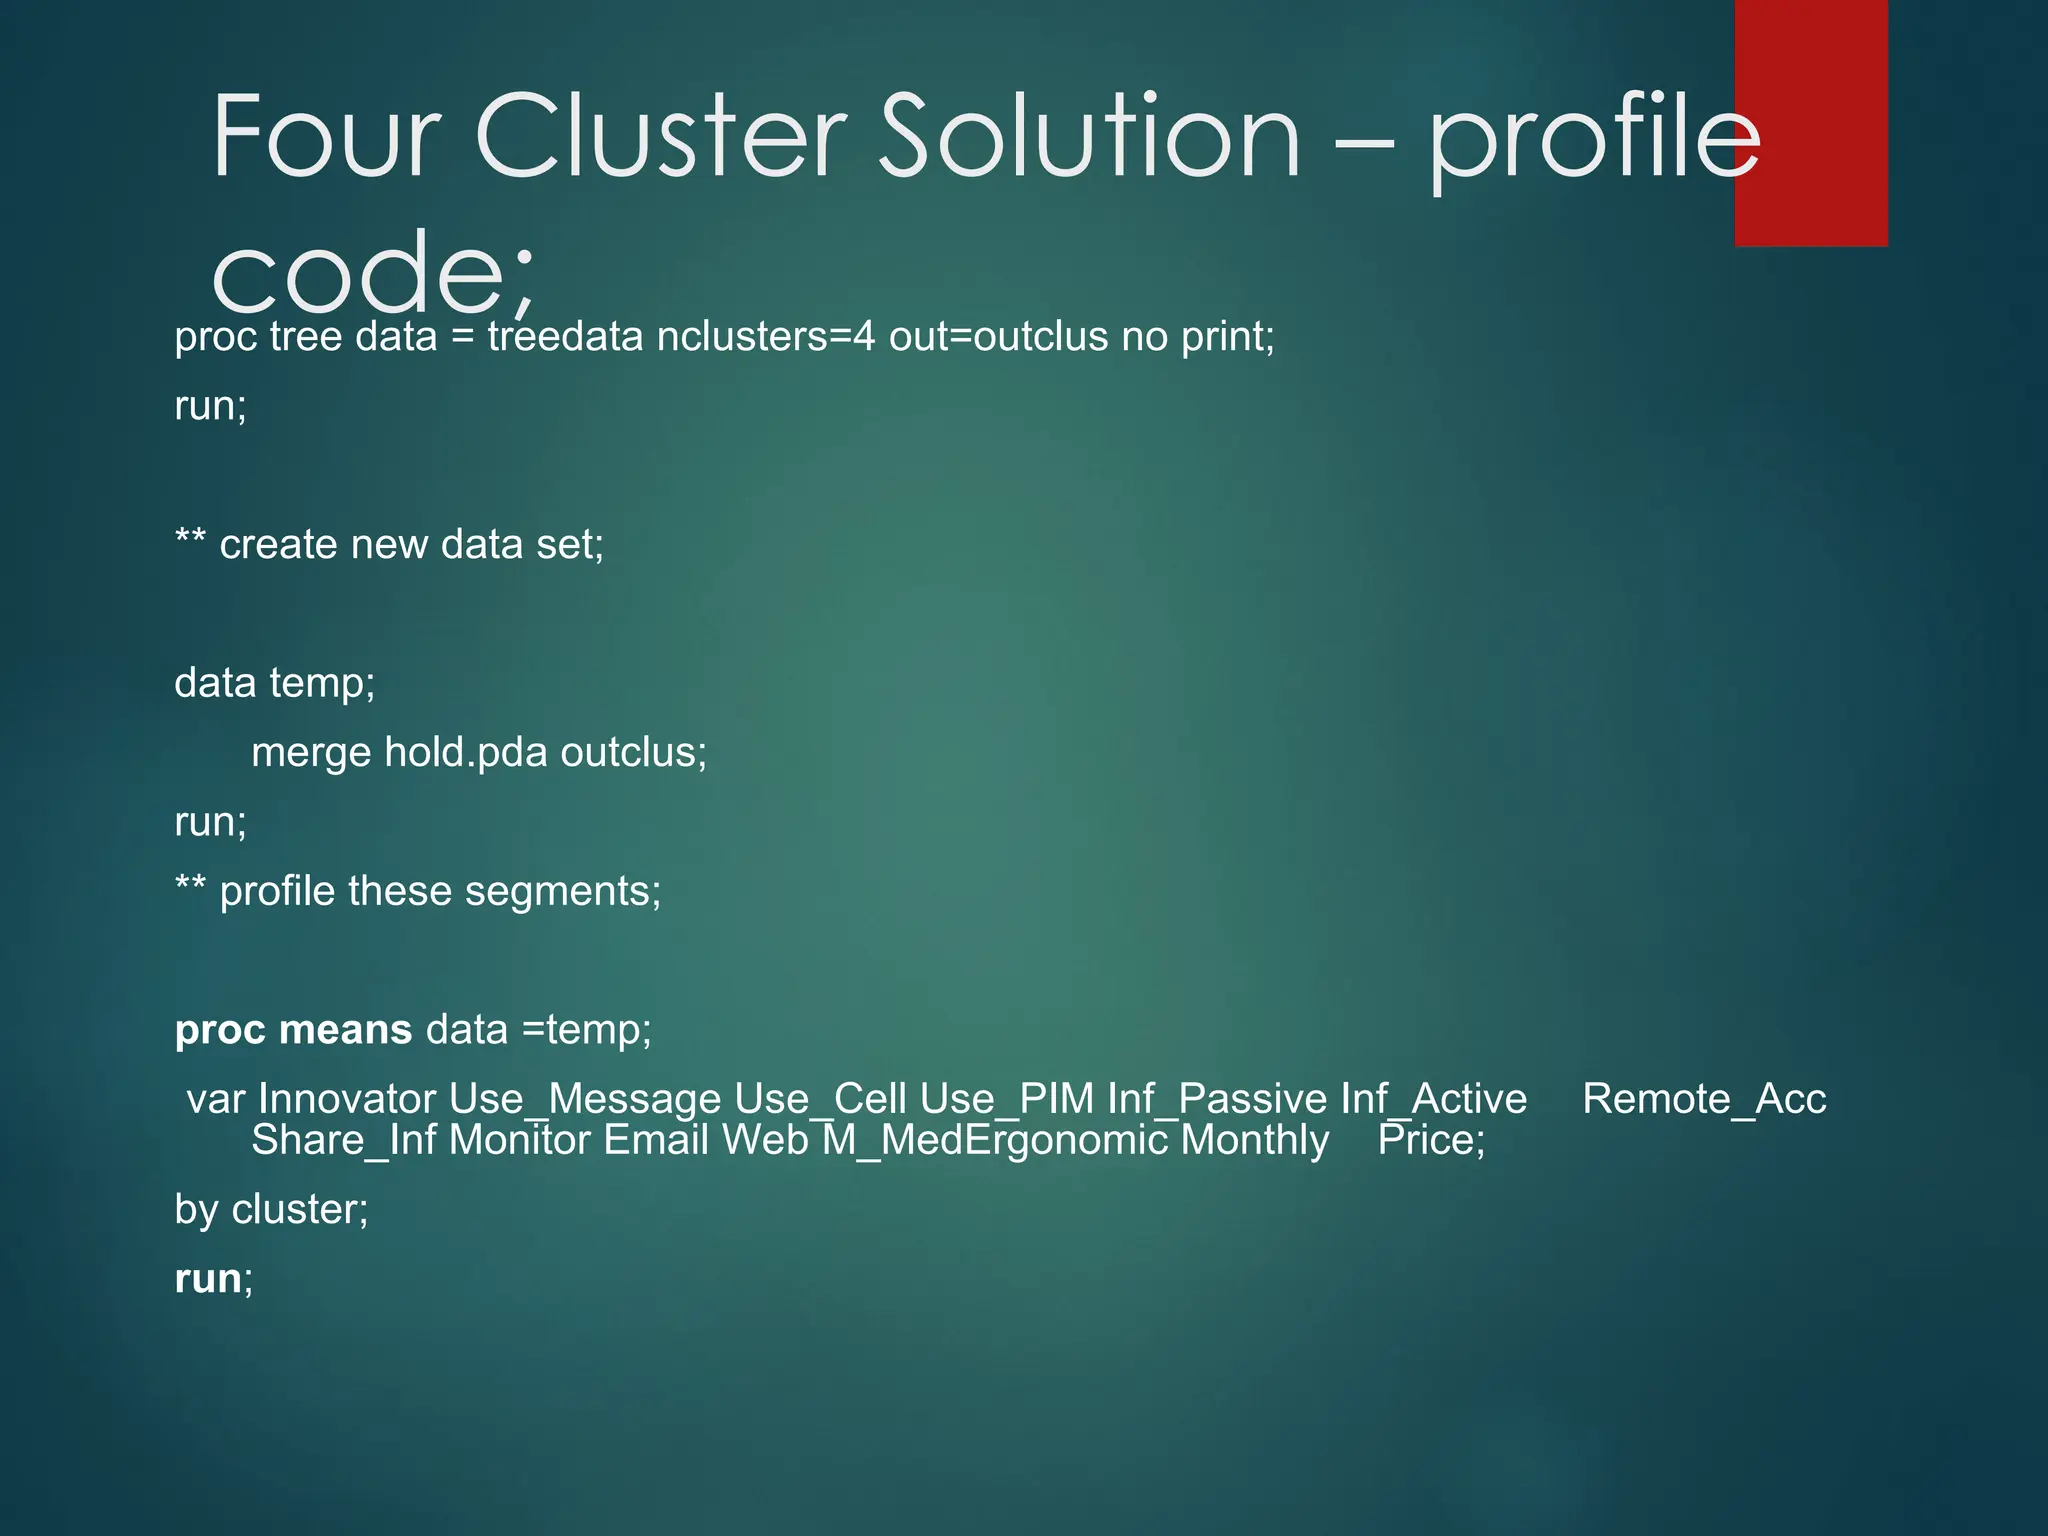
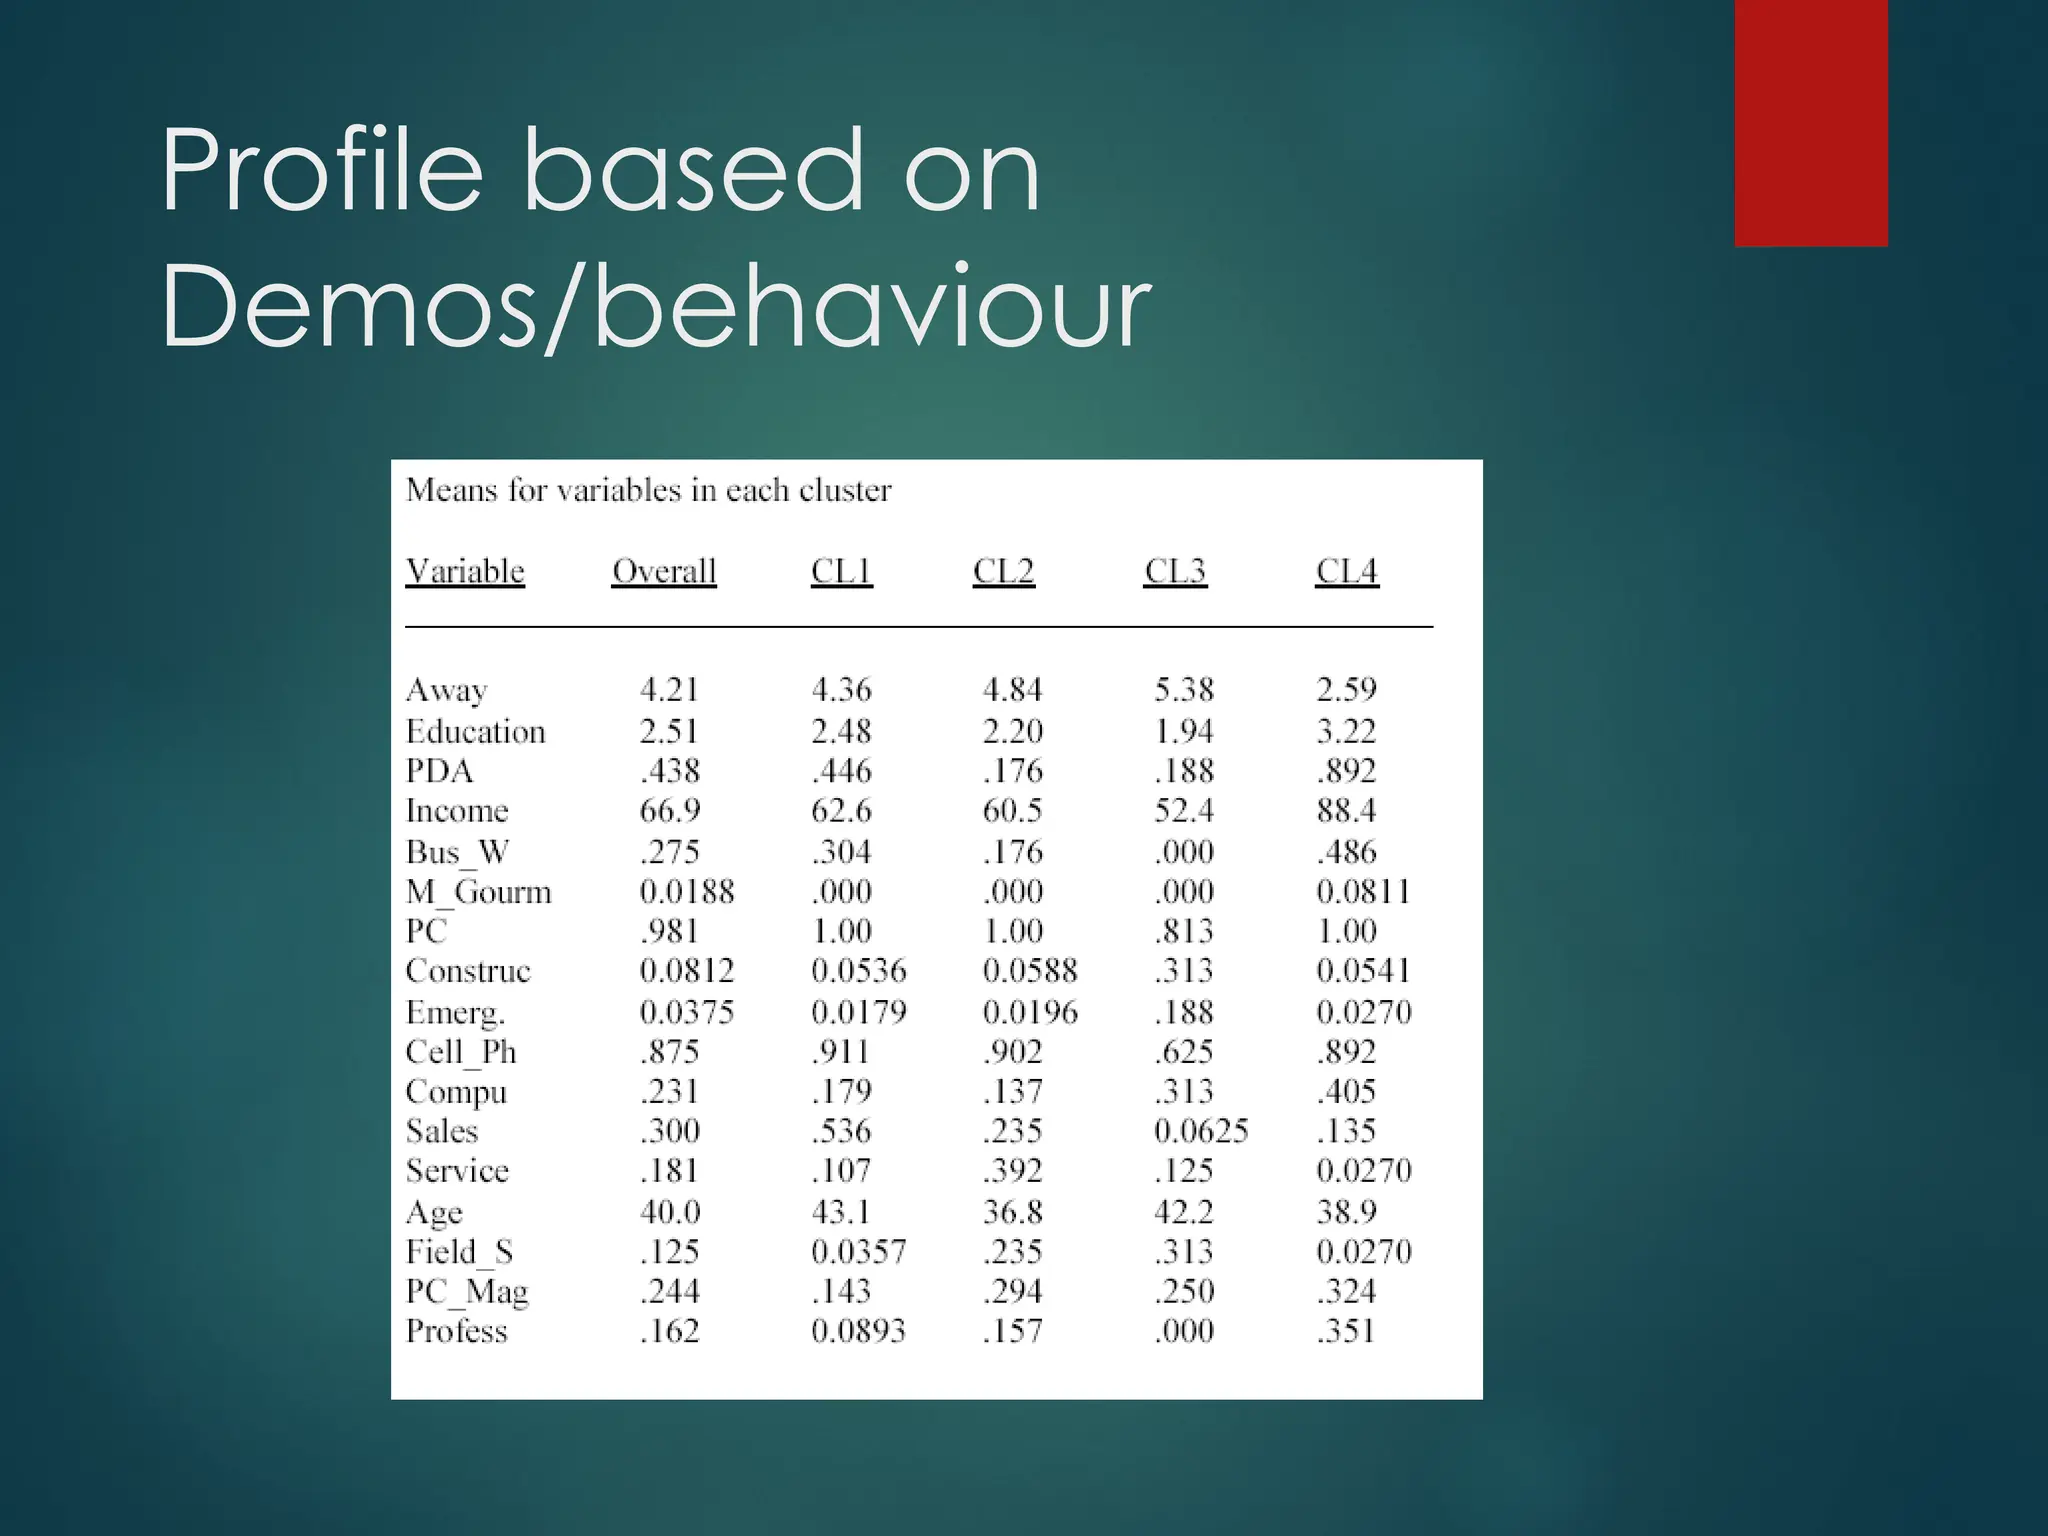
Four Cluster Solution– profile
code;
proc tree data = treedata nclusters=4 out=outclus no print;
run;
** create new data set;
data temp;
merge hold.pda outclus;
run;
** profile these segments;
proc means data =temp;
var Innovator Use_Message Use_Cell Use_PIM Inf_Passive Inf_Active Remote_Acc
Share_Inf Monitor Email Web M_MedErgonomic Monthly Price;
by cluster;
run;
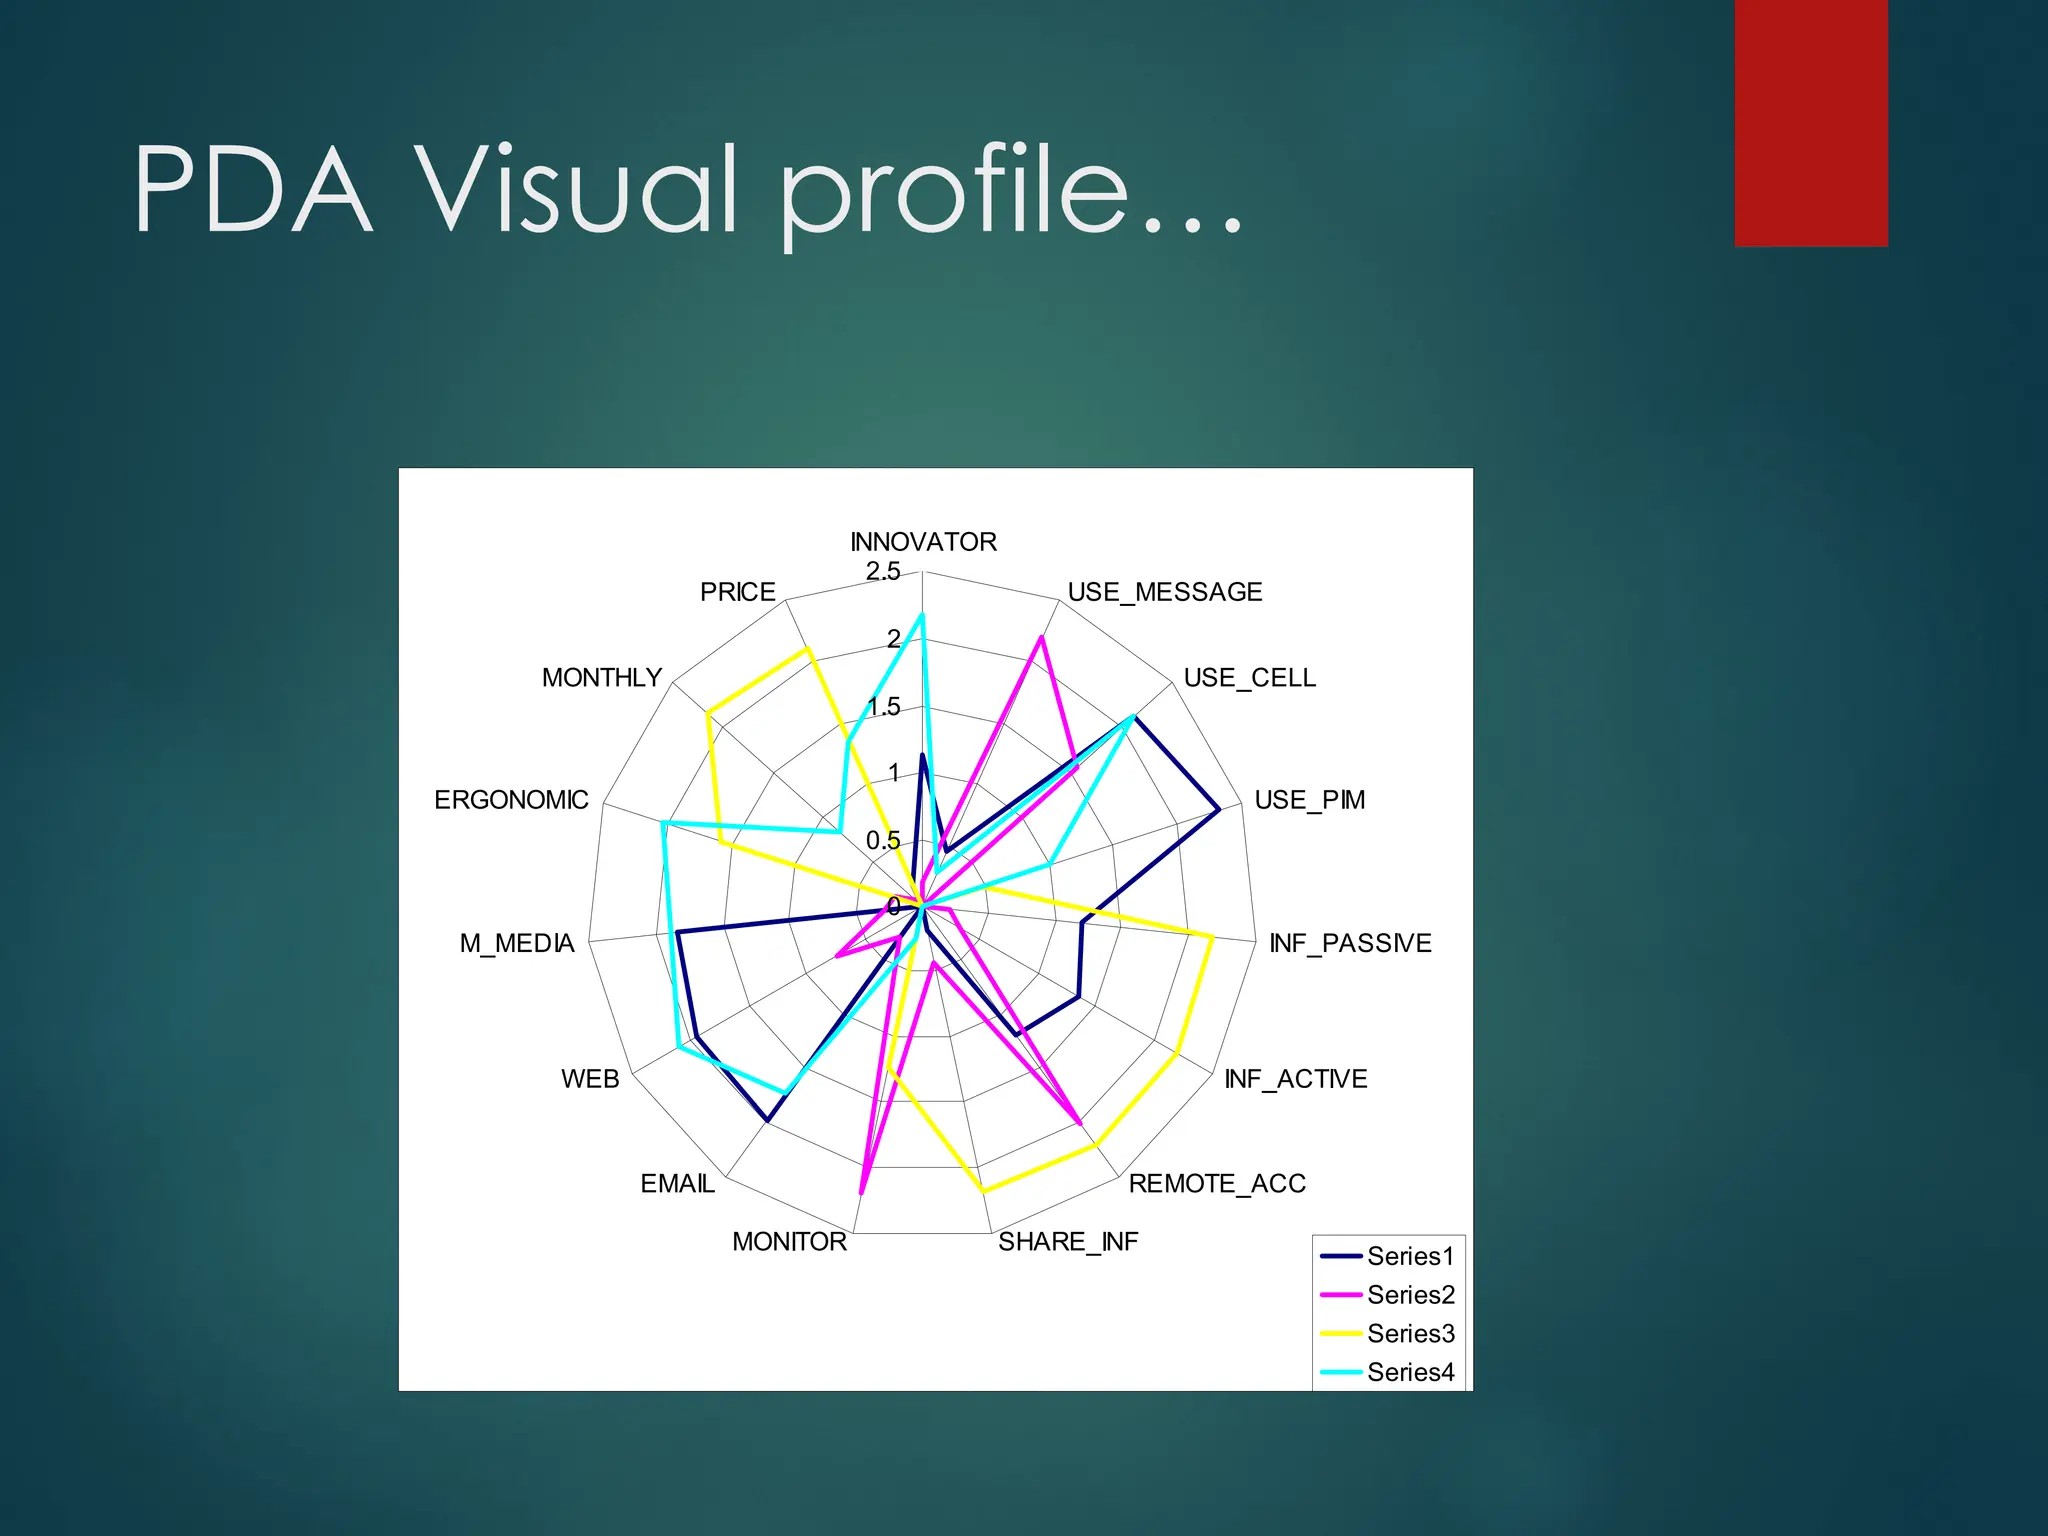
PDA profiles
Cluster1. Phone users who use Personal
Information Management software, to whom
Email and Web access, as well as Multimedia
capabilities are important.
Cluster 2. People who use messaging services and
cell phones, need remote access to information,
appreciate better monitors, but not for multi-
media usage.
37.
PDA profiles..
Cluster 3.Pager users who have a high need for fast
information sharing (receiving as well as sending)
and also remote access. They use neither email
extensively, nor the Web, nor Multi-media, but do
require a handy, non-bulky device.
Cluster 4. Innovators who use cell phones a lot, have
a high need for Email, Web, and Multi-media use.
They also require a sleek device.
Name the segments
Cluster1 - Sales Pros:
Cluster 1 consists mainly of sales professionals: 54% of the cluster members
indicated Sales as their occupation. They use the cell phone heavily, and many
(45%) own a PDA already; practically all have access to a PC. Their work often
takes them away from the office. They mostly read two of the selected
magazines: 30% read BW. From the needs data, we see that they are quite price
sensitive.
Cluster 2 – Service Pros:
Cluster 2 is made up primarily of service personnel (39%) and secondarily of
sales personnel (23%). They use cell phones heavily, but only about one fifth
currently use a PDA. They spend much time on the road and in remote locations.
They read PC Magazine, 29%. From the needs data, we see that they are quite
price sensitive.
40.
Name the segments…
Cluster3 – Hard Hats:
Cluster 3 is made up predominantly of construction (31%) and
emergency (19%)
workers. They use cell phones, but usually do not own a PDA.
By the nature of their work, they have high information relay
needs and generally work in remote locations.
They exchange information with colleagues in the field (e.g.
construction workers on the site). Many read Field & Stream
(31%) and also PC Magazine. Note also from the needs data,
that they are the least price sensitive (willing to pay highest
price plus monthly fee) and also have the lowest income.
This apparent anomaly occurs because these folks are less likely
to have to pay for the device themselves, raising the question of
whose preferences—their own or their employers’—will drive the
adoption decision
41.
Name the segments…
Cluster4 – Innovators:
Cluster 4 represents early adopters (see needs data),
predominantly professionals (lawyers, consultants,
etc.).
Every cluster member has access to a PC, 89
percent already own PDAs.
They read many magazines, especially BW 49%,
PCMag 32%. Most are highly paid and highly
educated.
Interpreting Cluster
Analysis Results
Select the appropriate number of clusters:
Are the bases variables highly correlated? (Should we reduce the
data through factor analysis before clustering?)
Are the clusters separated well from each other?
Should we combine or separate the clusters?
Can you come up with descriptive names for each cluster (eg,
professionals, techno-savvy, etc.)?
Segment the market independently of your ability to
reach the segments (i.e., separately evaluate
segmentation and discriminant analysis results).
44.
Discrimination based on
demographics/behaviour
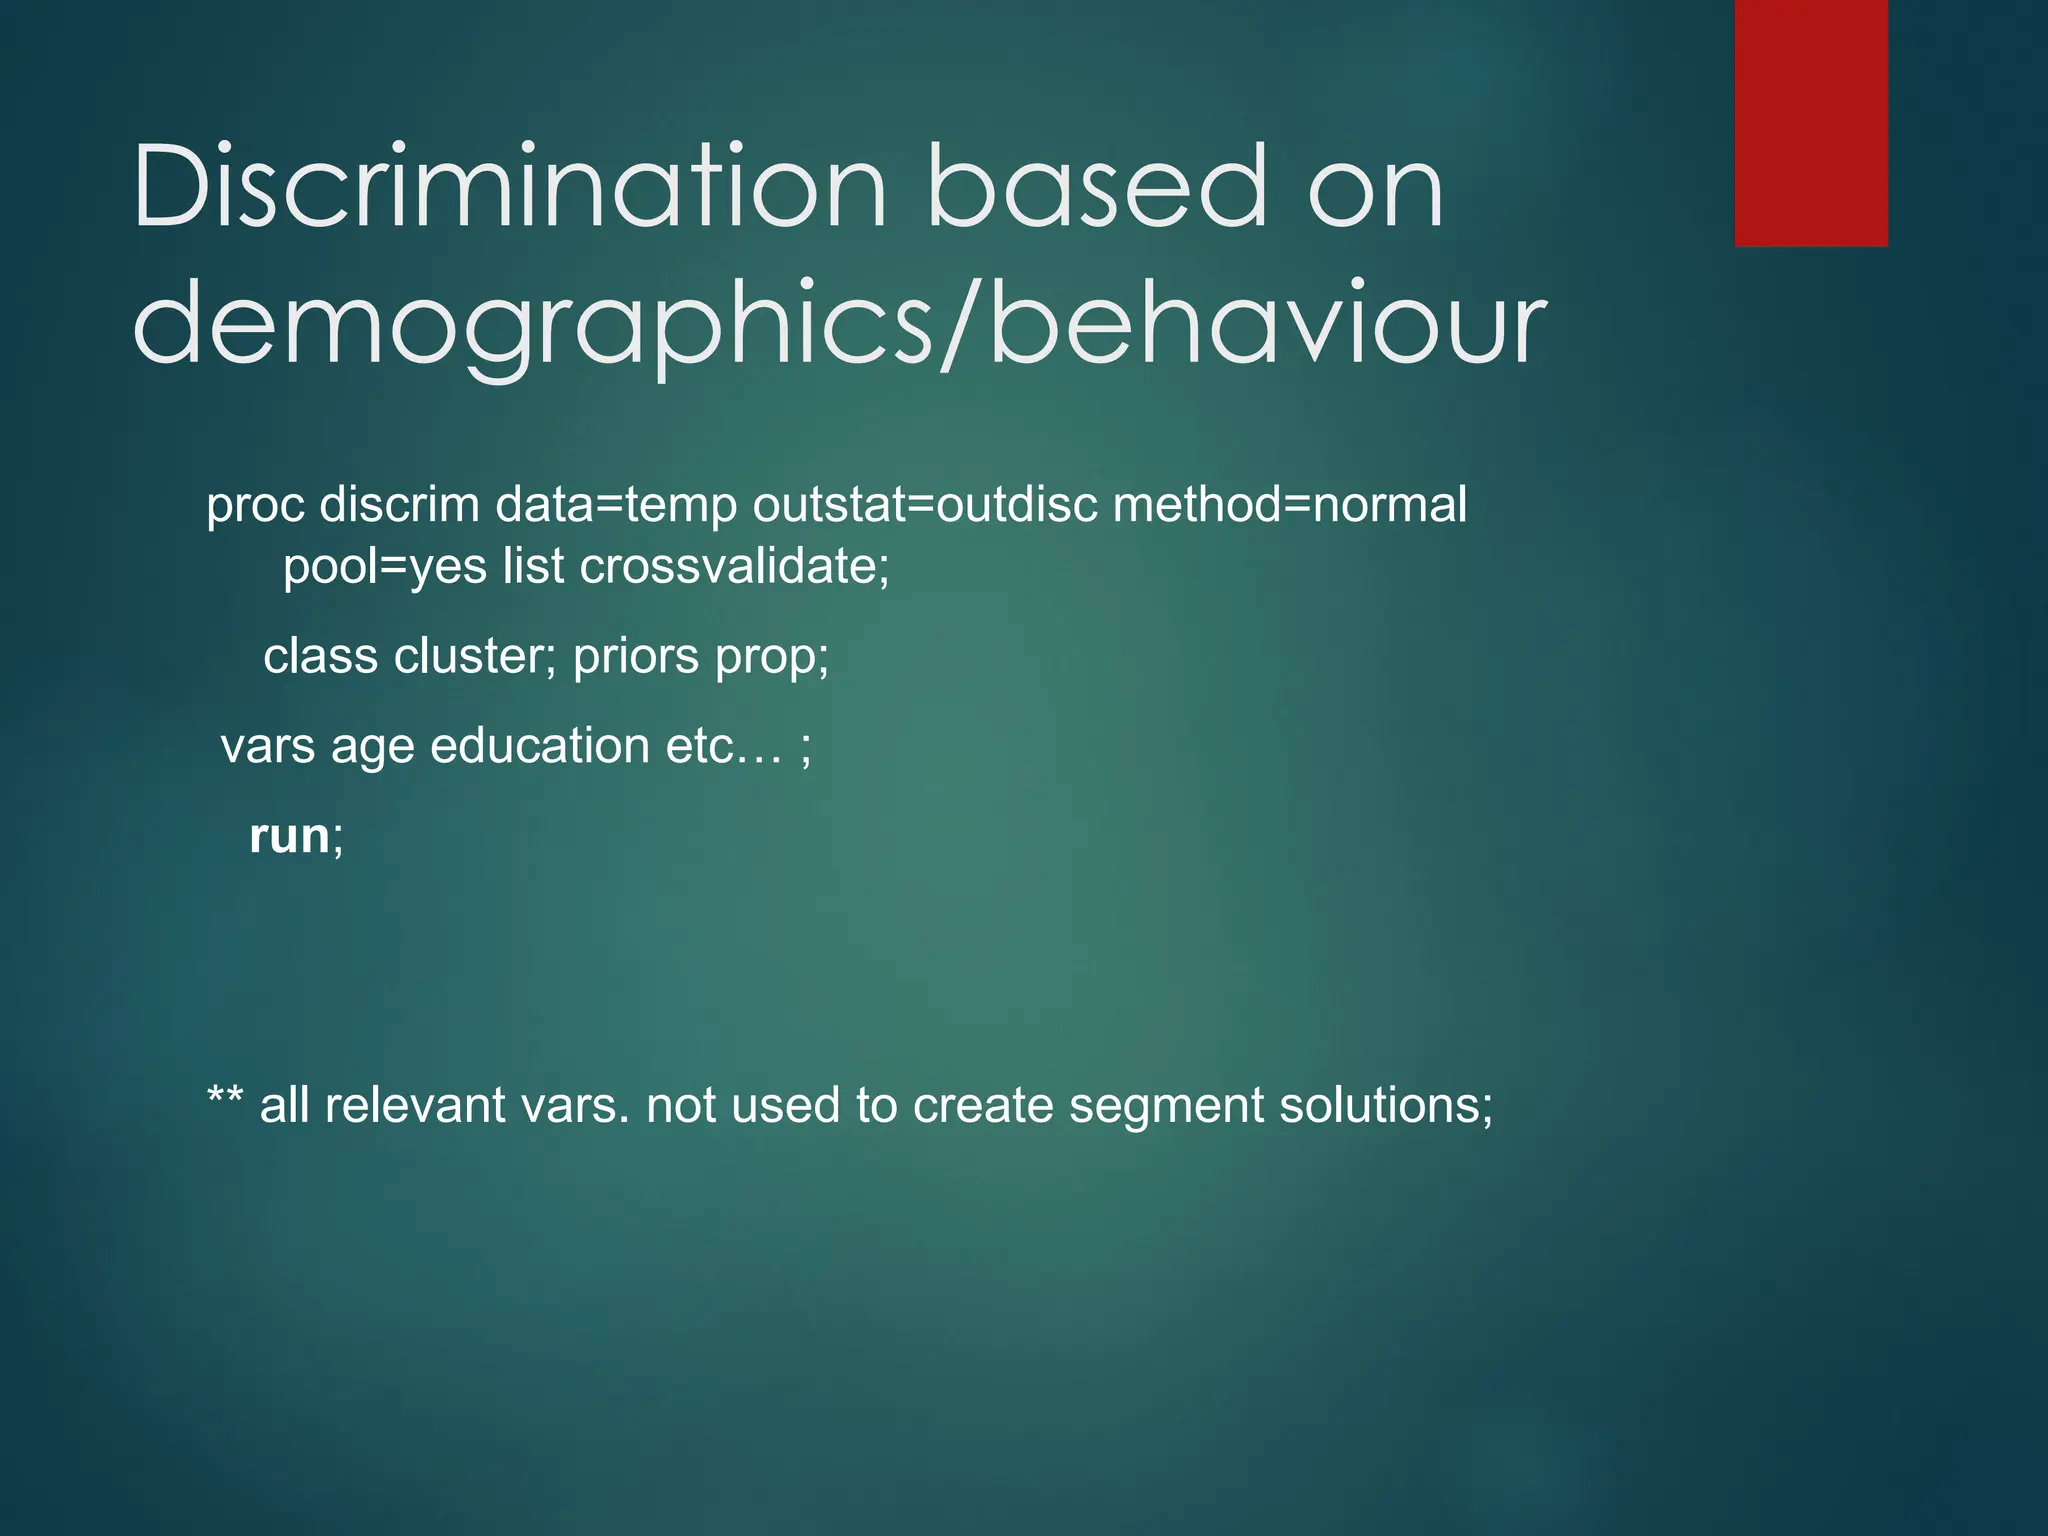
procdiscrim data=temp outstat=outdisc method=normal
pool=yes list crossvalidate;
class cluster; priors prop;
vars age education etc… ;
run;
** all relevant vars. not used to create segment solutions;
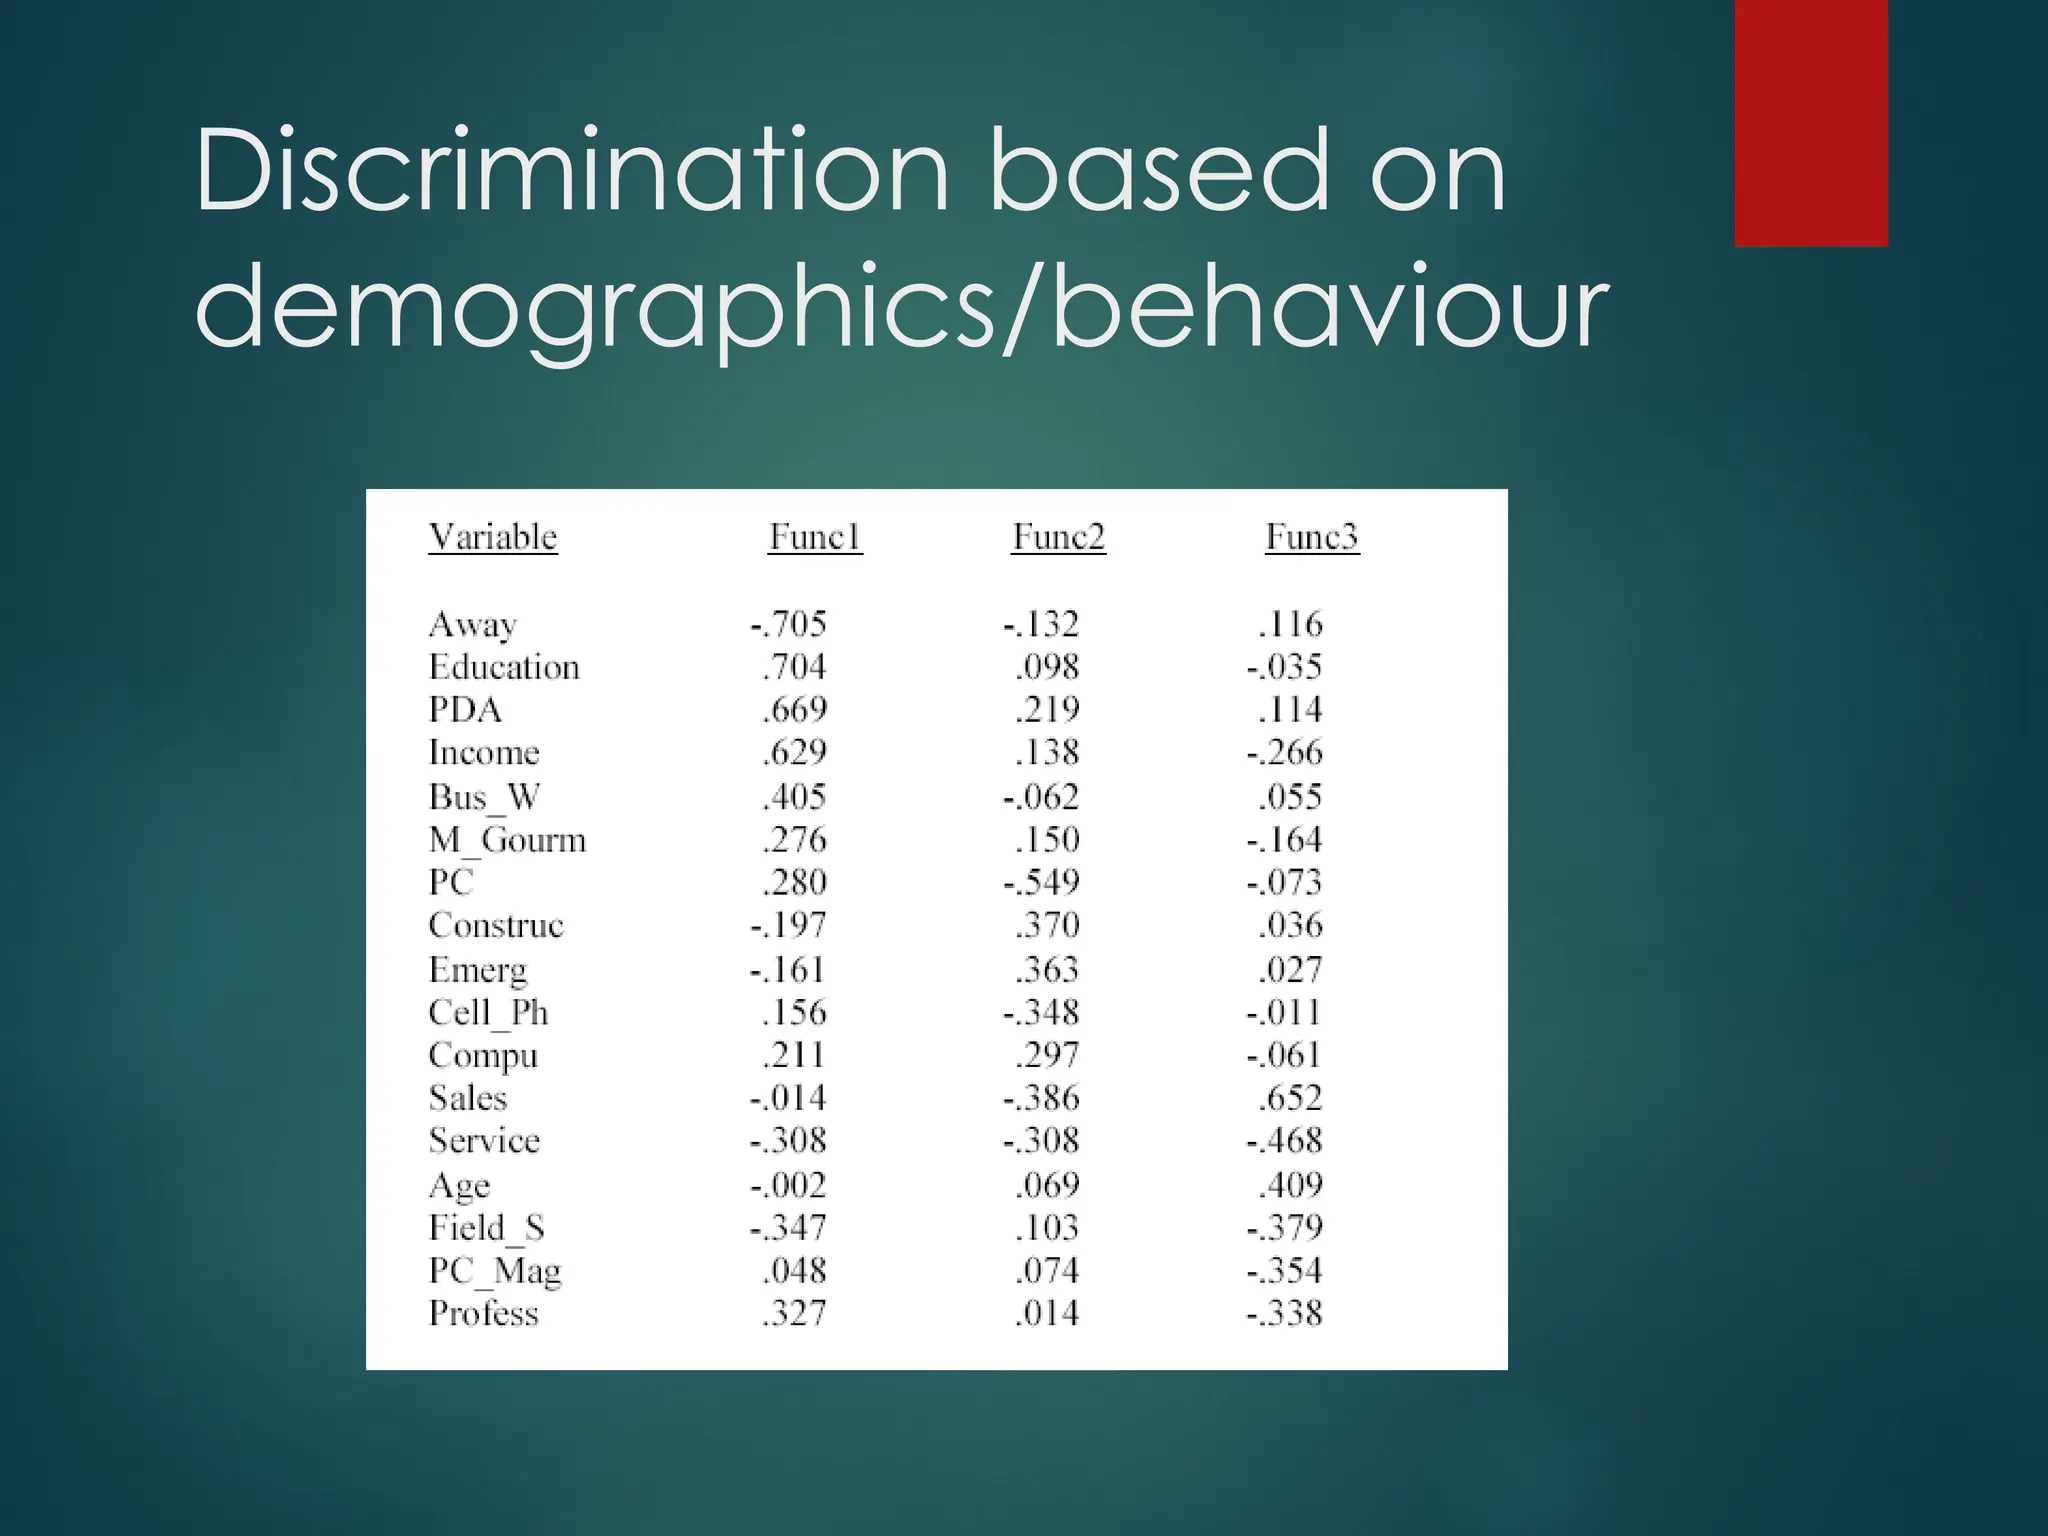
Discrimination based on
demographics/behaviour
•Thefirst discriminant function above explains 51% the variation.
According to its coefficients, i.e., the four groups are particularly
different with respect to the amount away from the office.
•In addition, the function shares high correlation with the level of
education, possession of a PDA, and income.
•The second function explains 32% of the variance and primarily
distinguishes the occupation types construction/emergency from
sales/service, and the third function separates Sales and Service
types.
Correspondence Analysis
Providesa graphical summary of the
interactions in a table
Also known as a perceptual map
But so are many other charts
Can be very useful
E.g. to provide overview of cluster results
However the correct interpretation is less
than intuitive, and this leads many
researchers astray
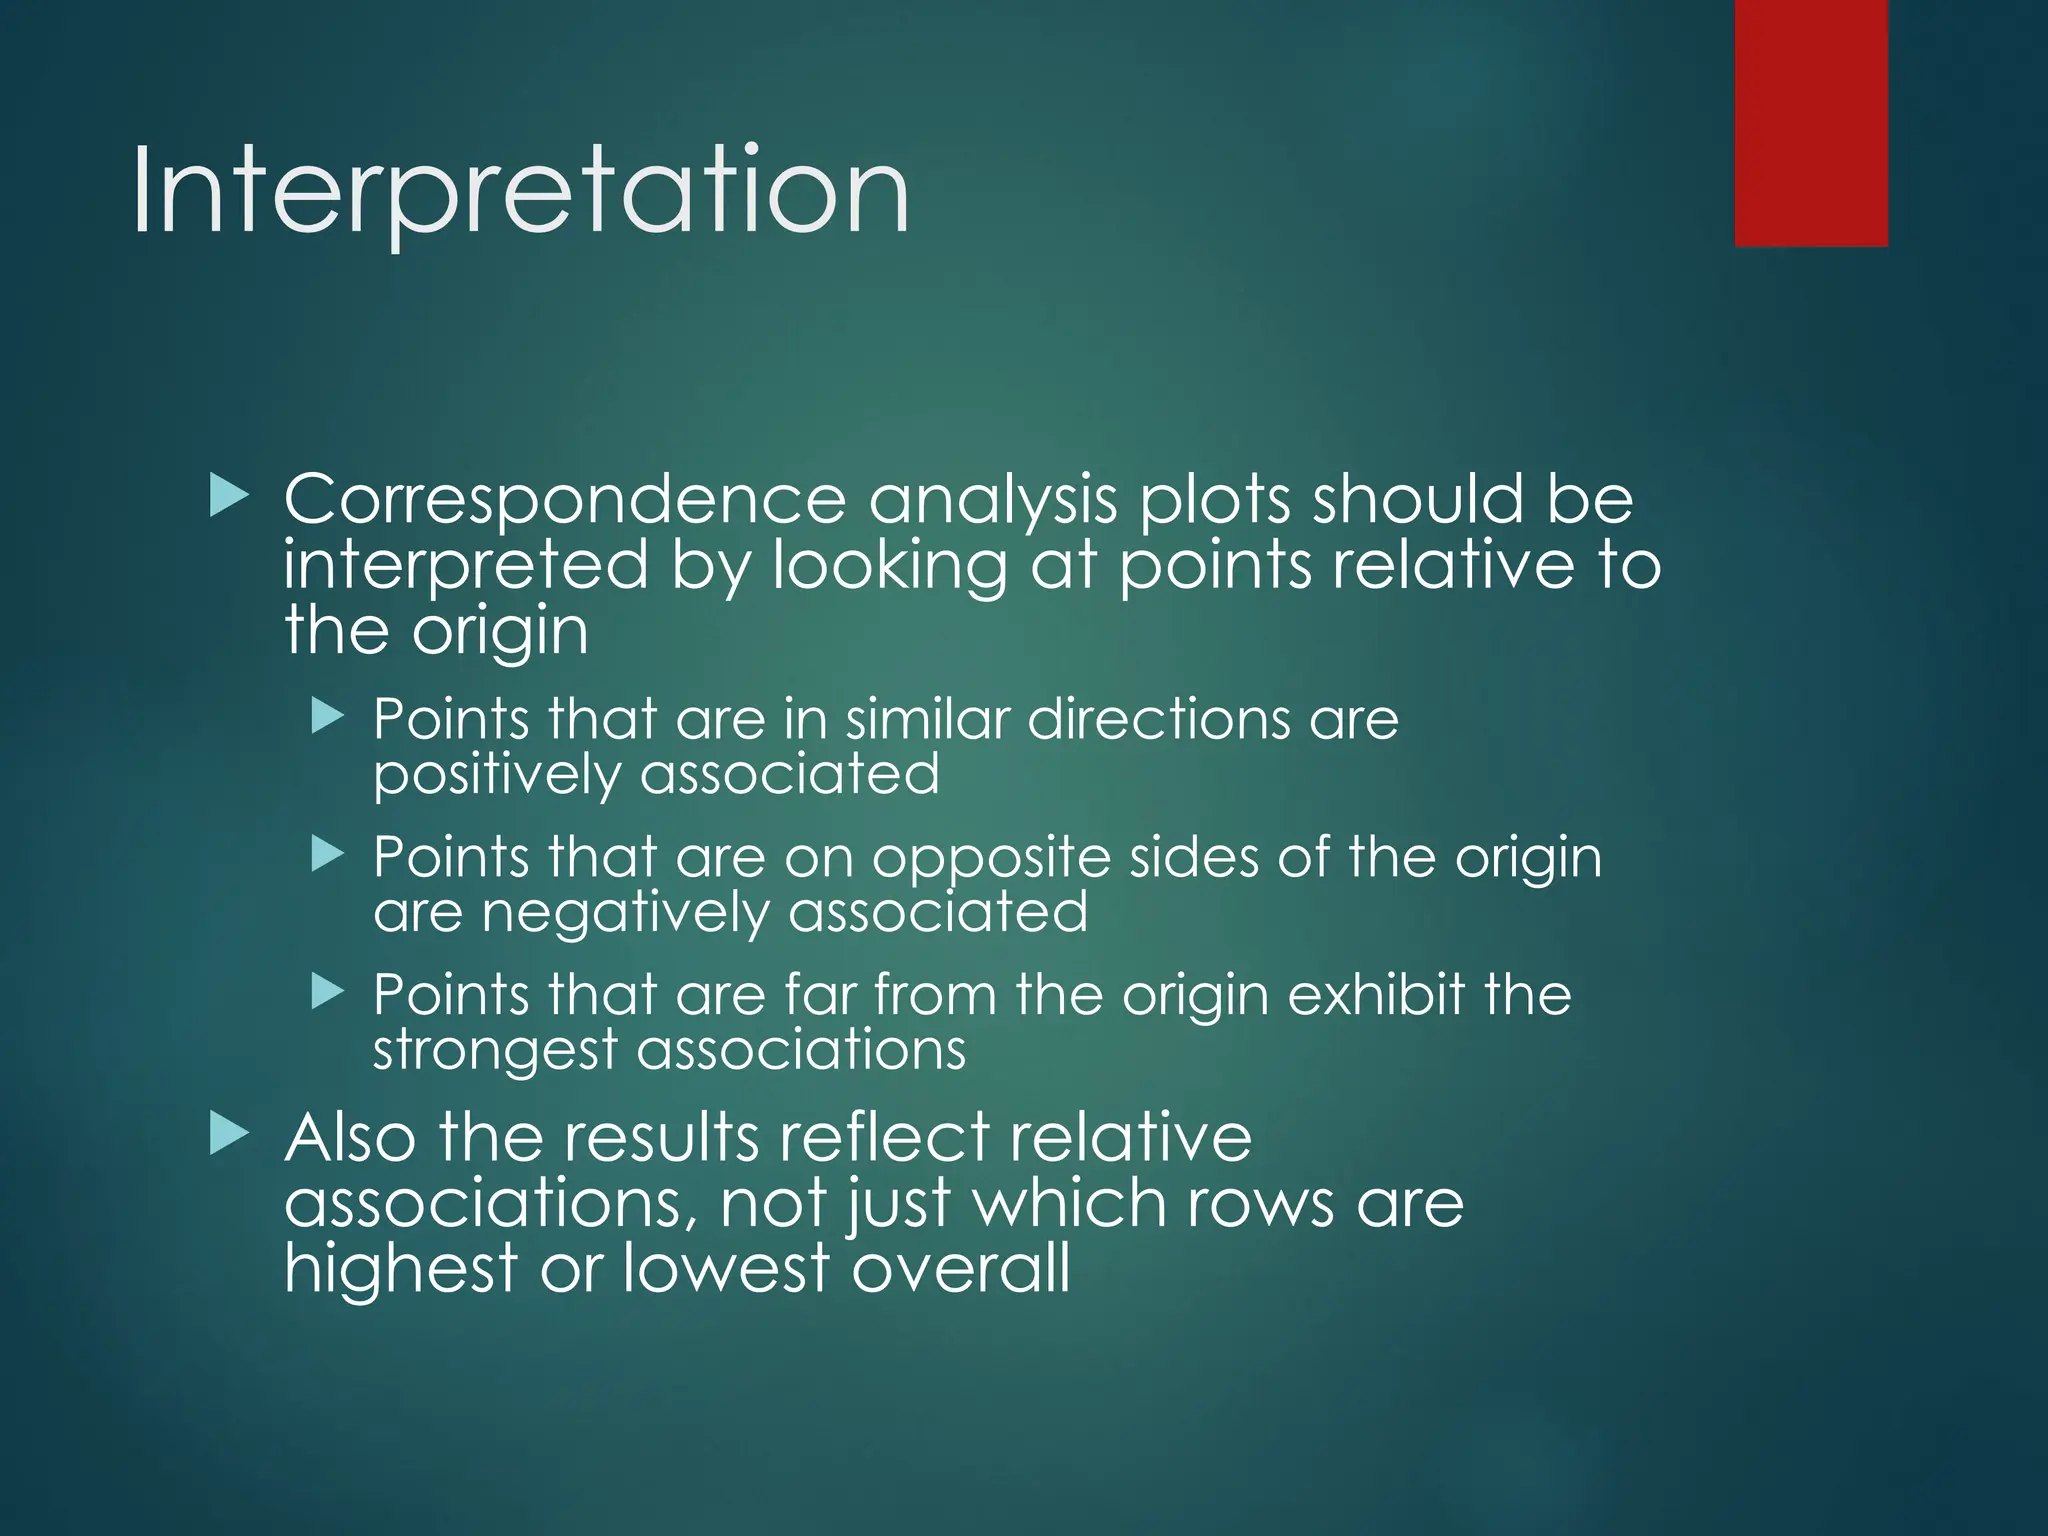
Interpretation
Correspondence analysisplots should be
interpreted by looking at points relative to
the origin
Points that are in similar directions are
positively associated
Points that are on opposite sides of the origin
are negatively associated
Points that are far from the origin exhibit the
strongest associations
Also the results reflect relative
associations, not just which rows are
highest or lowest overall
52.
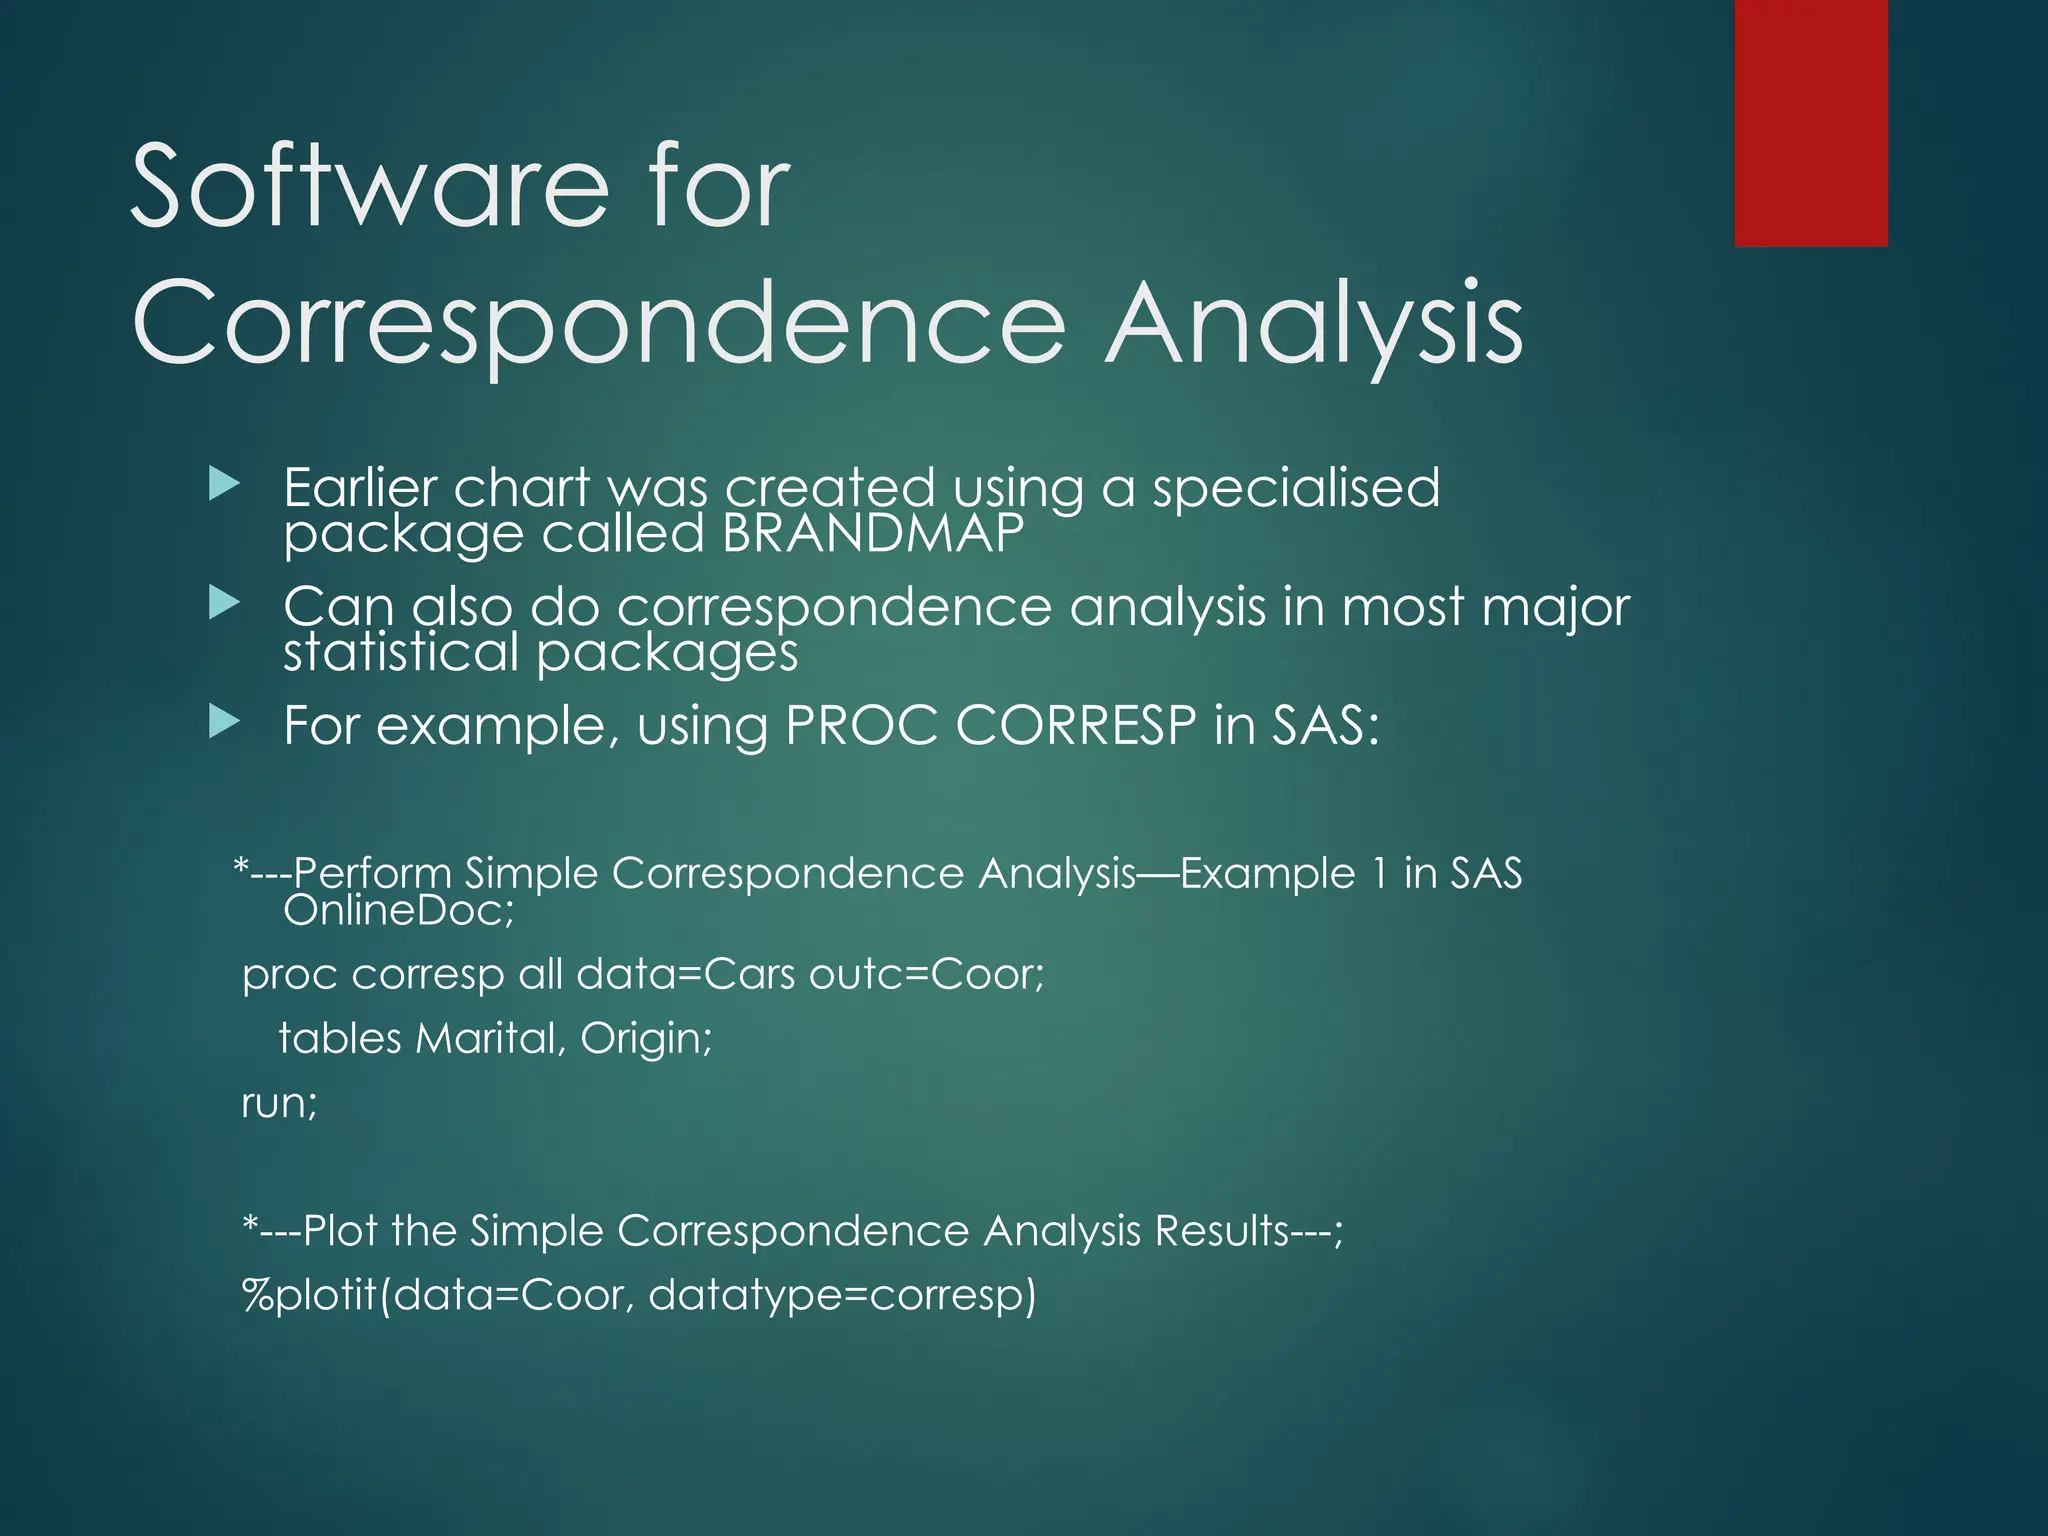
Software for
Correspondence Analysis
Earlier chart was created using a specialised
package called BRANDMAP
Can also do correspondence analysis in most major
statistical packages
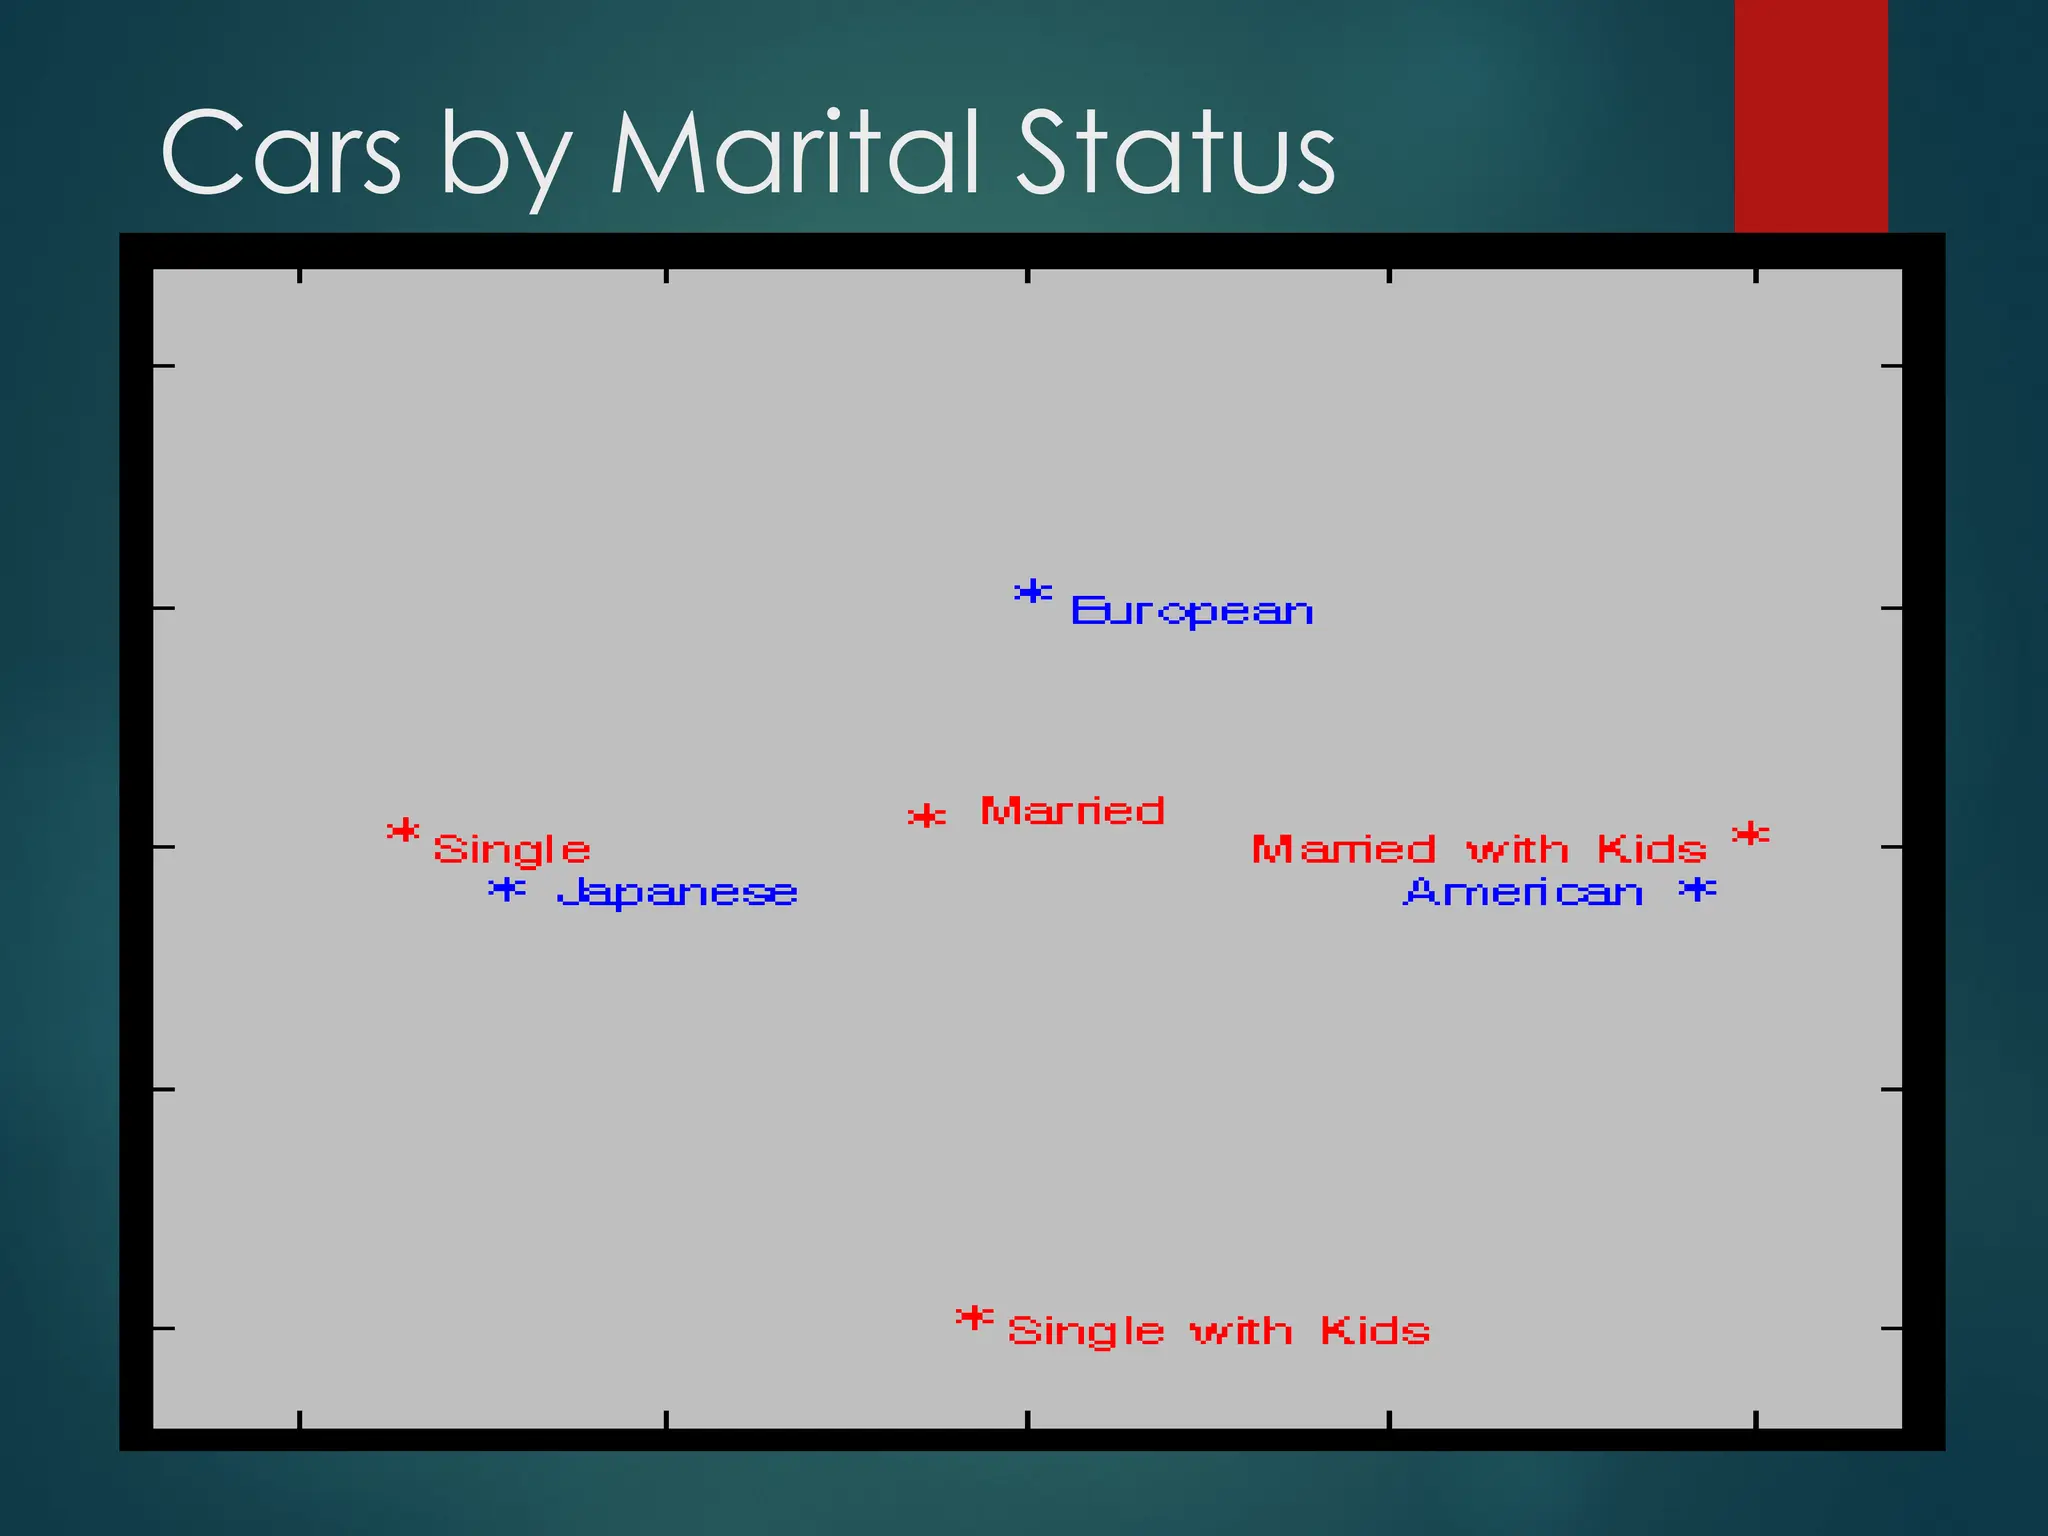
For example, using PROC CORRESP in SAS:
*---Perform Simple Correspondence Analysis—Example 1 in SAS
OnlineDoc;
proc corresp all data=Cars outc=Coor;
tables Marital, Origin;
run;
*---Plot the Simple Correspondence Analysis Results---;
%plotit(data=Coor, datatype=corresp)
Tandem Segmentation
Onegeneral method is to conduct a factor
analysis, followed by a cluster analysis
This approach has been criticised for losing
information and not yielding as much
discrimination as cluster analysis alone
However it can make it easier to design the
distance function, and to interpret the results
56.
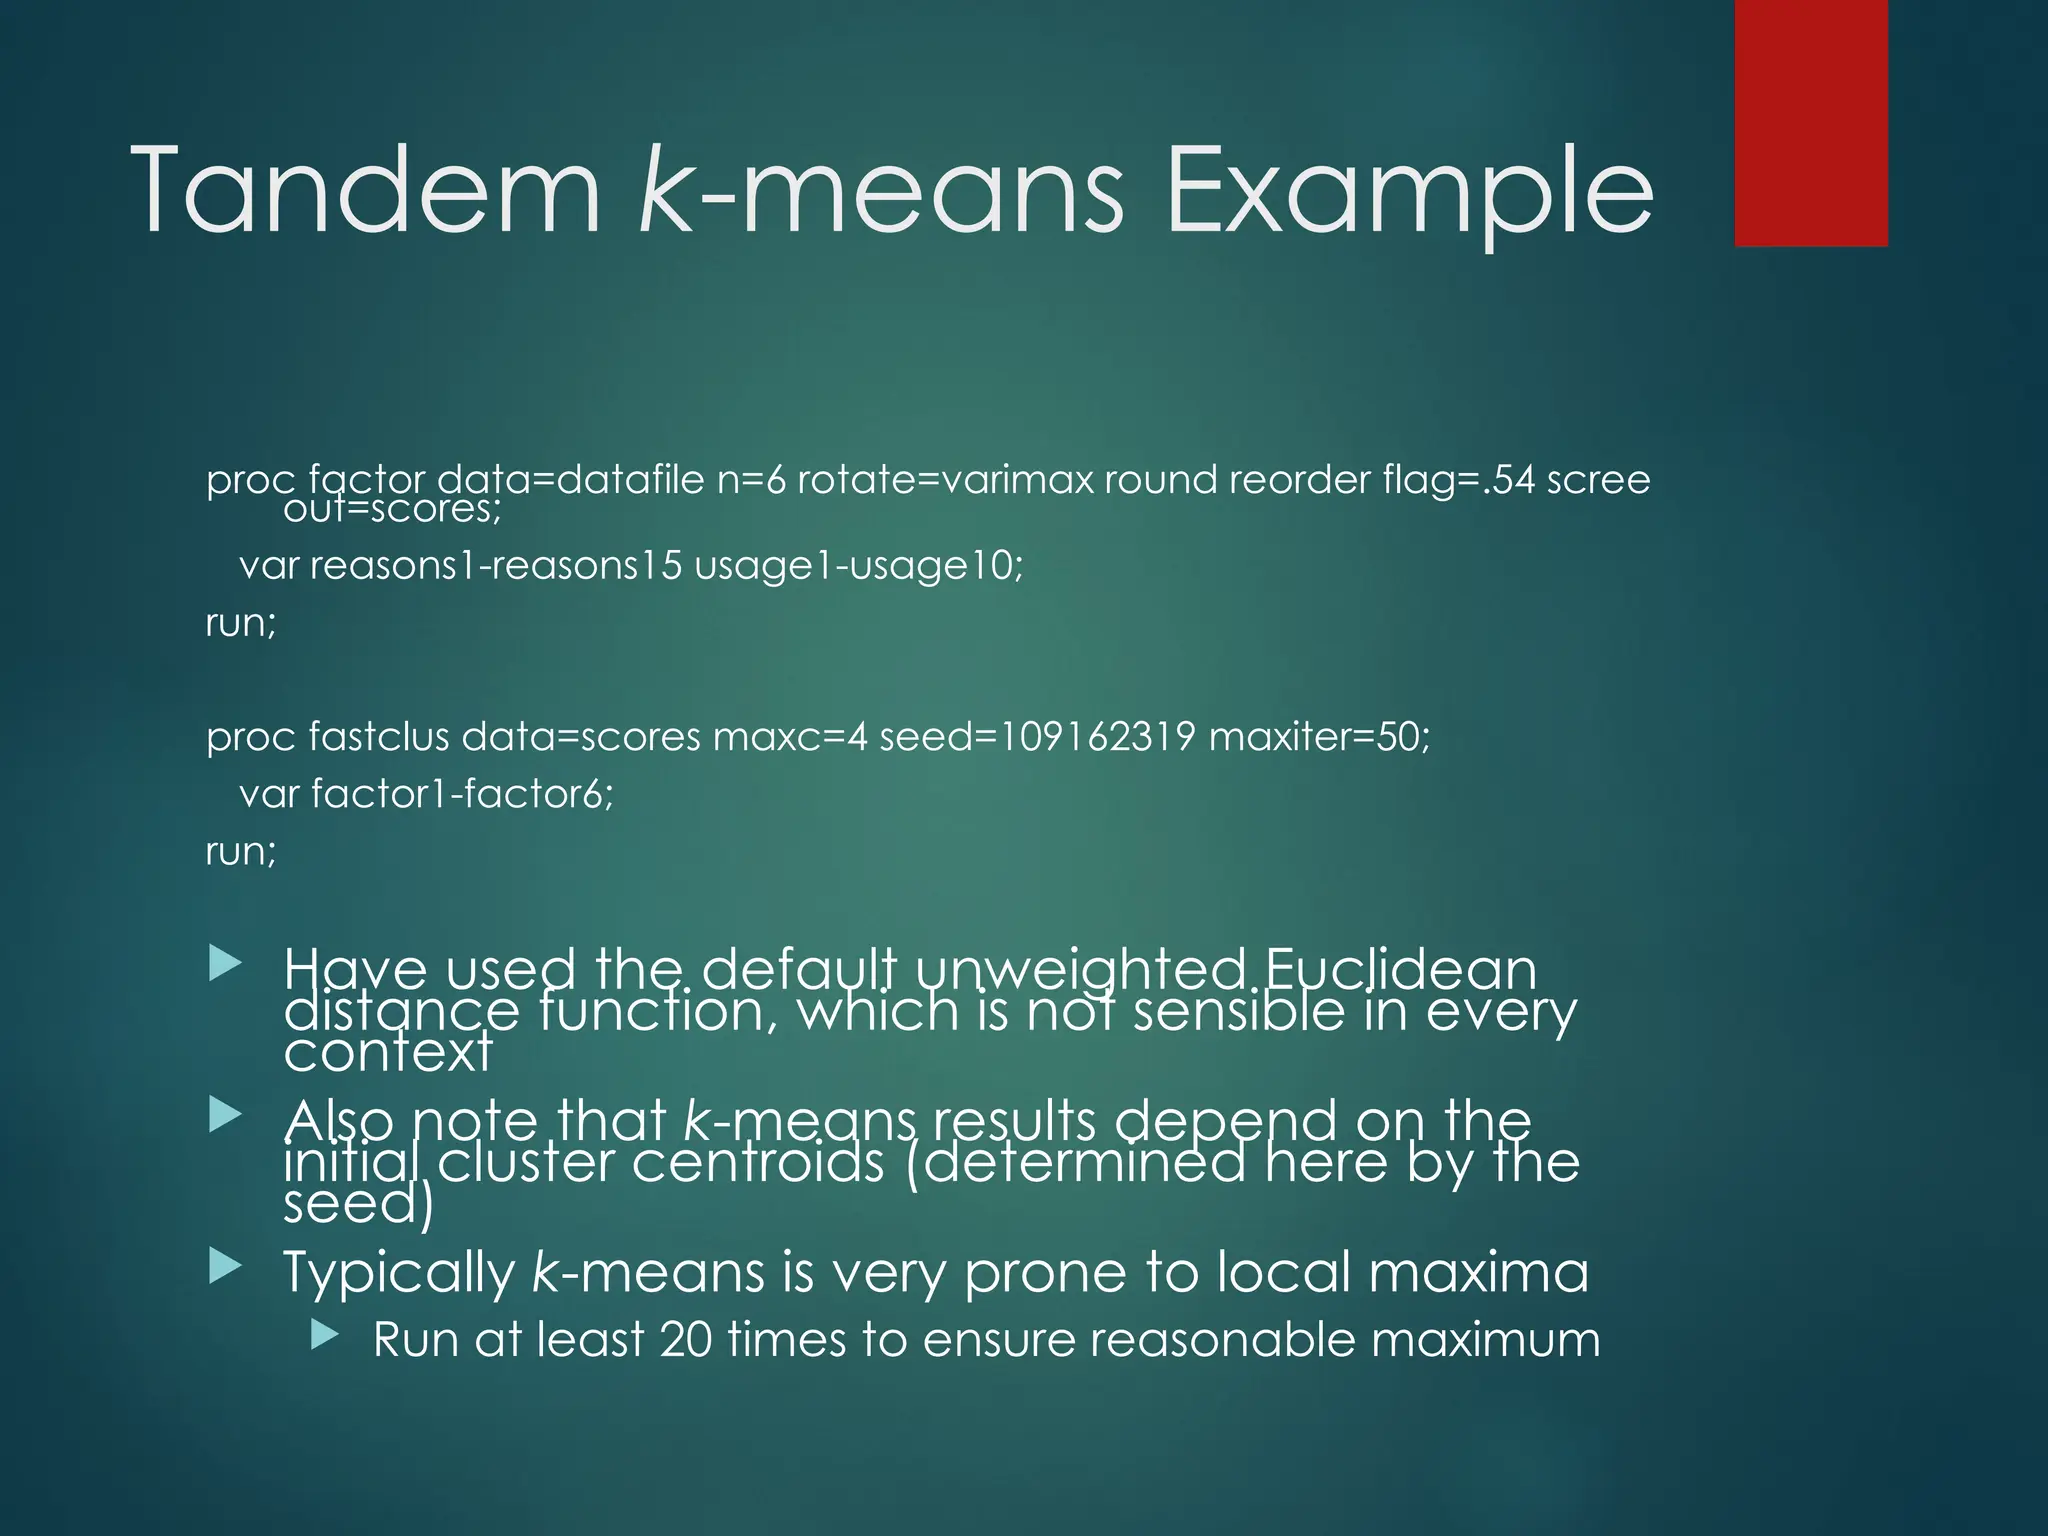
Tandem k-means Example
procfactor data=datafile n=6 rotate=varimax round reorder flag=.54 scree
out=scores;
var reasons1-reasons15 usage1-usage10;
run;
proc fastclus data=scores maxc=4 seed=109162319 maxiter=50;
var factor1-factor6;
run;
Have used the default unweighted Euclidean
distance function, which is not sensible in every
context
Also note that k-means results depend on the
initial cluster centroids (determined here by the
seed)
Typically k-means is very prone to local maxima
Run at least 20 times to ensure reasonable maximum
57.
Cluster Analysis Options
There are several choices of how to form
clusters in hierarchical cluster analysis
Single linkage
Average linkage
Density linkage
Ward’s method
Many others
Ward’s method (like k-means) tends to form
equal sized, roundish clusters
Average linkage generally forms roundish
clusters with equal variance
Density linkage can identify clusters of
different shapes
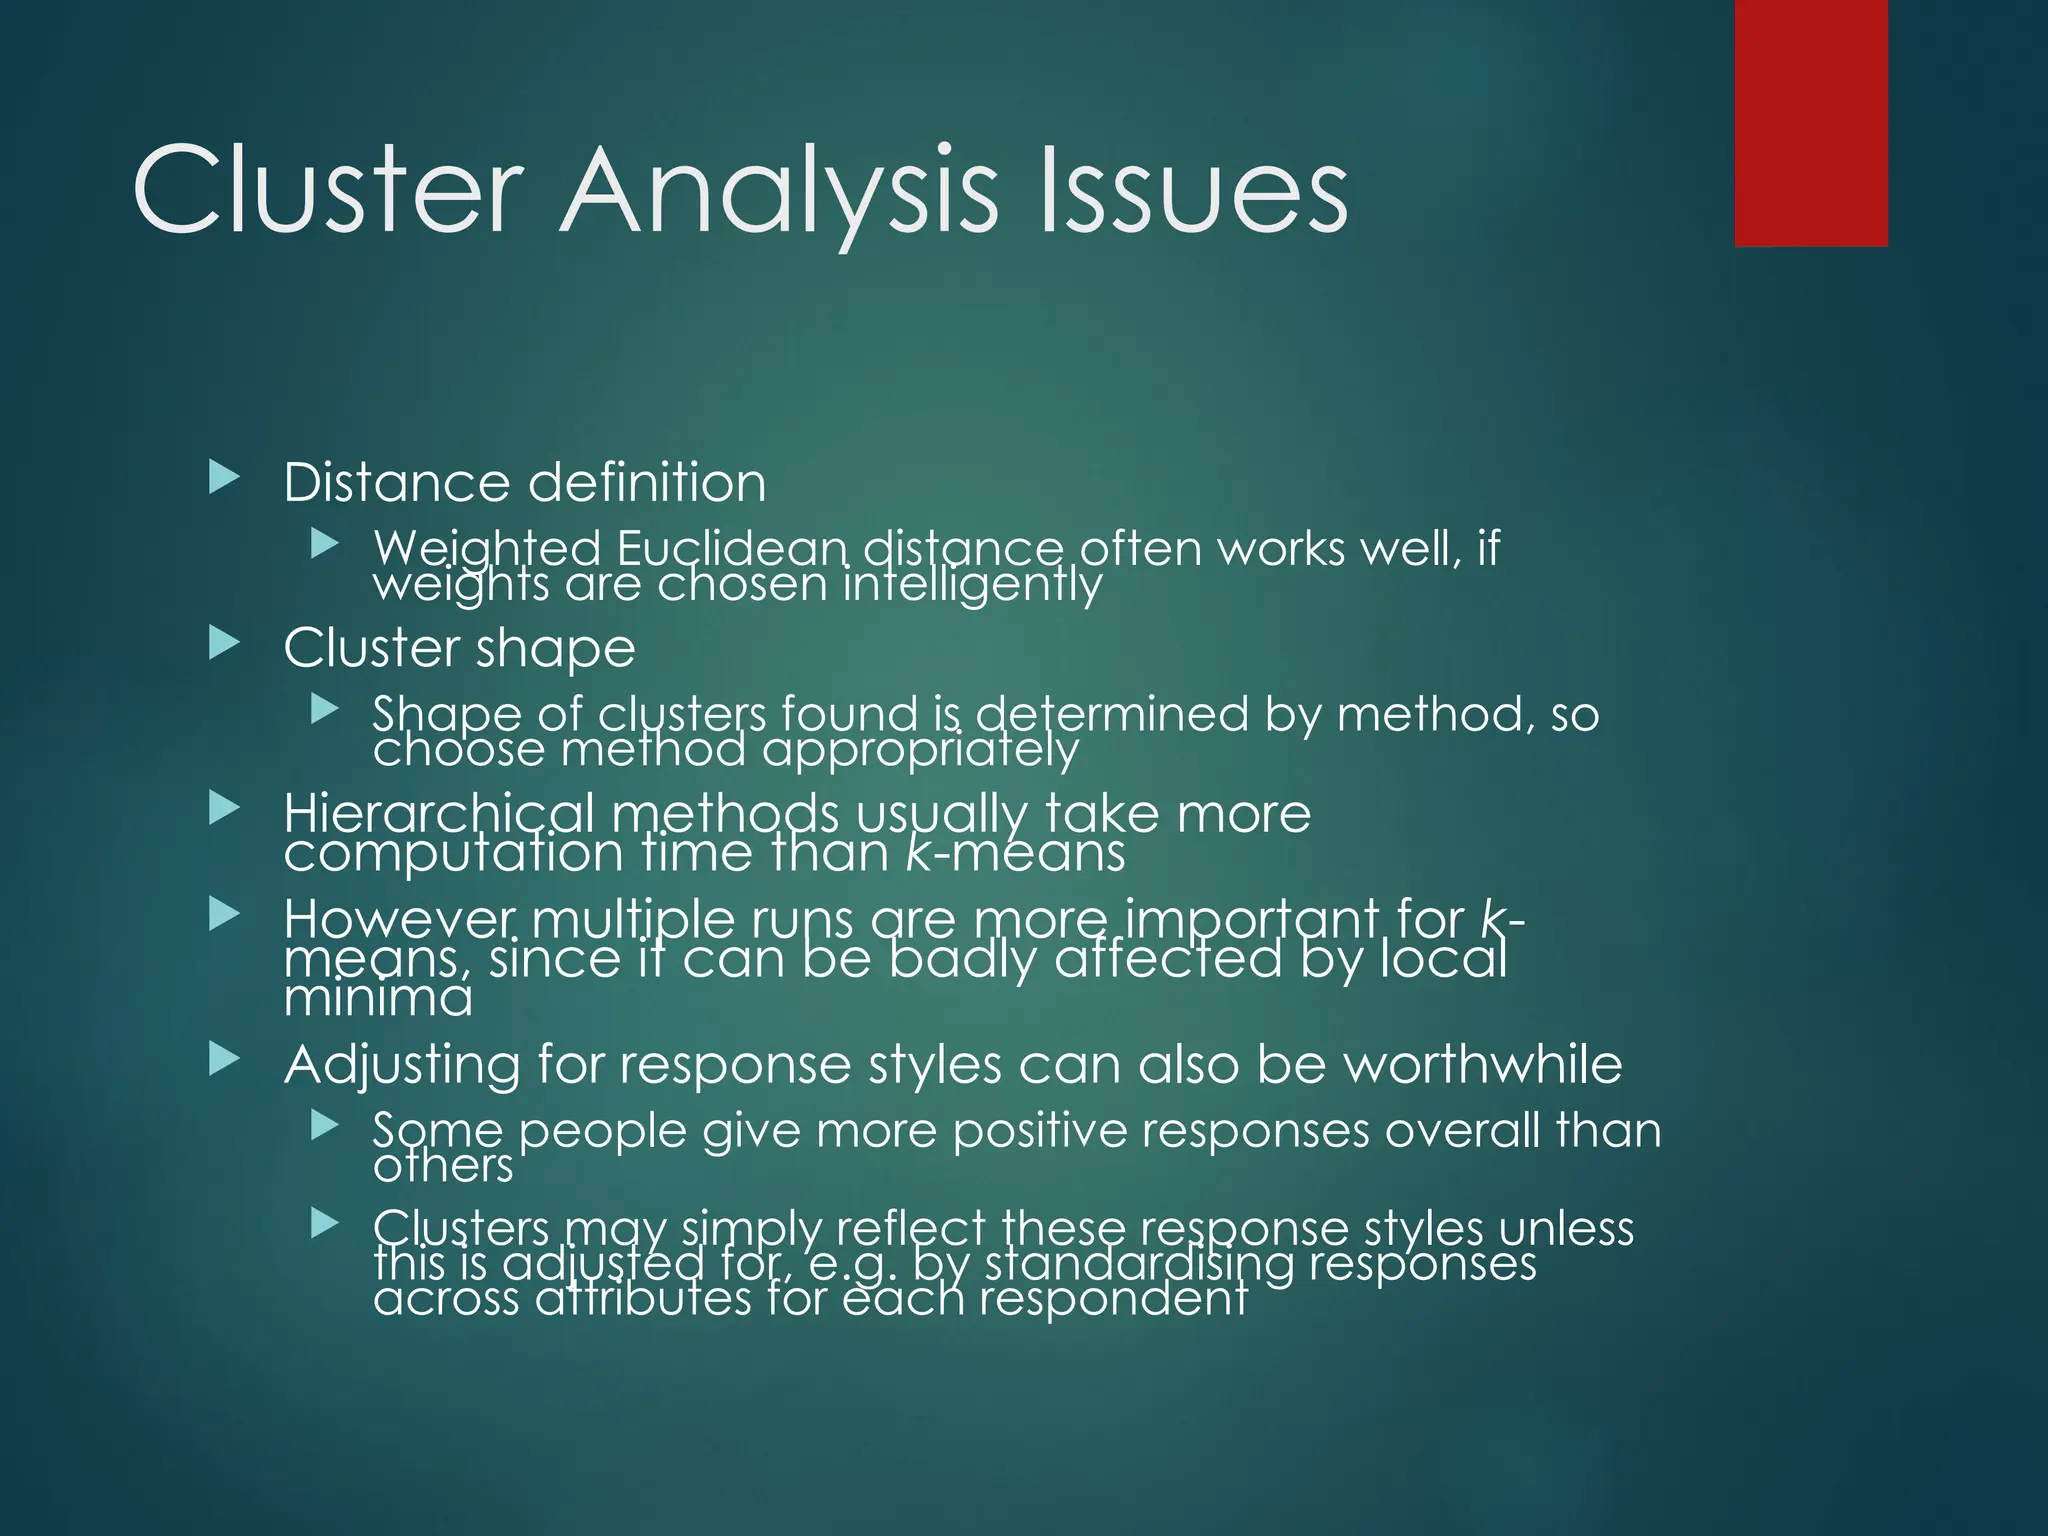
Cluster Analysis Issues
Distance definition
Weighted Euclidean distance often works well, if
weights are chosen intelligently
Cluster shape
Shape of clusters found is determined by method, so
choose method appropriately
Hierarchical methods usually take more
computation time than k-means
However multiple runs are more important for k-
means, since it can be badly affected by local
minima
Adjusting for response styles can also be worthwhile
Some people give more positive responses overall than
others
Clusters may simply reflect these response styles unless
this is adjusted for, e.g. by standardising responses
across attributes for each respondent
61.
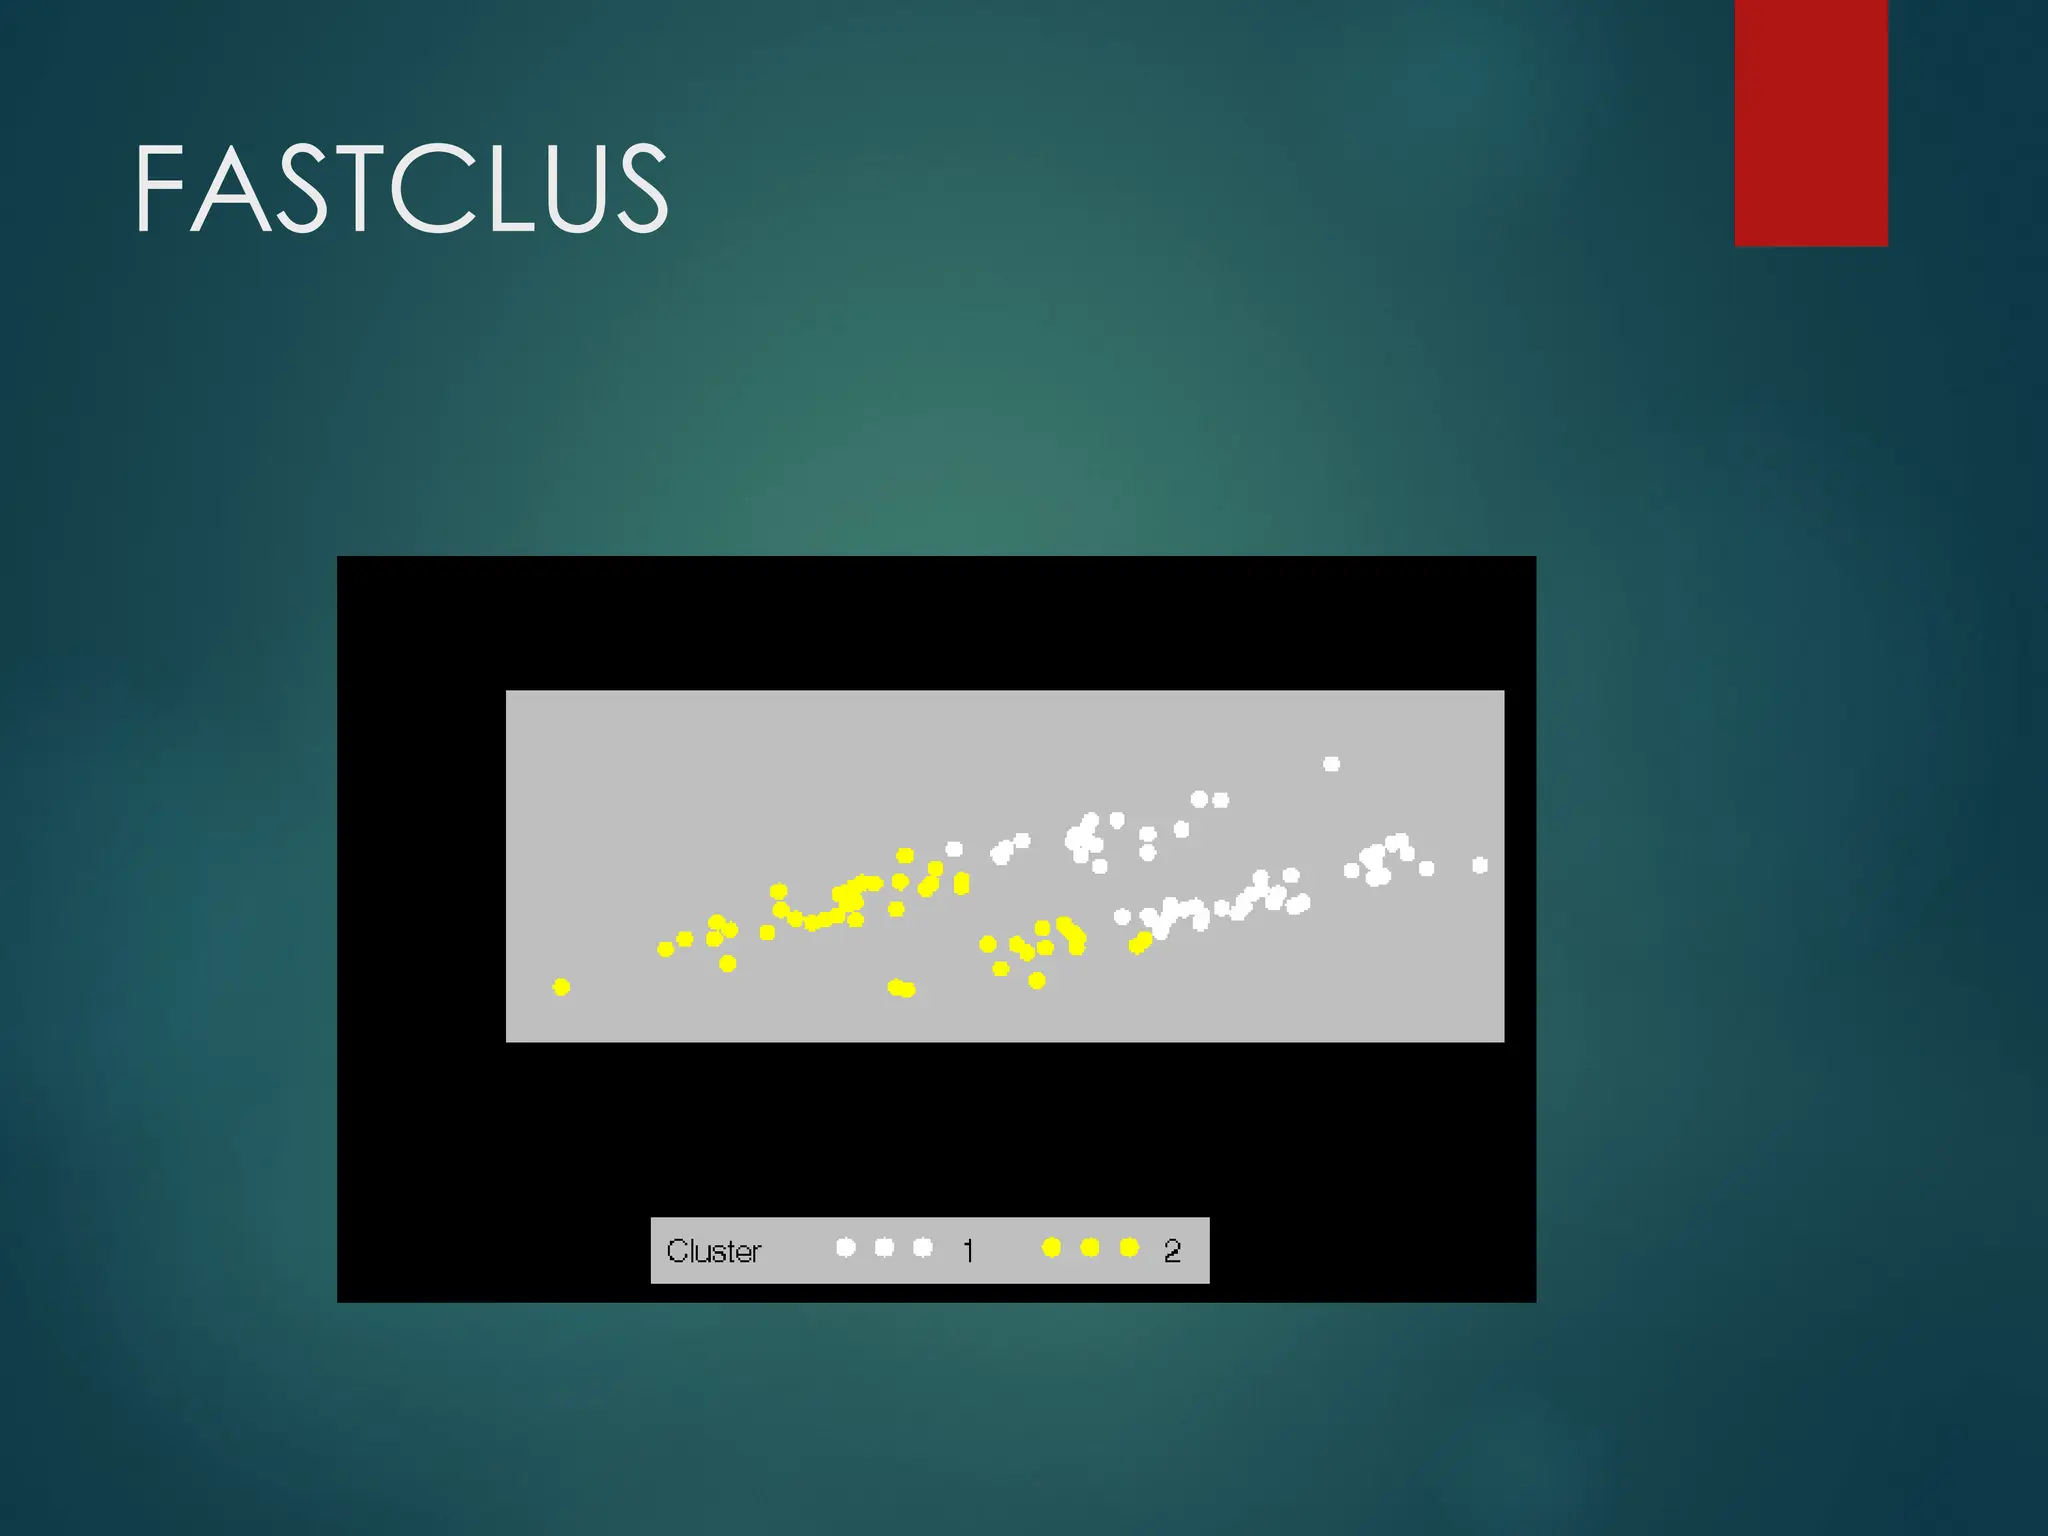
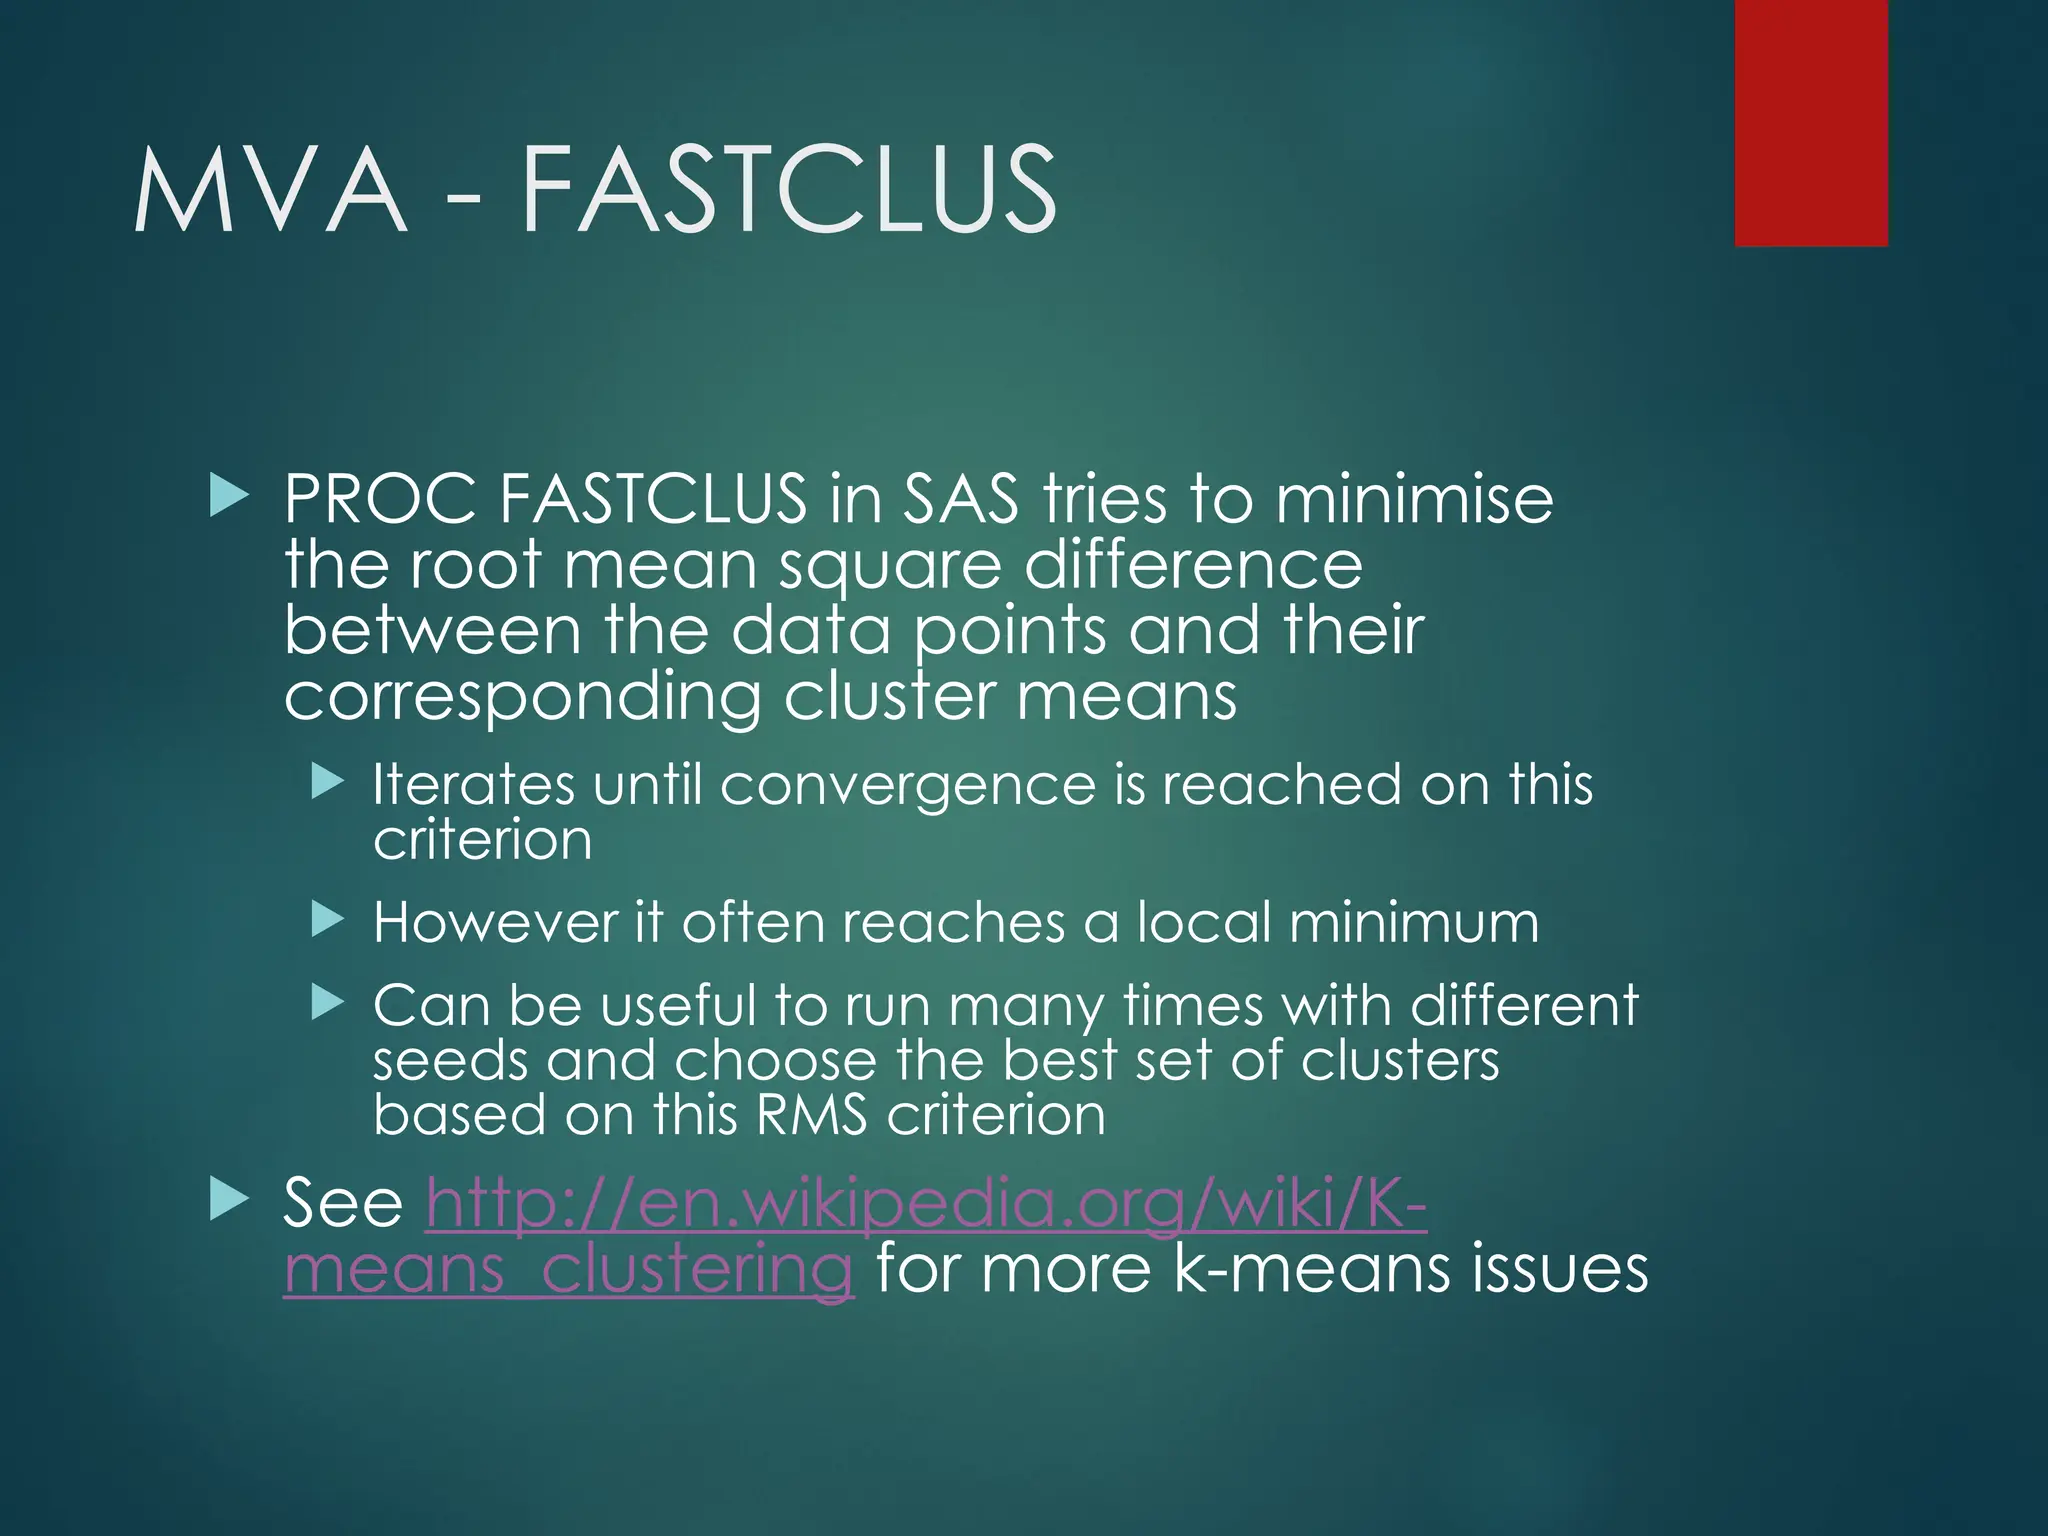
MVA - FASTCLUS
PROC FASTCLUS in SAS tries to minimise
the root mean square difference
between the data points and their
corresponding cluster means
Iterates until convergence is reached on this
criterion
However it often reaches a local minimum
Can be useful to run many times with different
seeds and choose the best set of clusters
based on this RMS criterion
See http://en.wikipedia.org/wiki/K-
means_clustering for more k-means issues
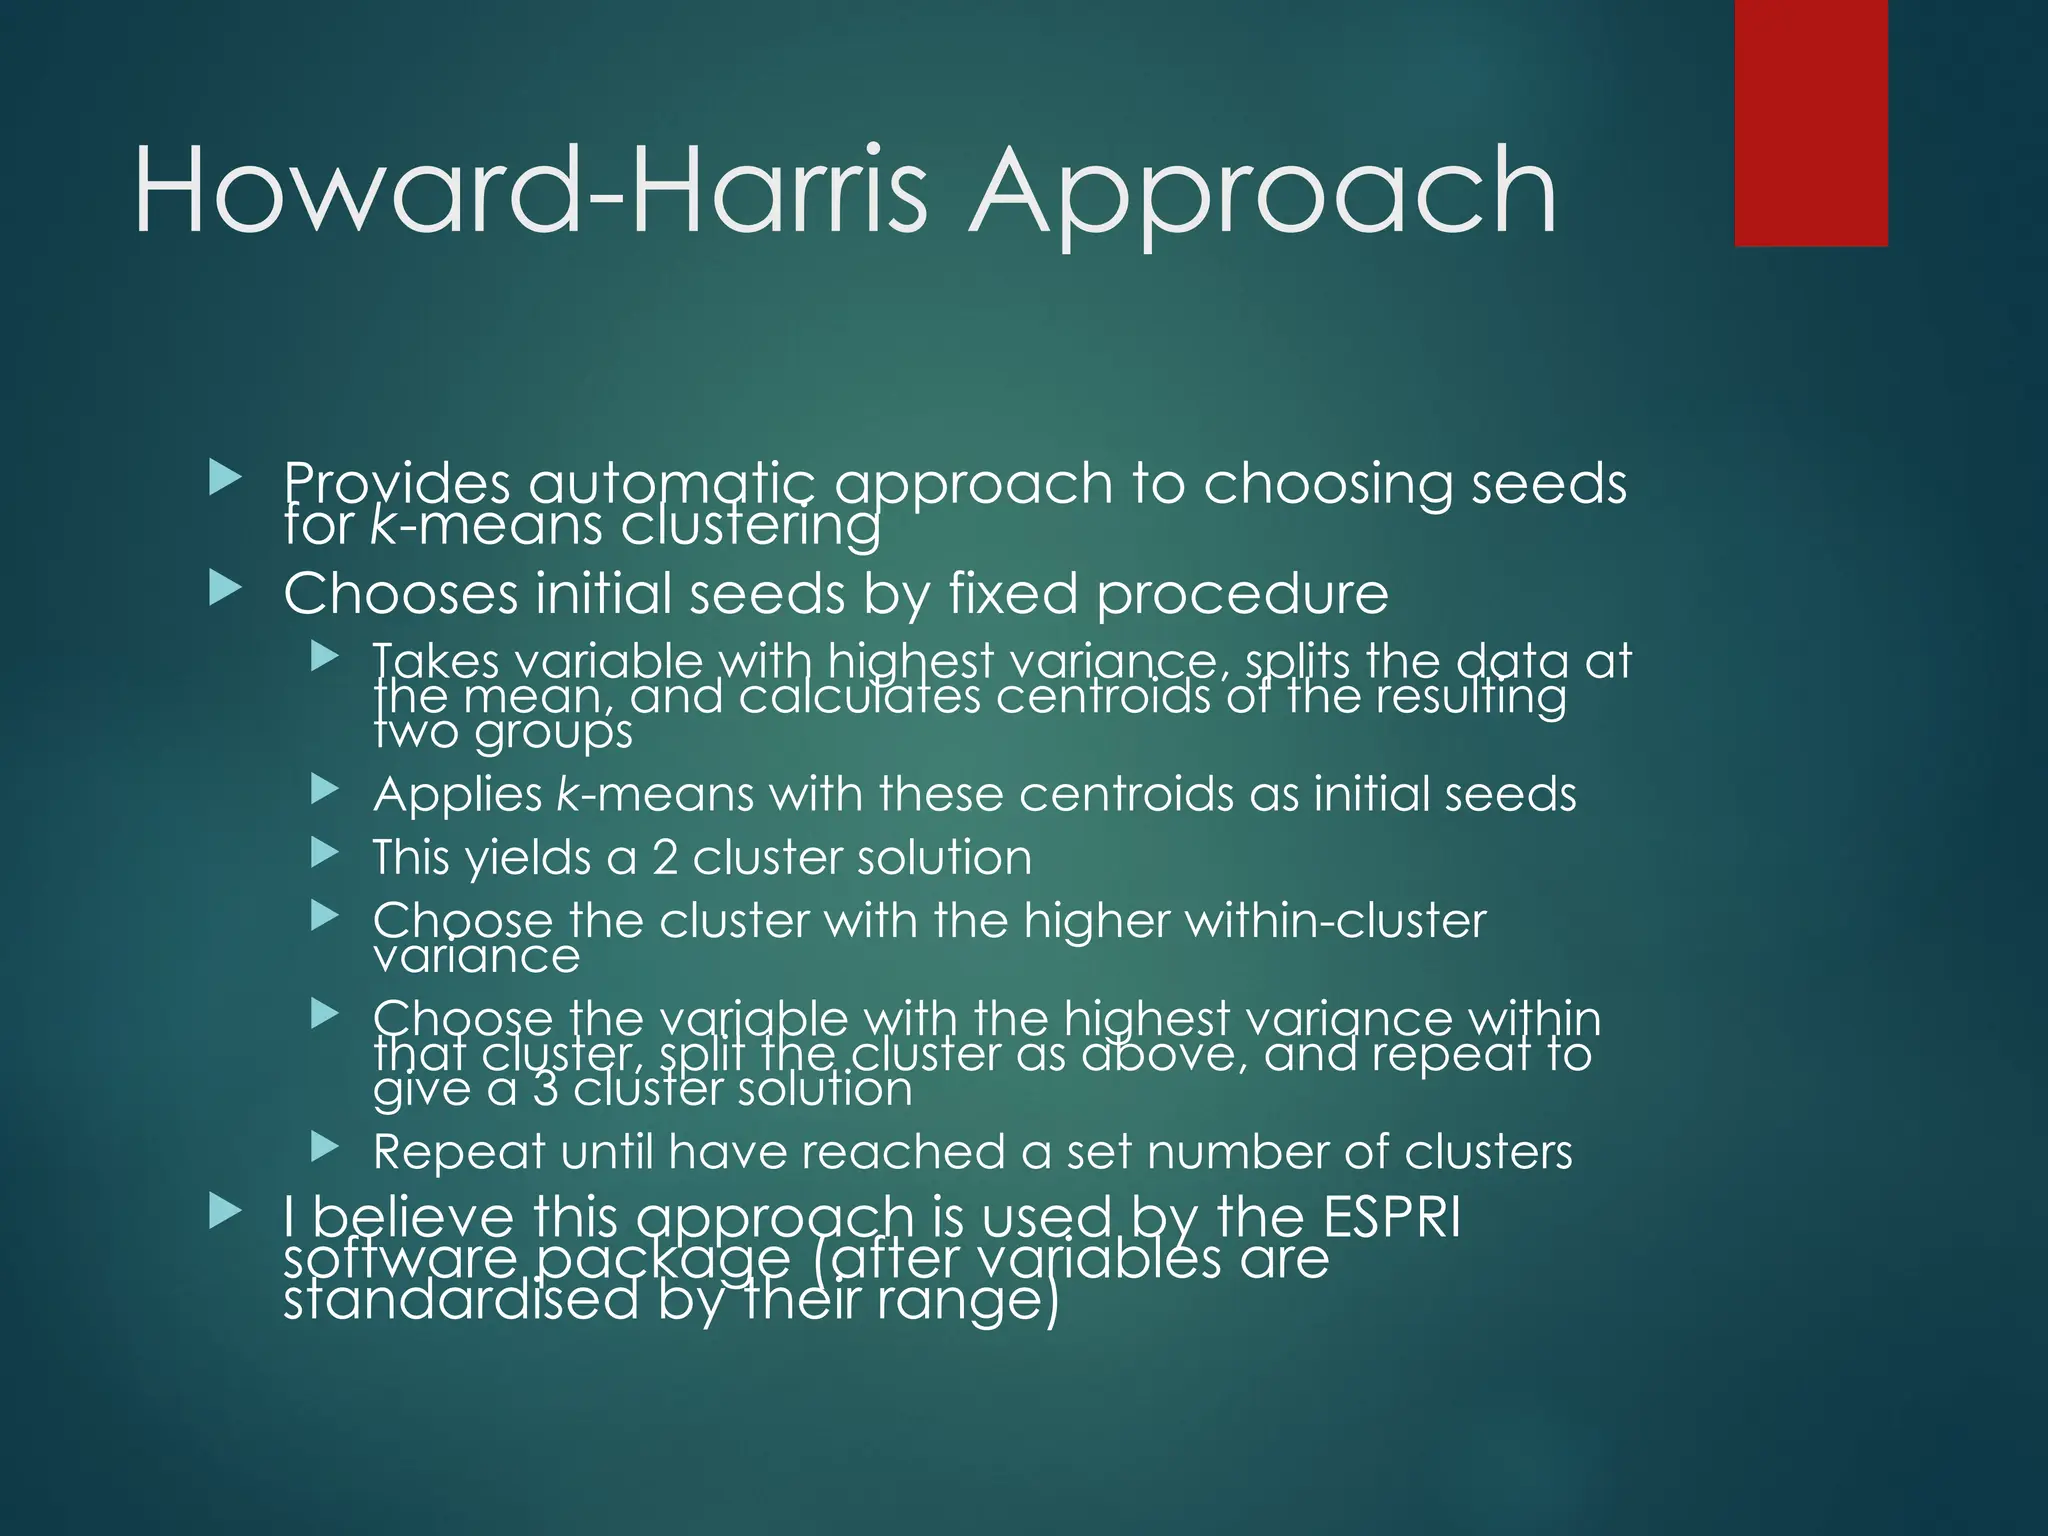
Howard-Harris Approach
Providesautomatic approach to choosing seeds
for k-means clustering
Chooses initial seeds by fixed procedure
Takes variable with highest variance, splits the data at
the mean, and calculates centroids of the resulting
two groups
Applies k-means with these centroids as initial seeds
This yields a 2 cluster solution
Choose the cluster with the higher within-cluster
variance
Choose the variable with the highest variance within
that cluster, split the cluster as above, and repeat to
give a 3 cluster solution
Repeat until have reached a set number of clusters
I believe this approach is used by the ESPRI
software package (after variables are
standardised by their range)
65.
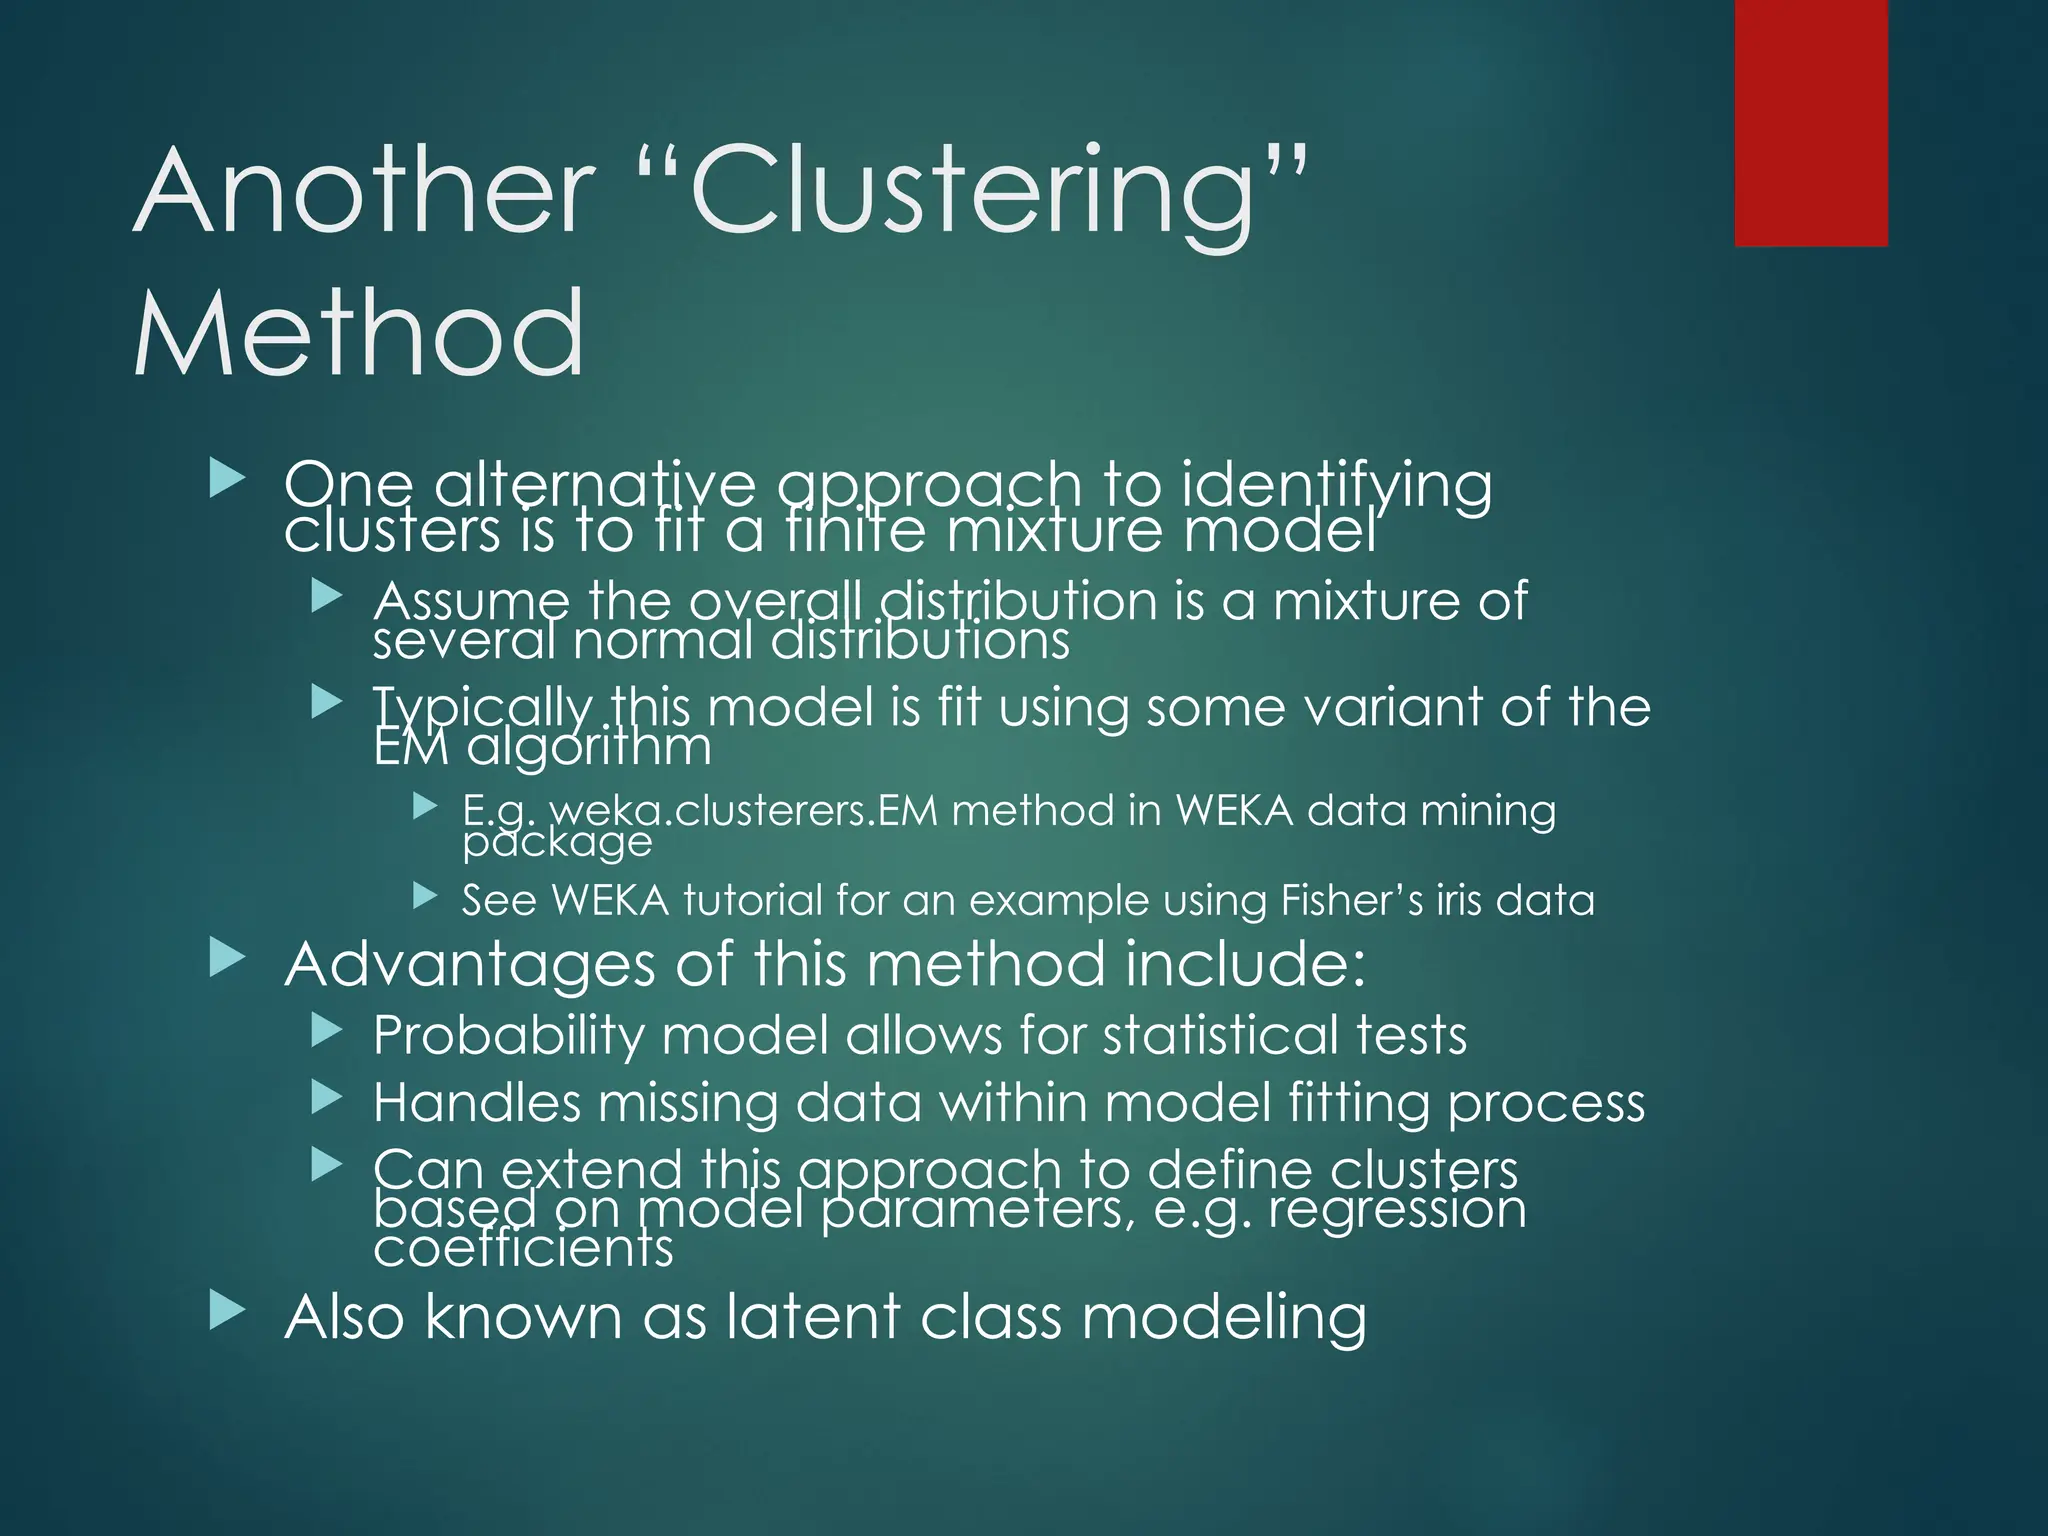
Another “Clustering”
Method
Onealternative approach to identifying
clusters is to fit a finite mixture model
Assume the overall distribution is a mixture of
several normal distributions
Typically this model is fit using some variant of the
EM algorithm
E.g. weka.clusterers.EM method in WEKA data mining
package
See WEKA tutorial for an example using Fisher’s iris data
Advantages of this method include:
Probability model allows for statistical tests
Handles missing data within model fitting process
Can extend this approach to define clusters
based on model parameters, e.g. regression
coefficients
Also known as latent class modeling
Choice Models
1. Observechoice:
(Buy/not buy => direct marketers
Brand bought
packaged goods, ABB)
2. Capture related data:
demographics
attitudes/perceptions
market conditions (price, promotion, etc.)
3. Link
1 to 2 via “choice model” model reveals
importance weights of characteristics
68.
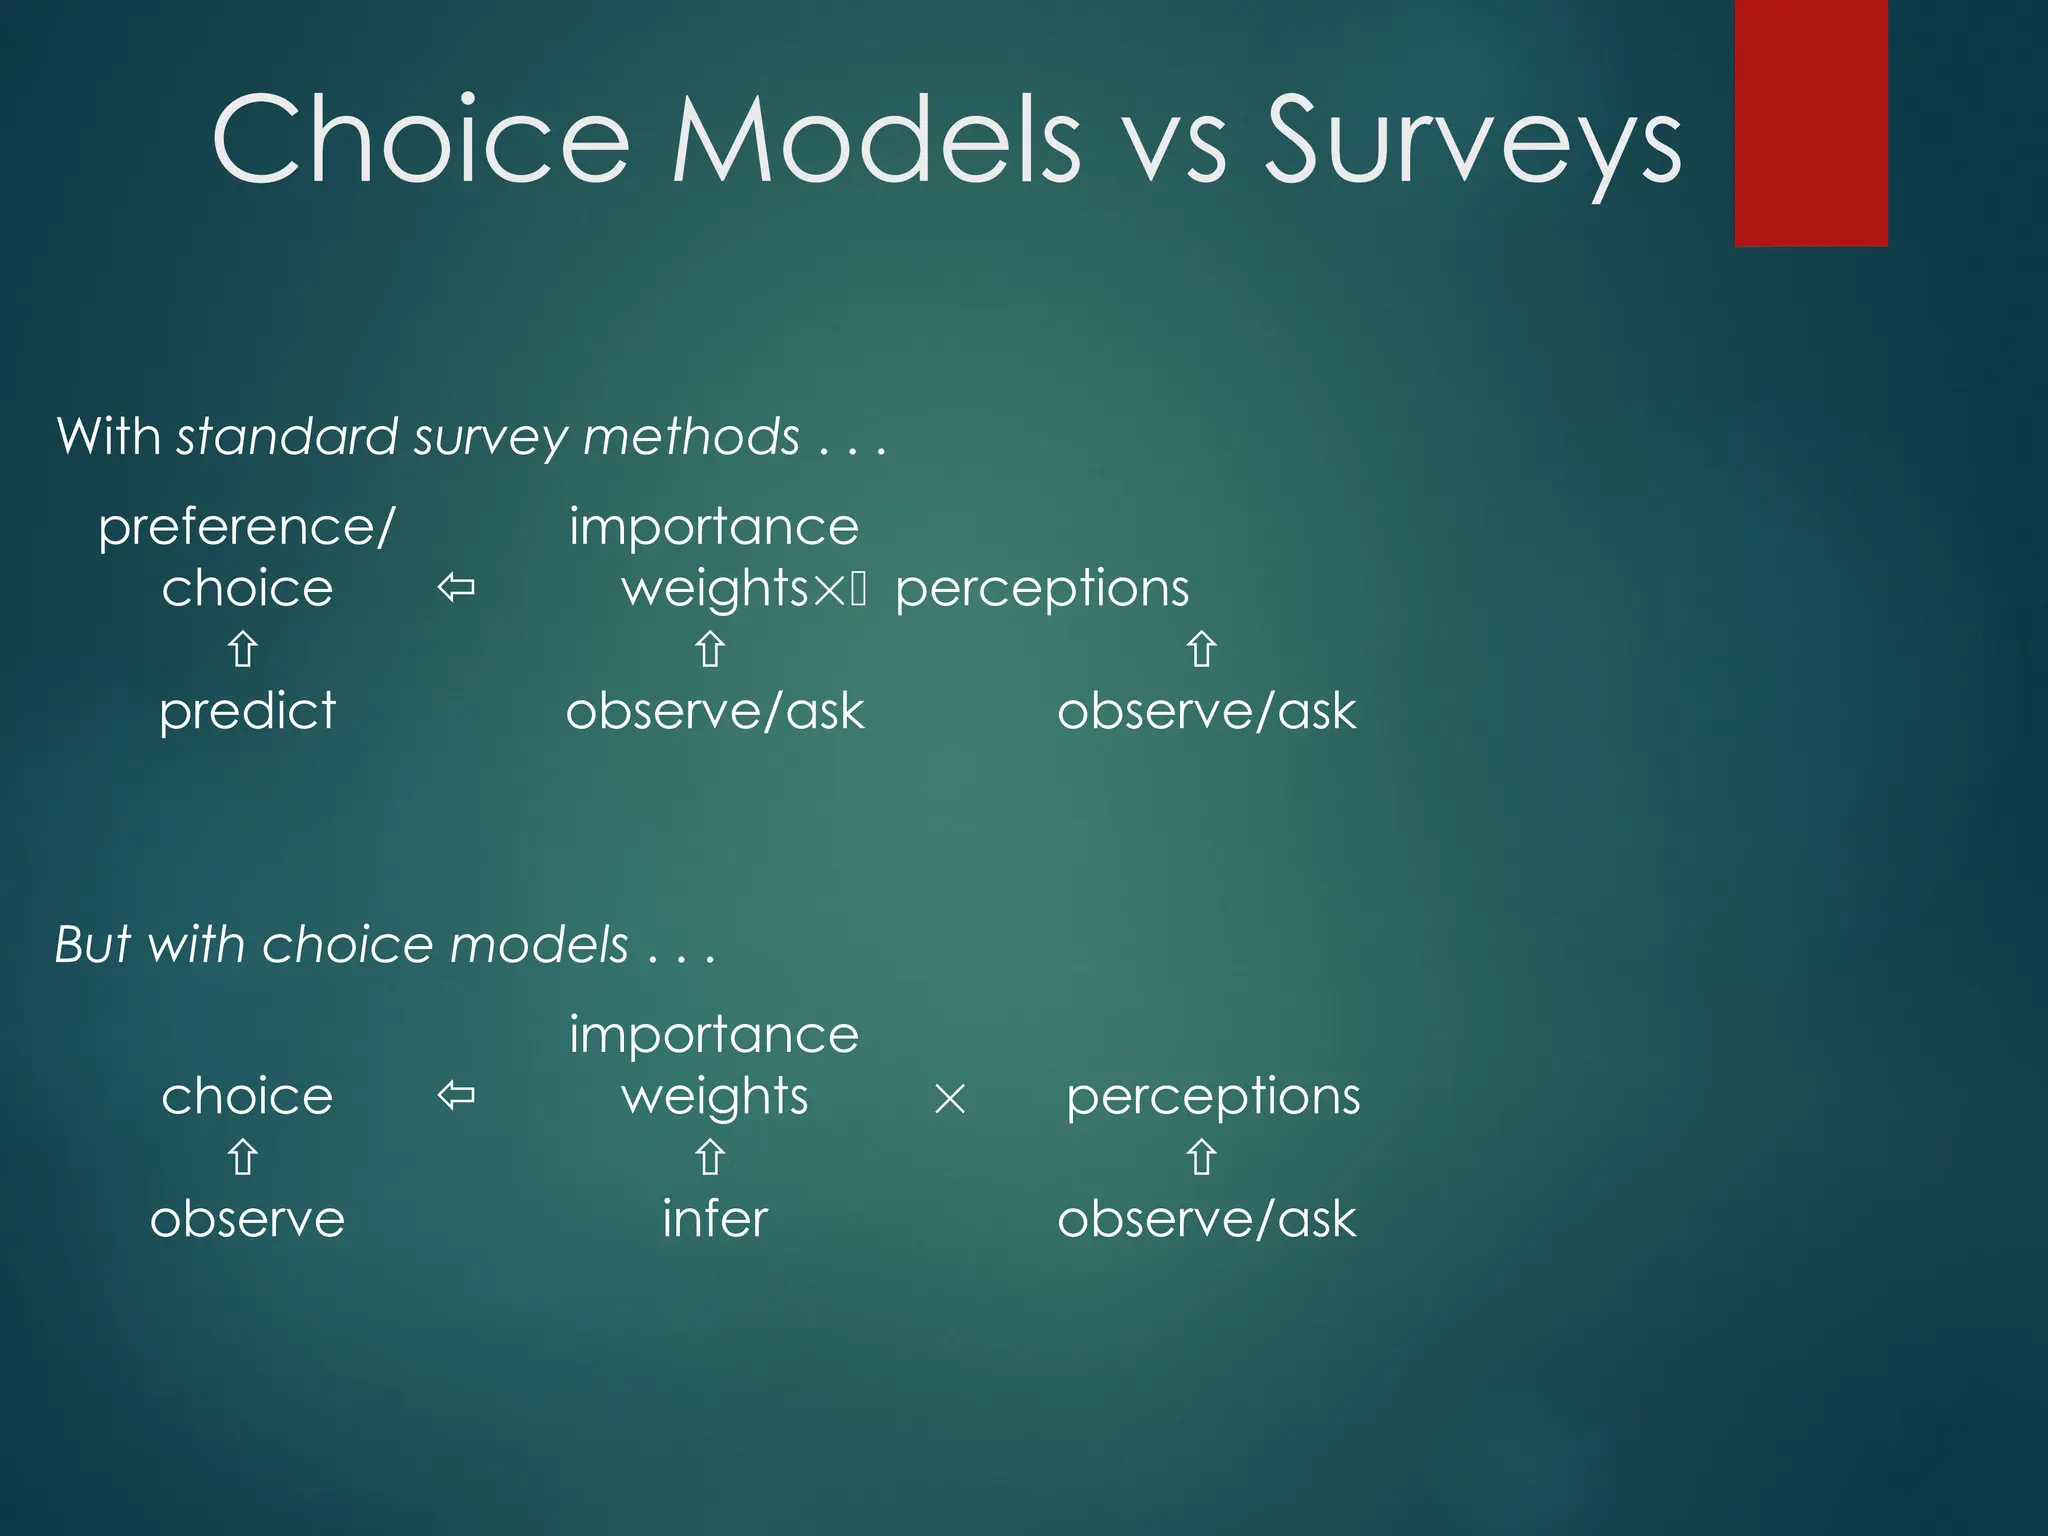
Choice Models vsSurveys
With standard survey methods . . .
preference/ importance
choice weightsperceptions
predict observe/ask observe/ask
But with choice models . . .
importance
choice weights perceptions
observe infer observe/ask
69.
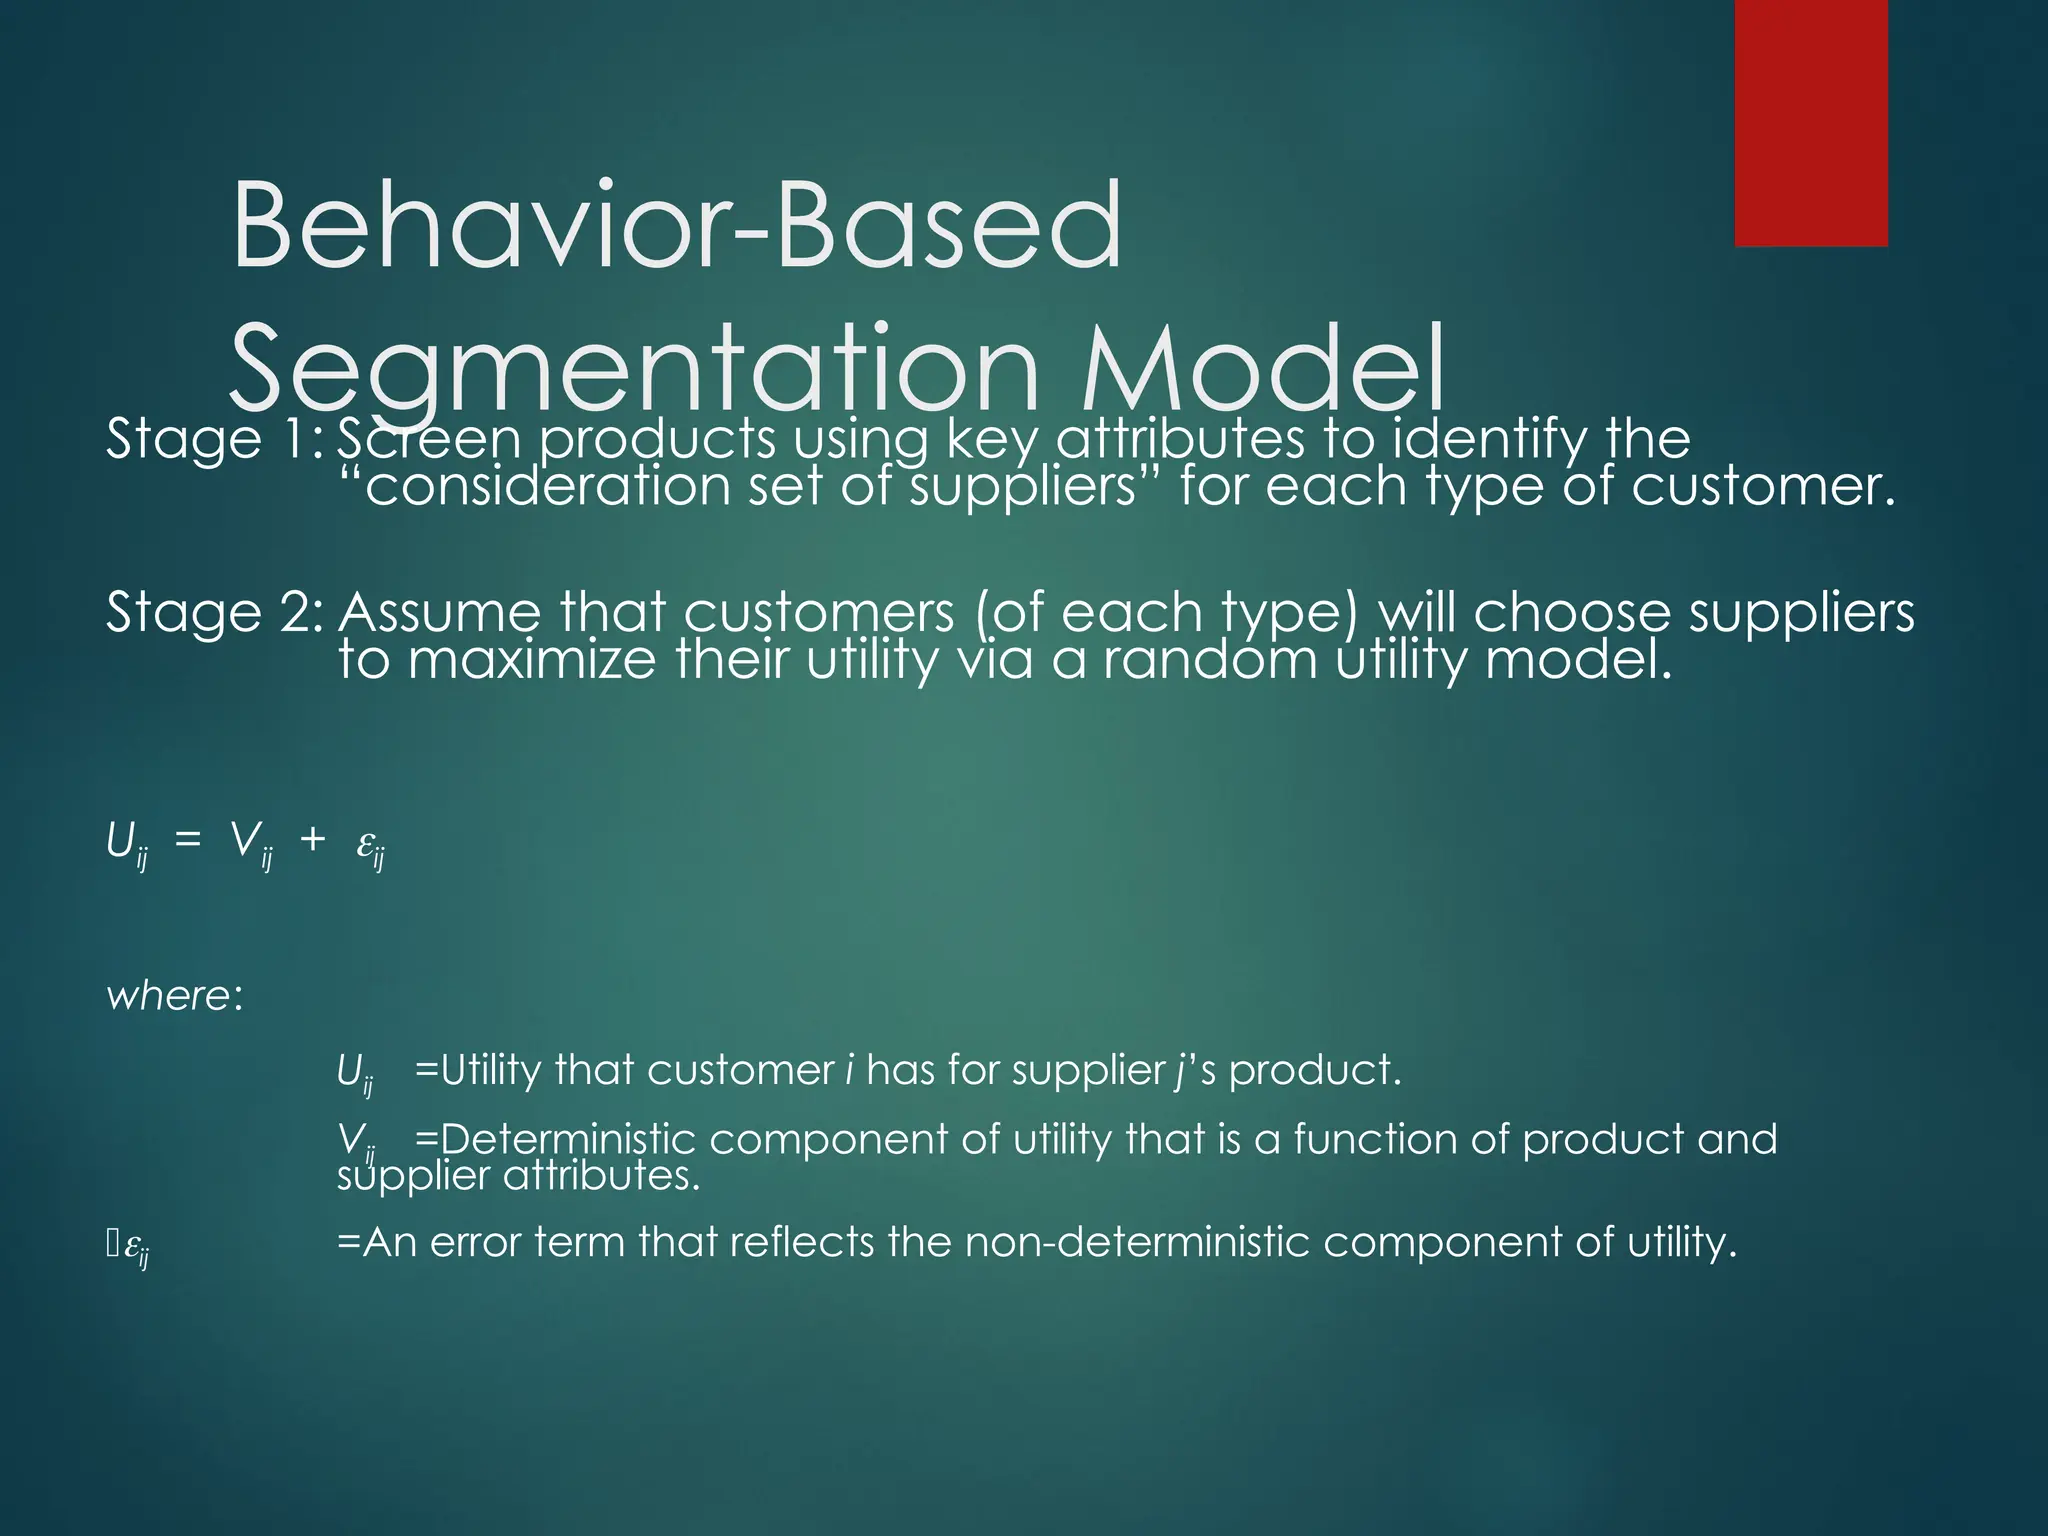
Behavior-Based
Segmentation Model
Stage 1:Screen products using key attributes to identify the
“consideration set of suppliers” for each type of customer.
Stage 2: Assume that customers (of each type) will choose suppliers
to maximize their utility via a random utility model.
Uij = Vij + ij
where:
Uij =Utility that customer i has for supplier j’s product.
Vij =Deterministic component of utility that is a function of product and
supplier attributes.
ij =An error term that reflects the non-deterministic component of utility.
70.
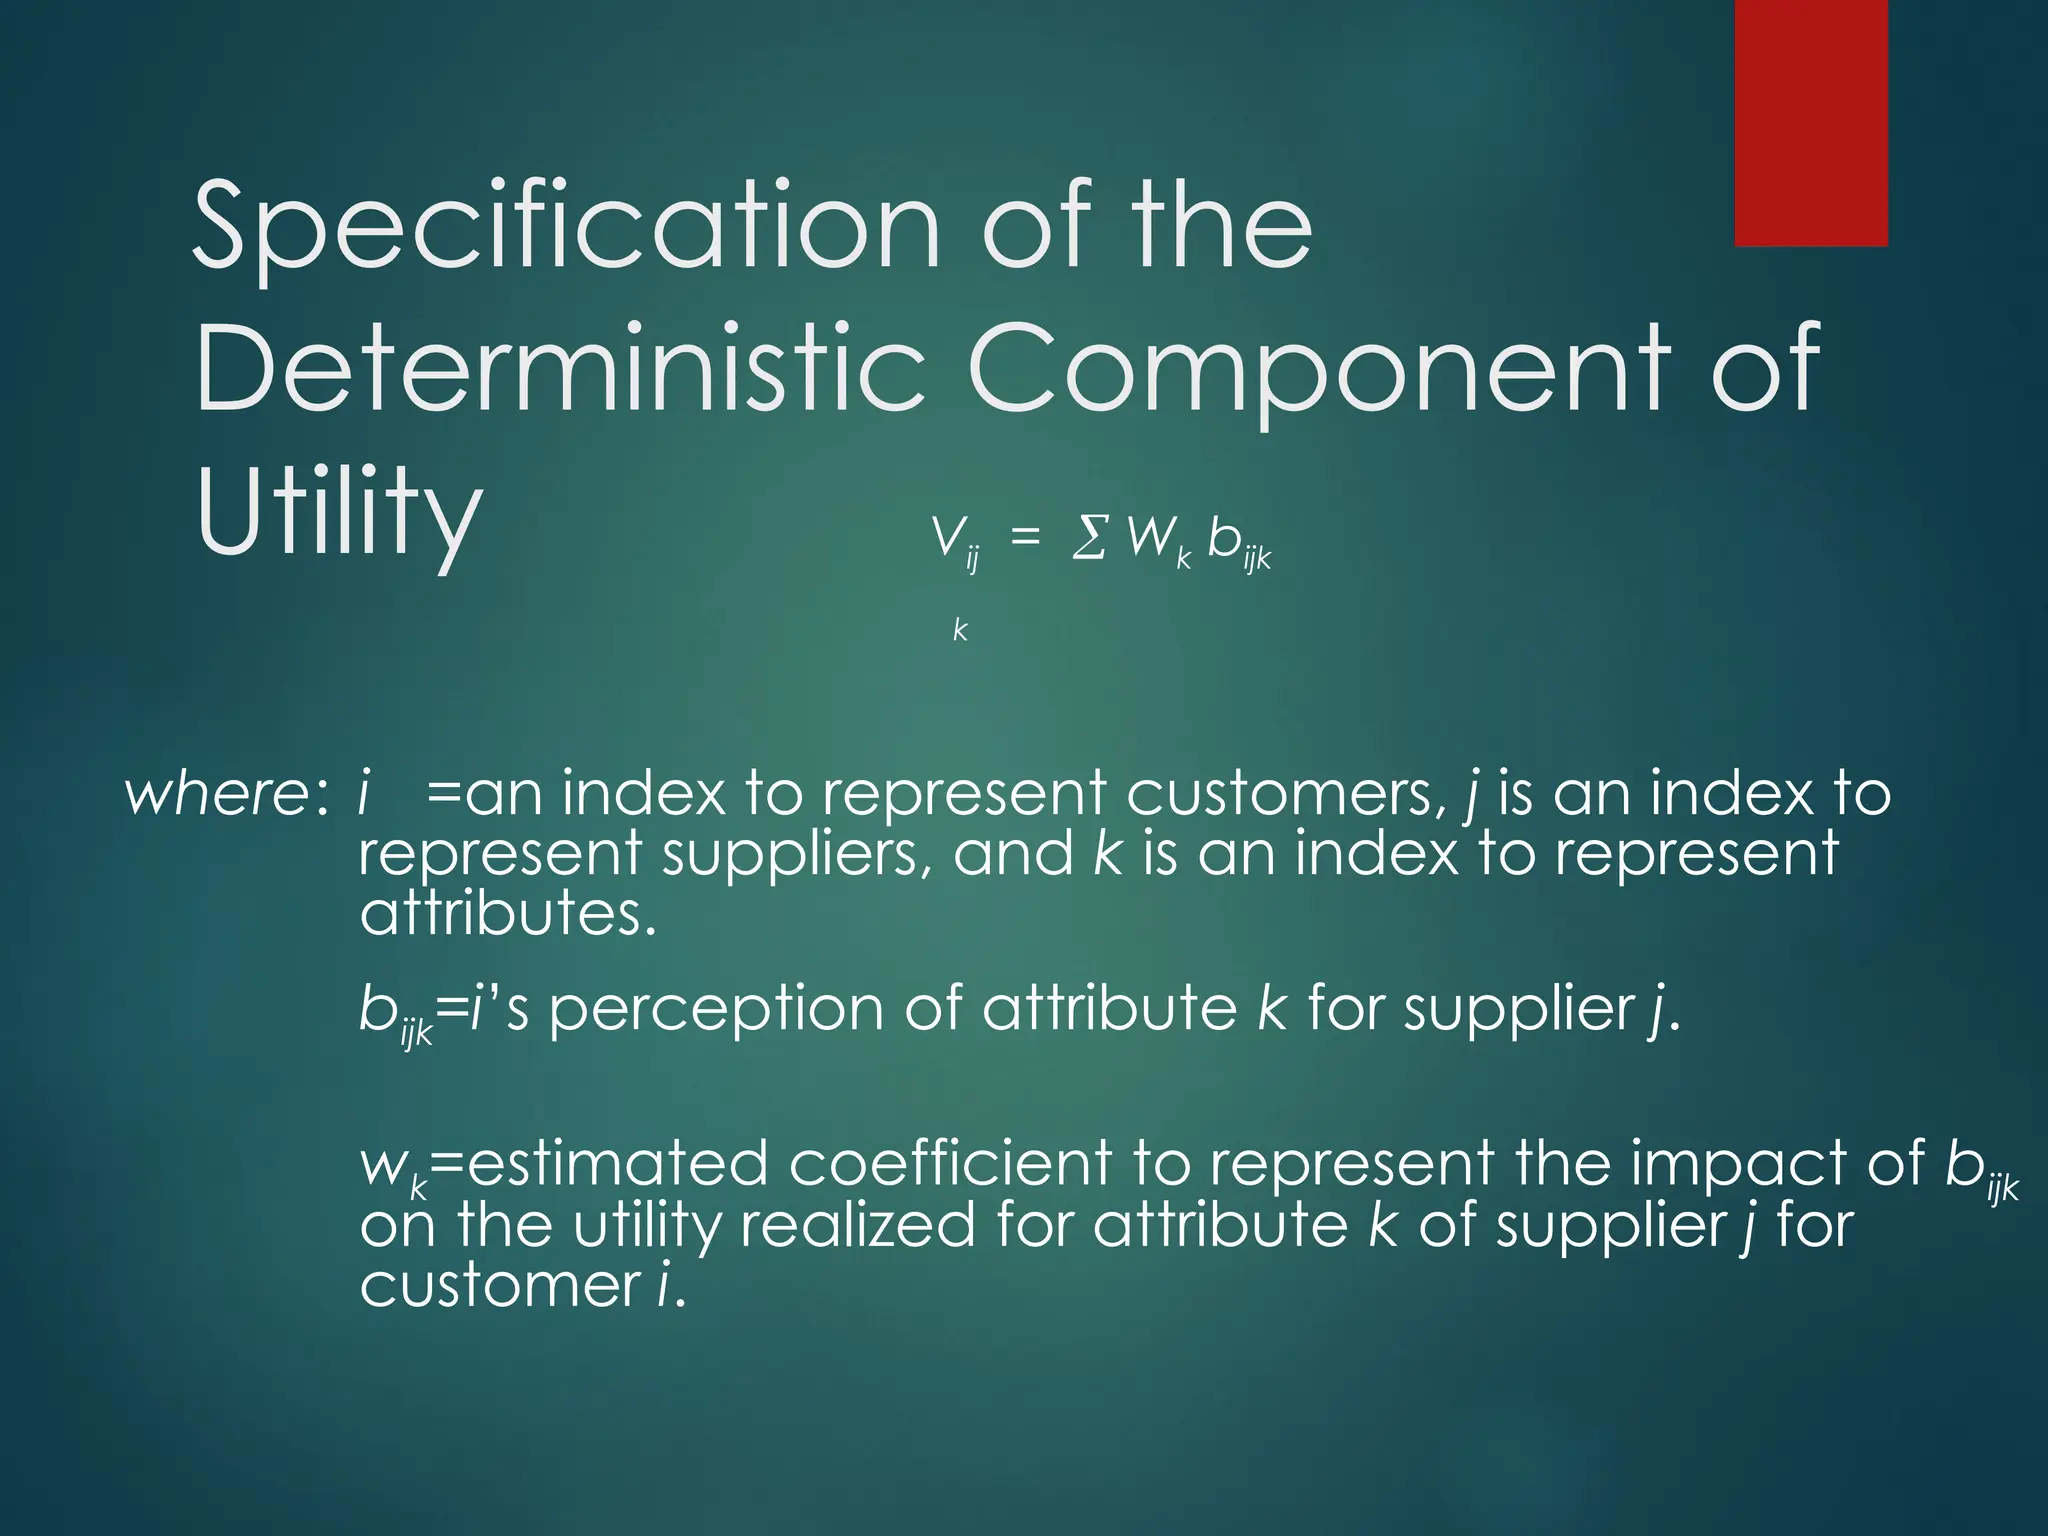
Specification of the
DeterministicComponent of
Utility Vij = Wk bijk
k
where: i =an index to represent customers, j is an index to
represent suppliers, and k is an index to represent
attributes.
bijk=i’s perception of attribute k for supplier j.
wk=estimated coefficient to represent the impact of bijk
on the utility realized for attribute k of supplier j for
customer i.
71.
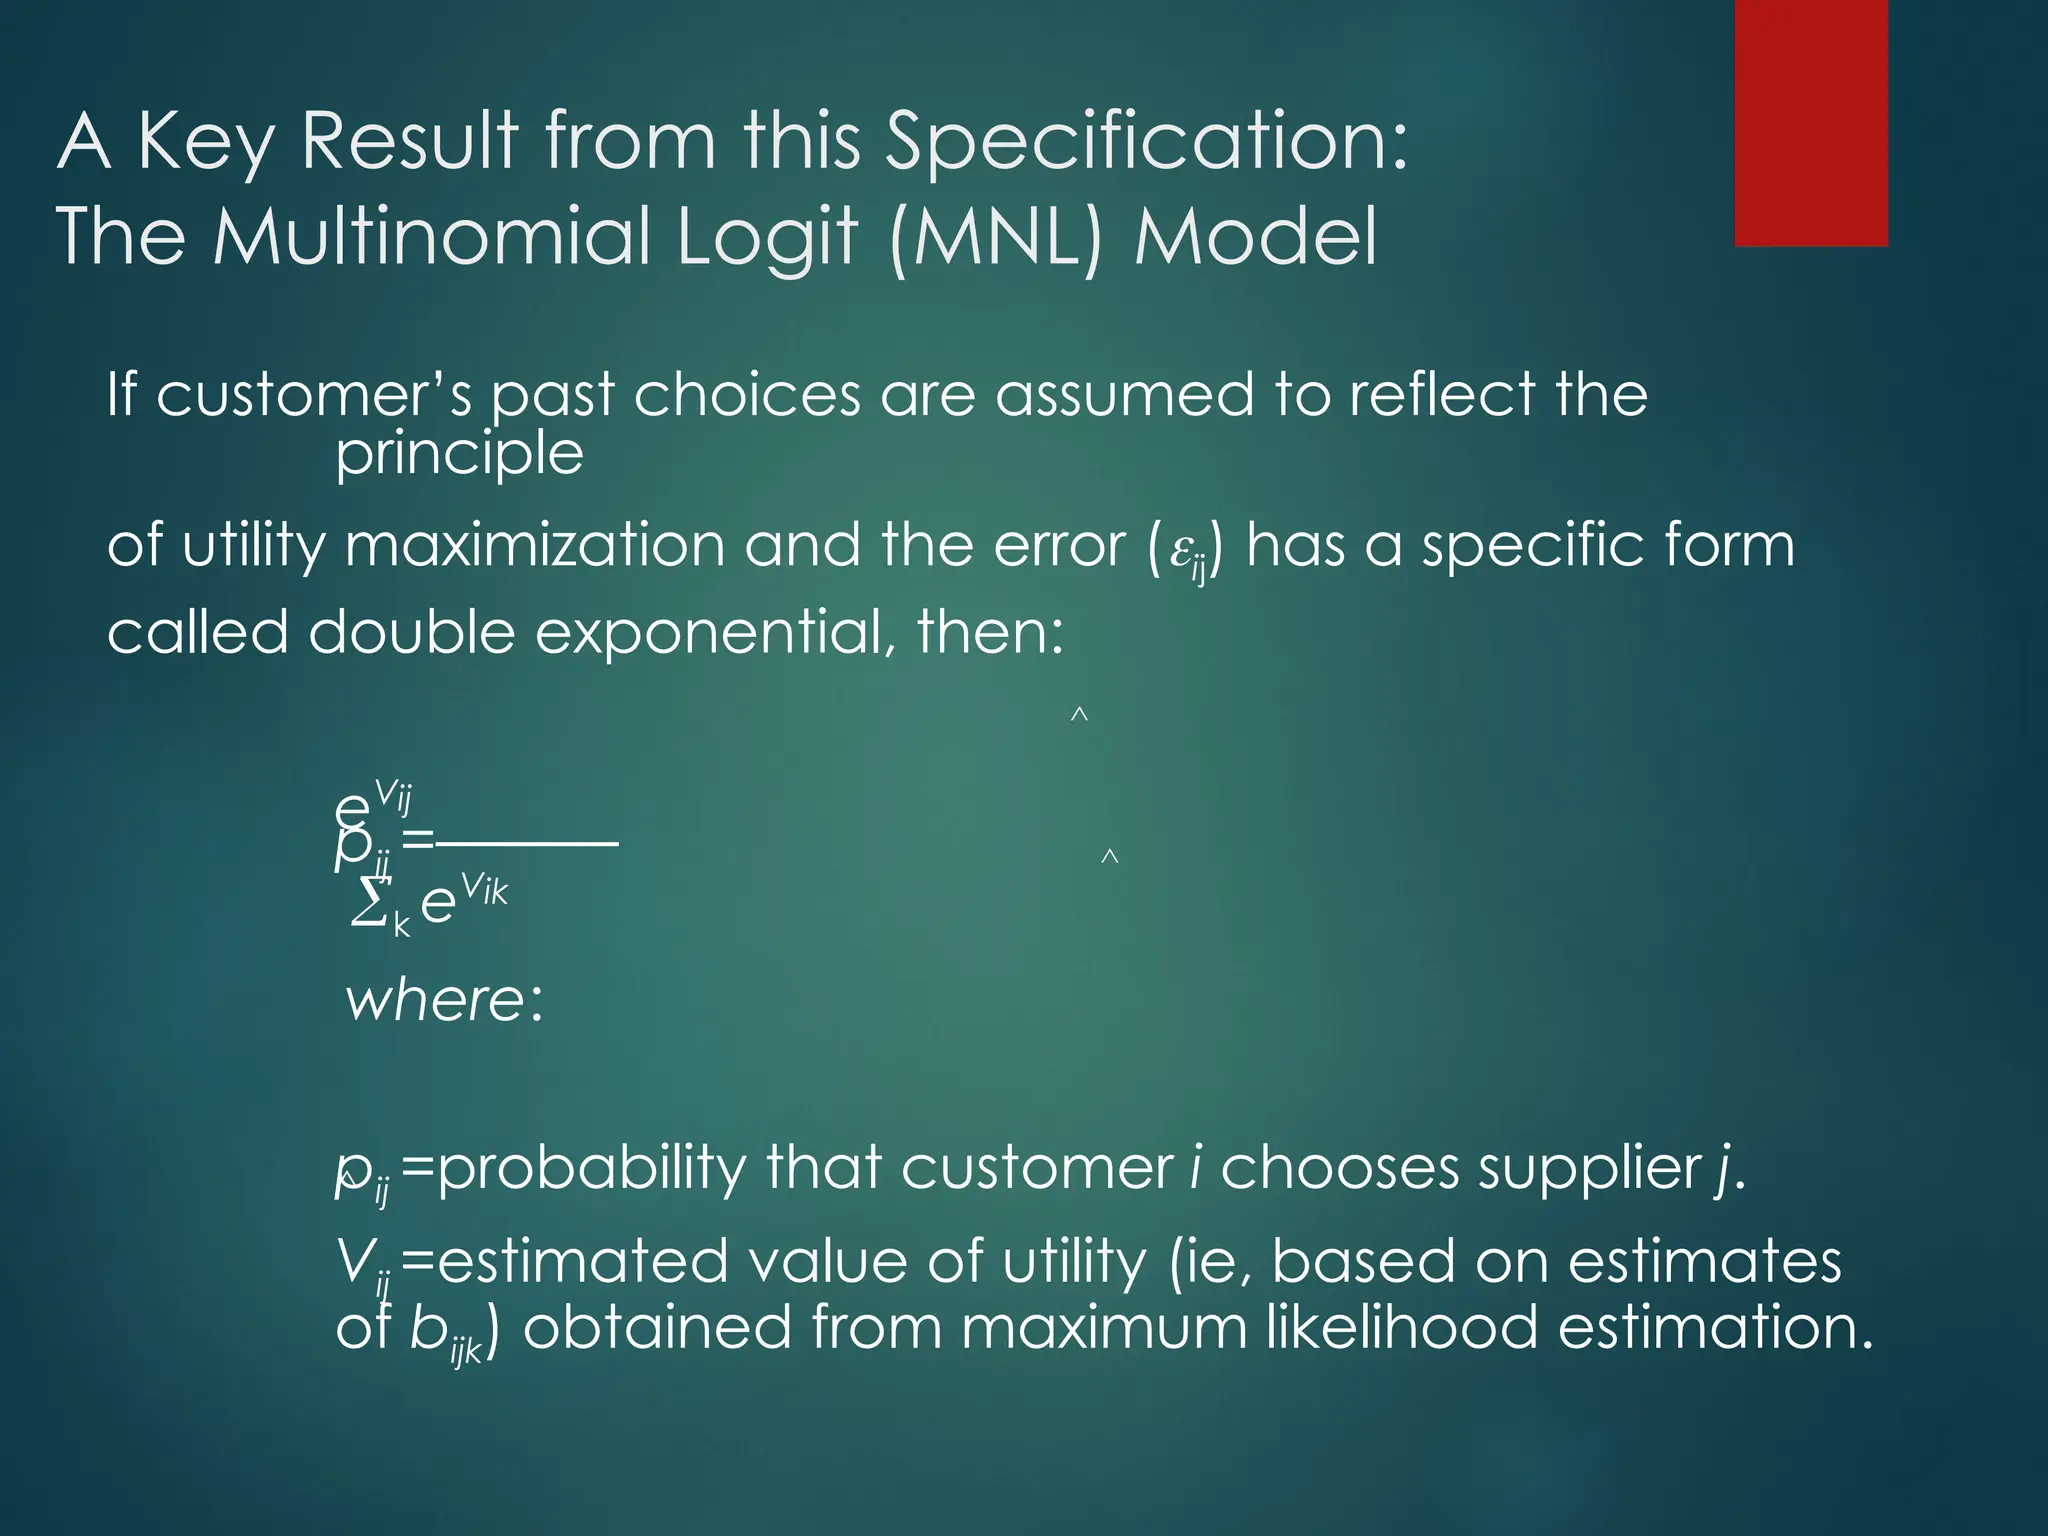
A Key Resultfrom this Specification:
The Multinomial Logit (MNL) Model
If customer’s past choices are assumed to reflect the
principle
of utility maximization and the error (ij) has a specific form
called double exponential, then:
eVij
pij =––––––
k eVik
where:
pij =probability that customer i chooses supplier j.
Vij =estimated value of utility (ie, based on estimates
of bijk) obtained from maximum likelihood estimation.
^
^
^
72.
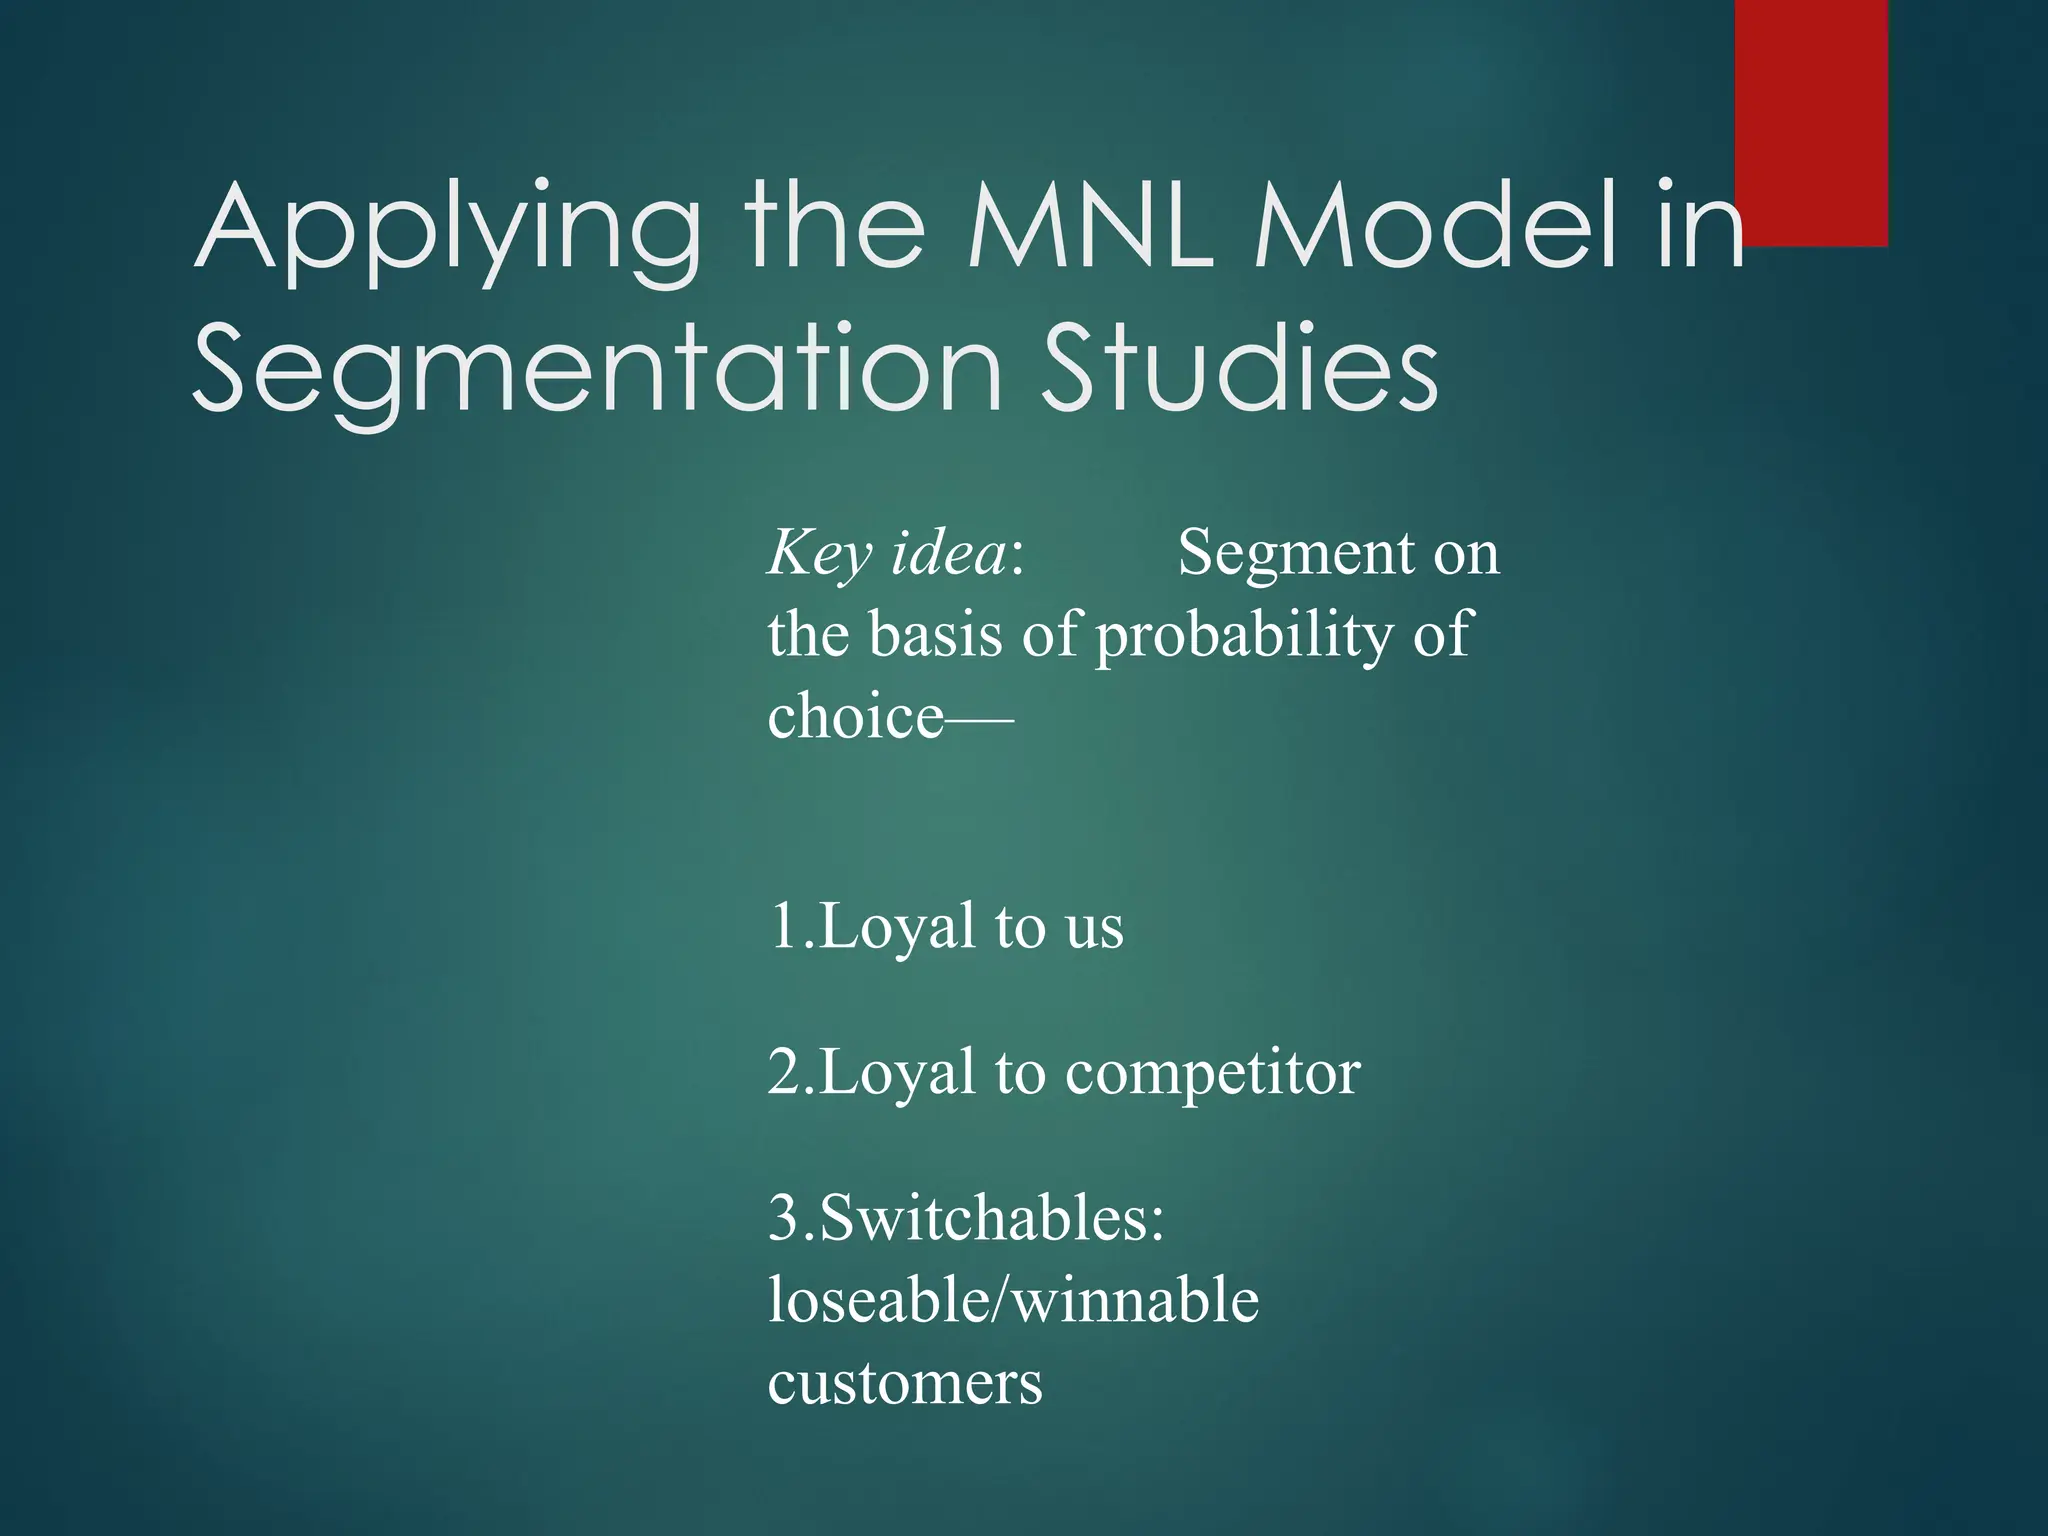
Key idea: Segmenton
the basis of probability of
choice—
1.Loyal to us
2.Loyal to competitor
3.Switchables:
loseable/winnable
customers
Applying the MNL Model in
Segmentation Studies
73.
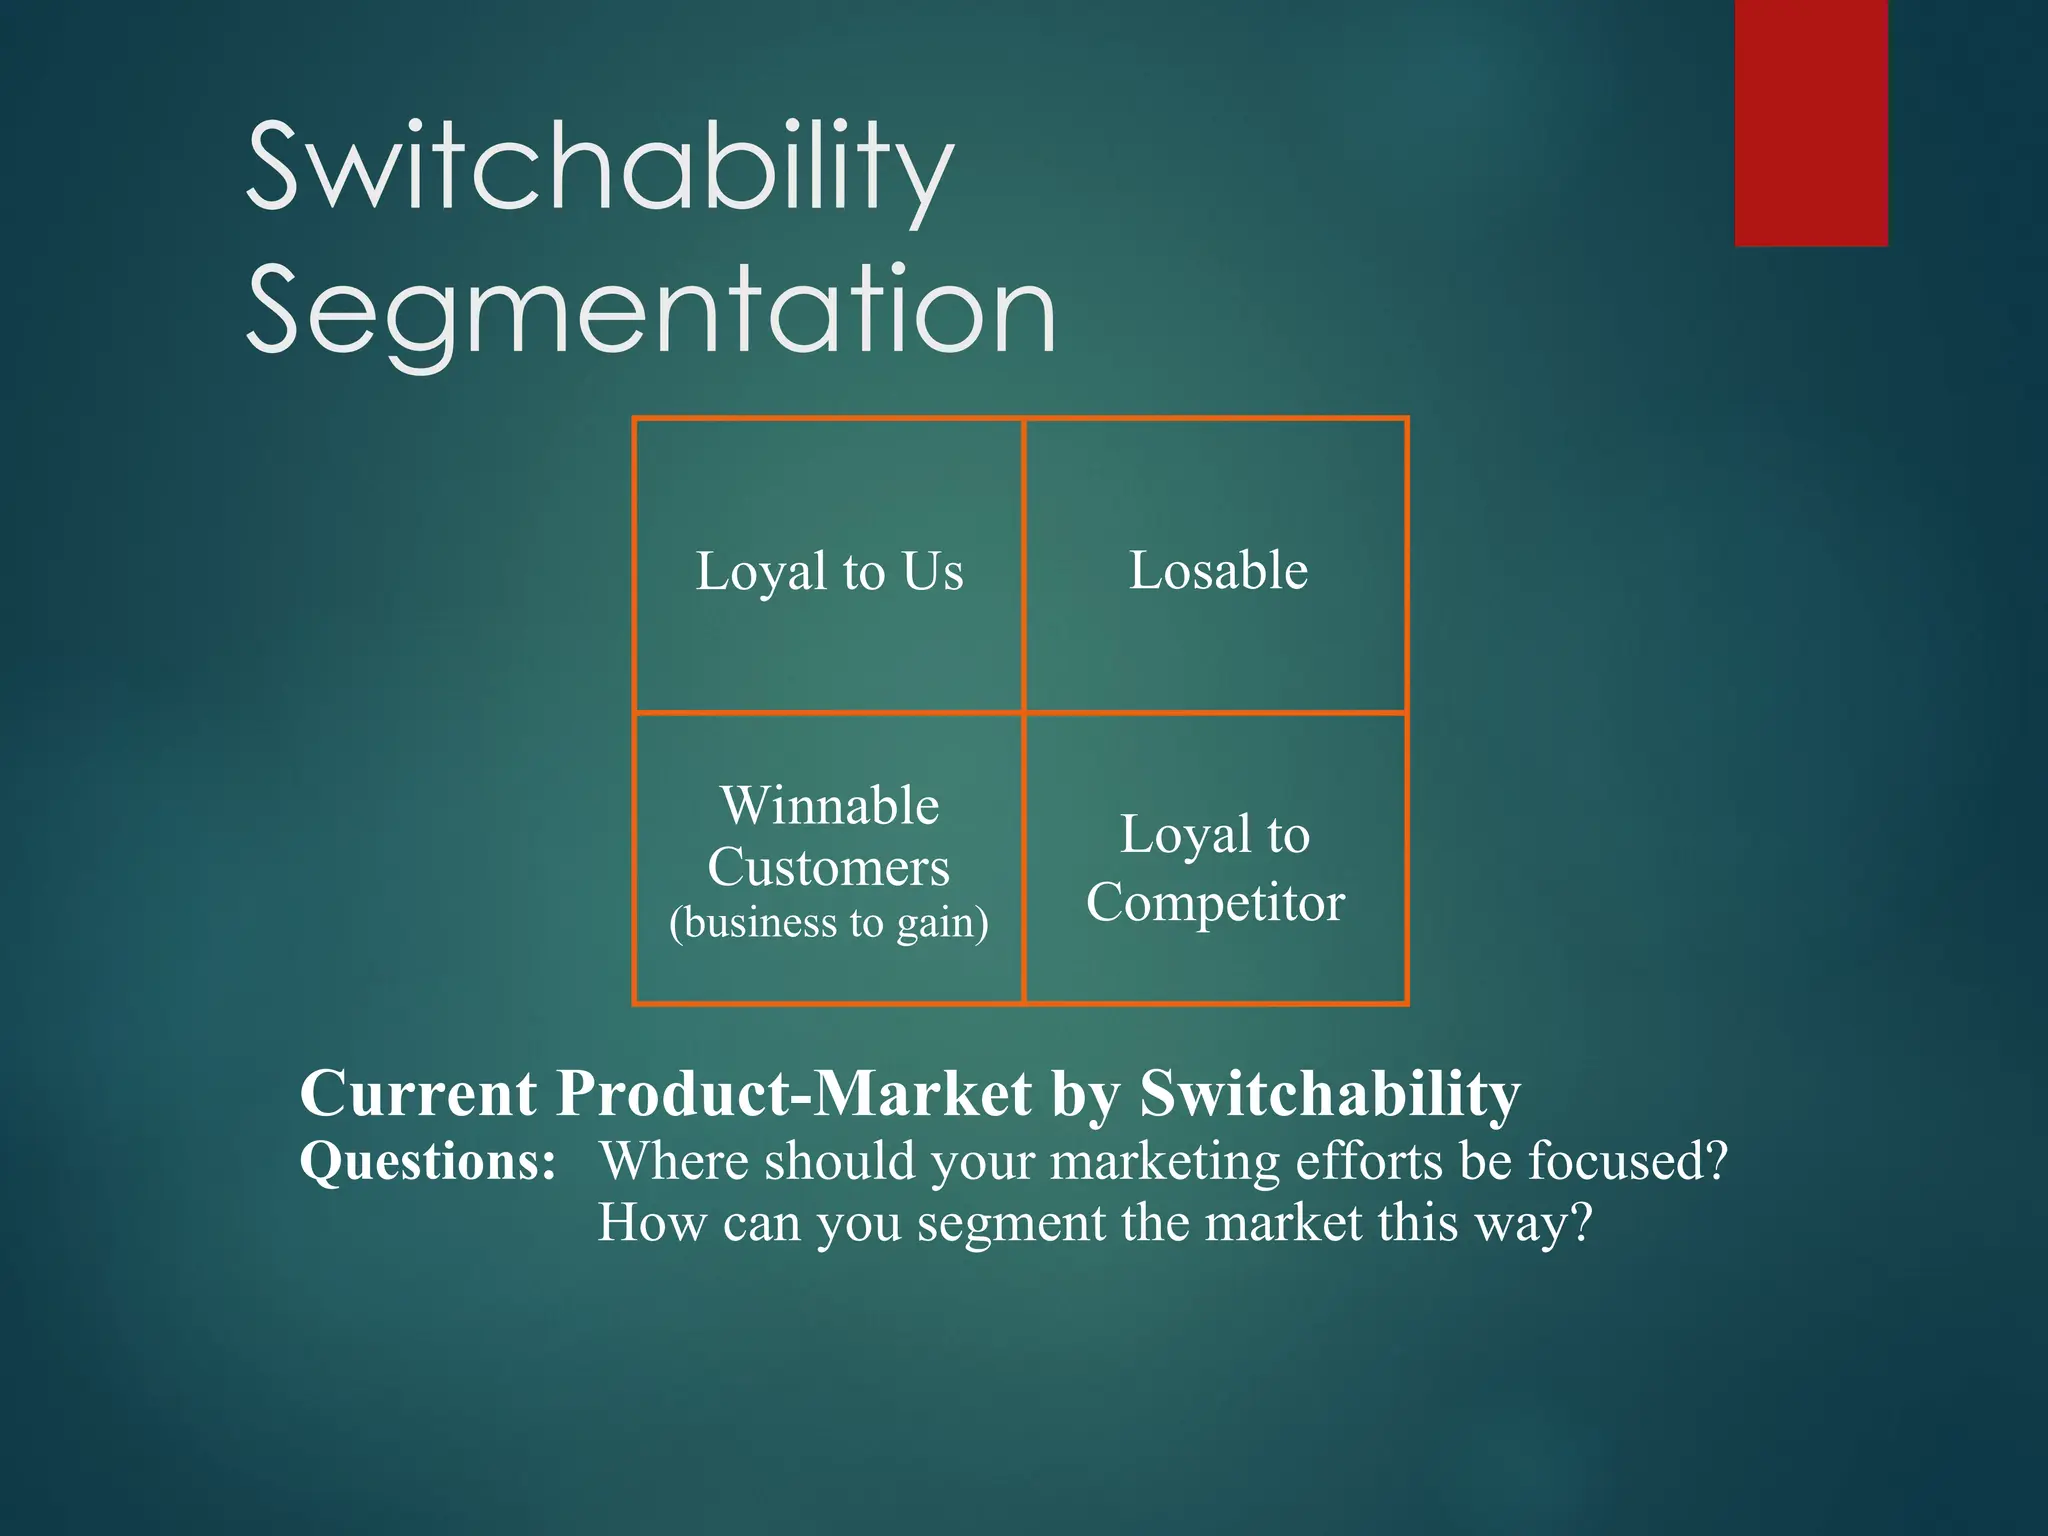
Switchability
Segmentation
Current Product-Market bySwitchability
Questions: Where should your marketing efforts be focused?
How can you segment the market this way?
Loyal to Us Losable
Winnable
Customers
(business to gain)
Loyal to
Competitor
74.
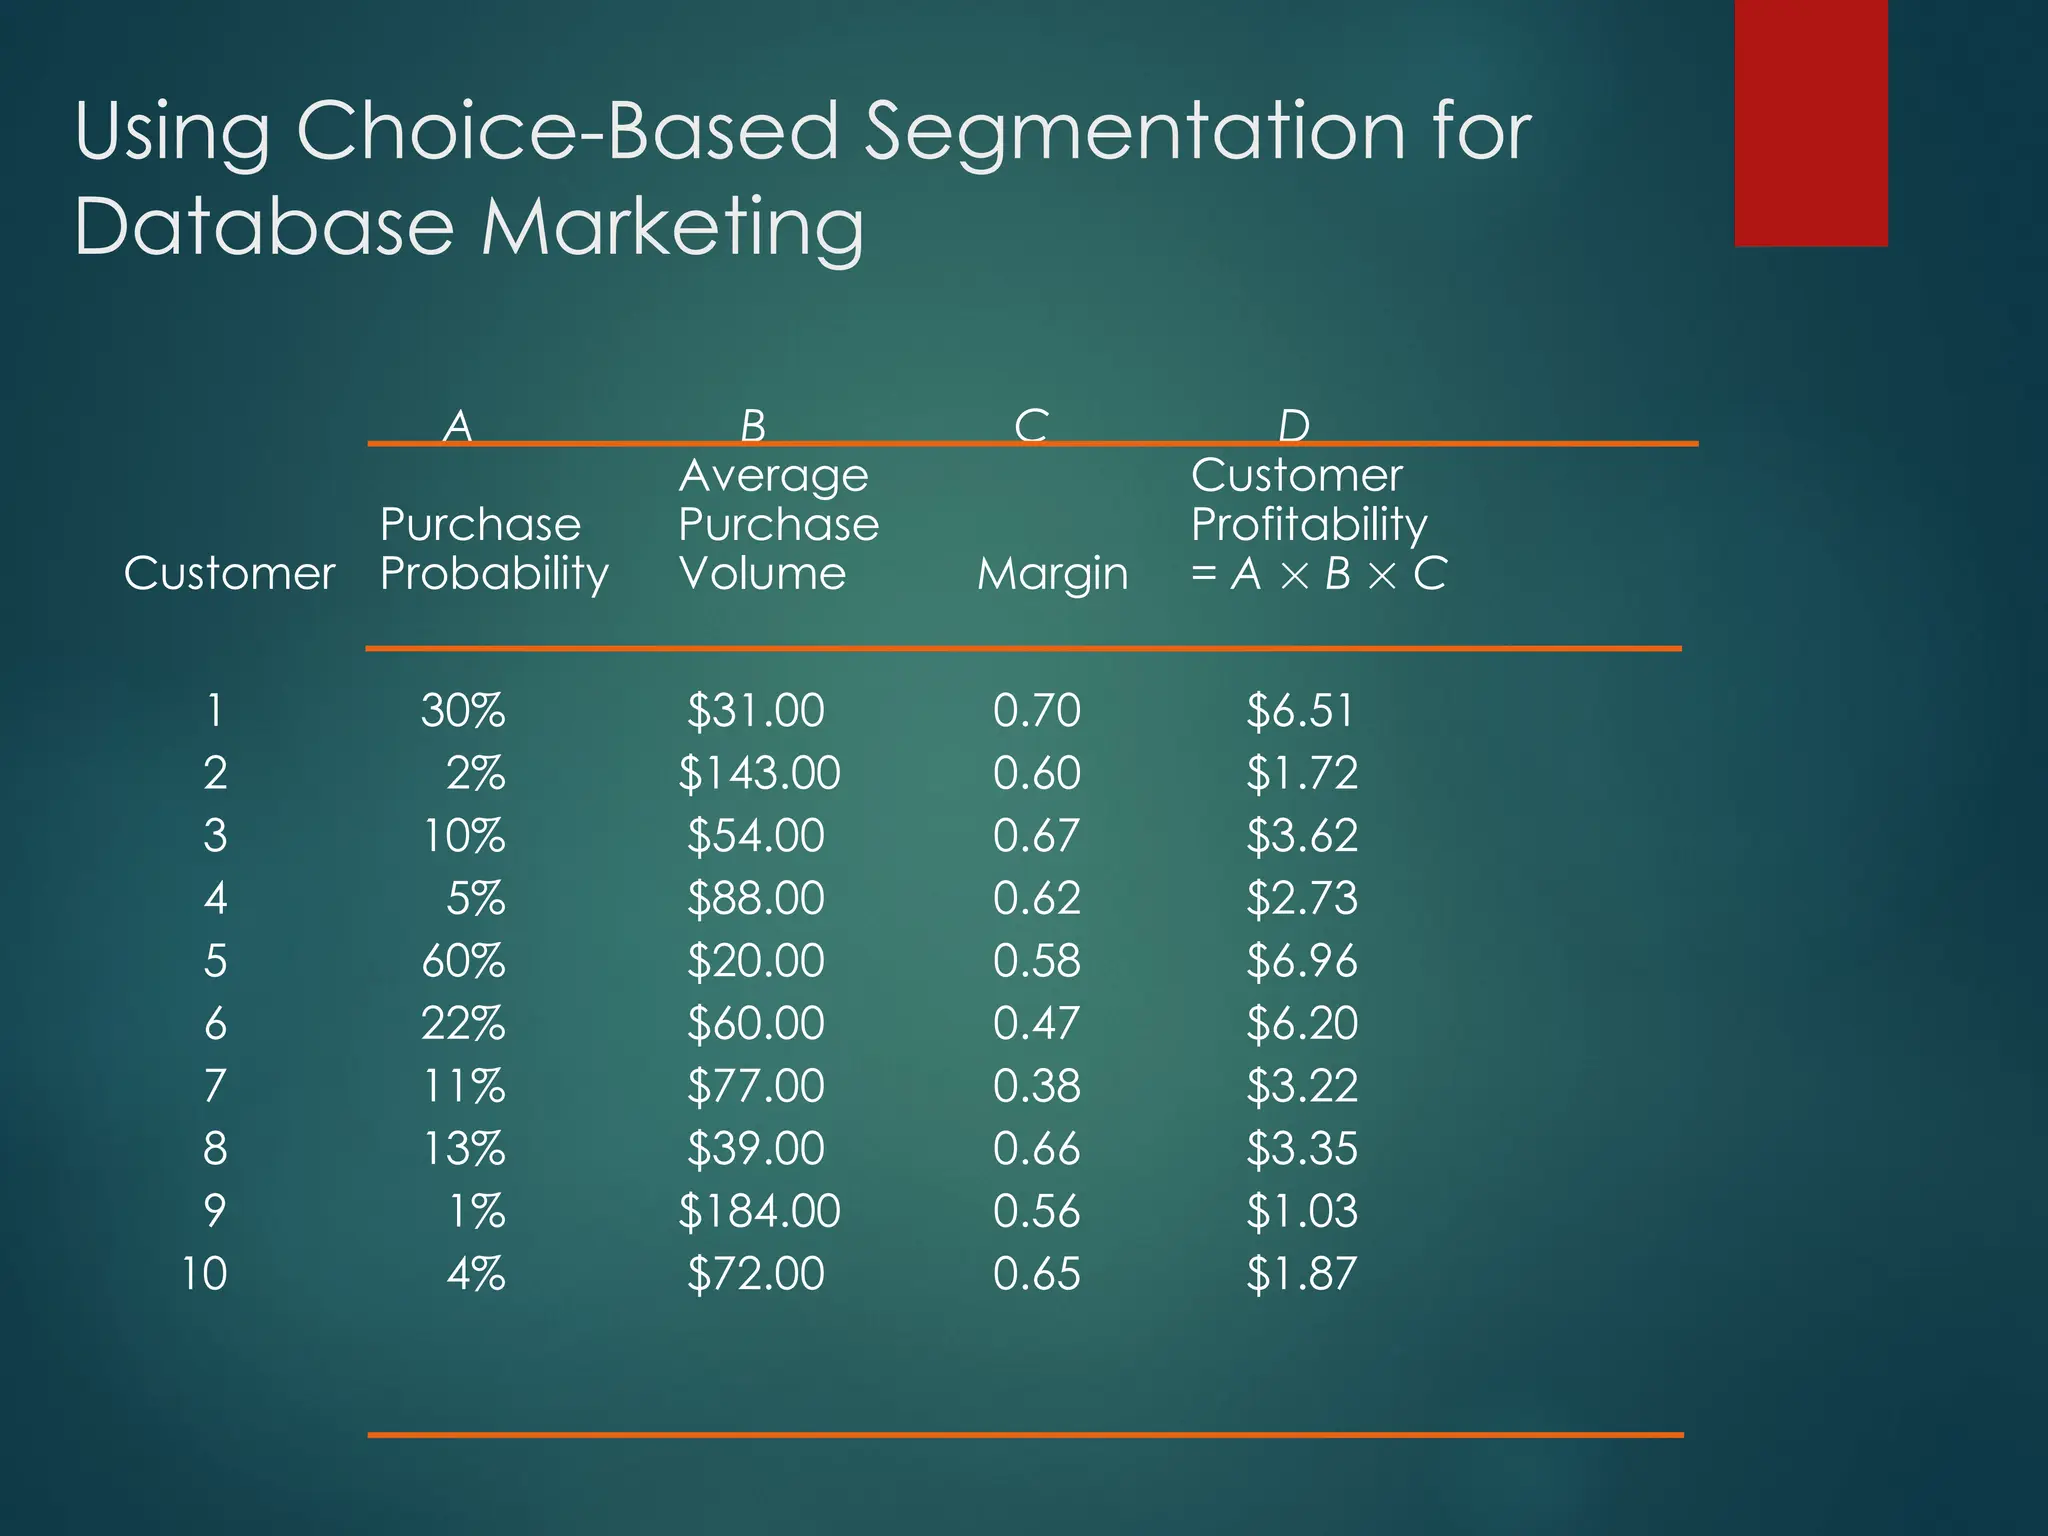
Using Choice-Based Segmentationfor
Database Marketing
A B C D
Average Customer
Purchase Purchase Profitability
Customer Probability Volume Margin = A B C
1 30% $31.00 0.70 $6.51
2 2% $143.00 0.60 $1.72
3 10% $54.00 0.67 $3.62
4 5% $88.00 0.62 $2.73
5 60% $20.00 0.58 $6.96
6 22% $60.00 0.47 $6.20
7 11% $77.00 0.38 $3.22
8 13% $39.00 0.66 $3.35
9 1% $184.00 0.56 $1.03
10 4% $72.00 0.65 $1.87
75.
Managerial Uses of
SegmentationAnalysis
Select attractive segments for focused effort
(Can use models such as Analytic Hierarchy
Process or GE Planning Matrix).
Develop a marketing plan (4P’s and positioning)
to target selected segments.
In consumer markets, we typically rely on advertising and
channel members to selectively reach targeted segments.
In business markets, we use sales force and direct marketing.
You can use the results from the discriminant analysis to
assign new customers to one of the segments.
76.
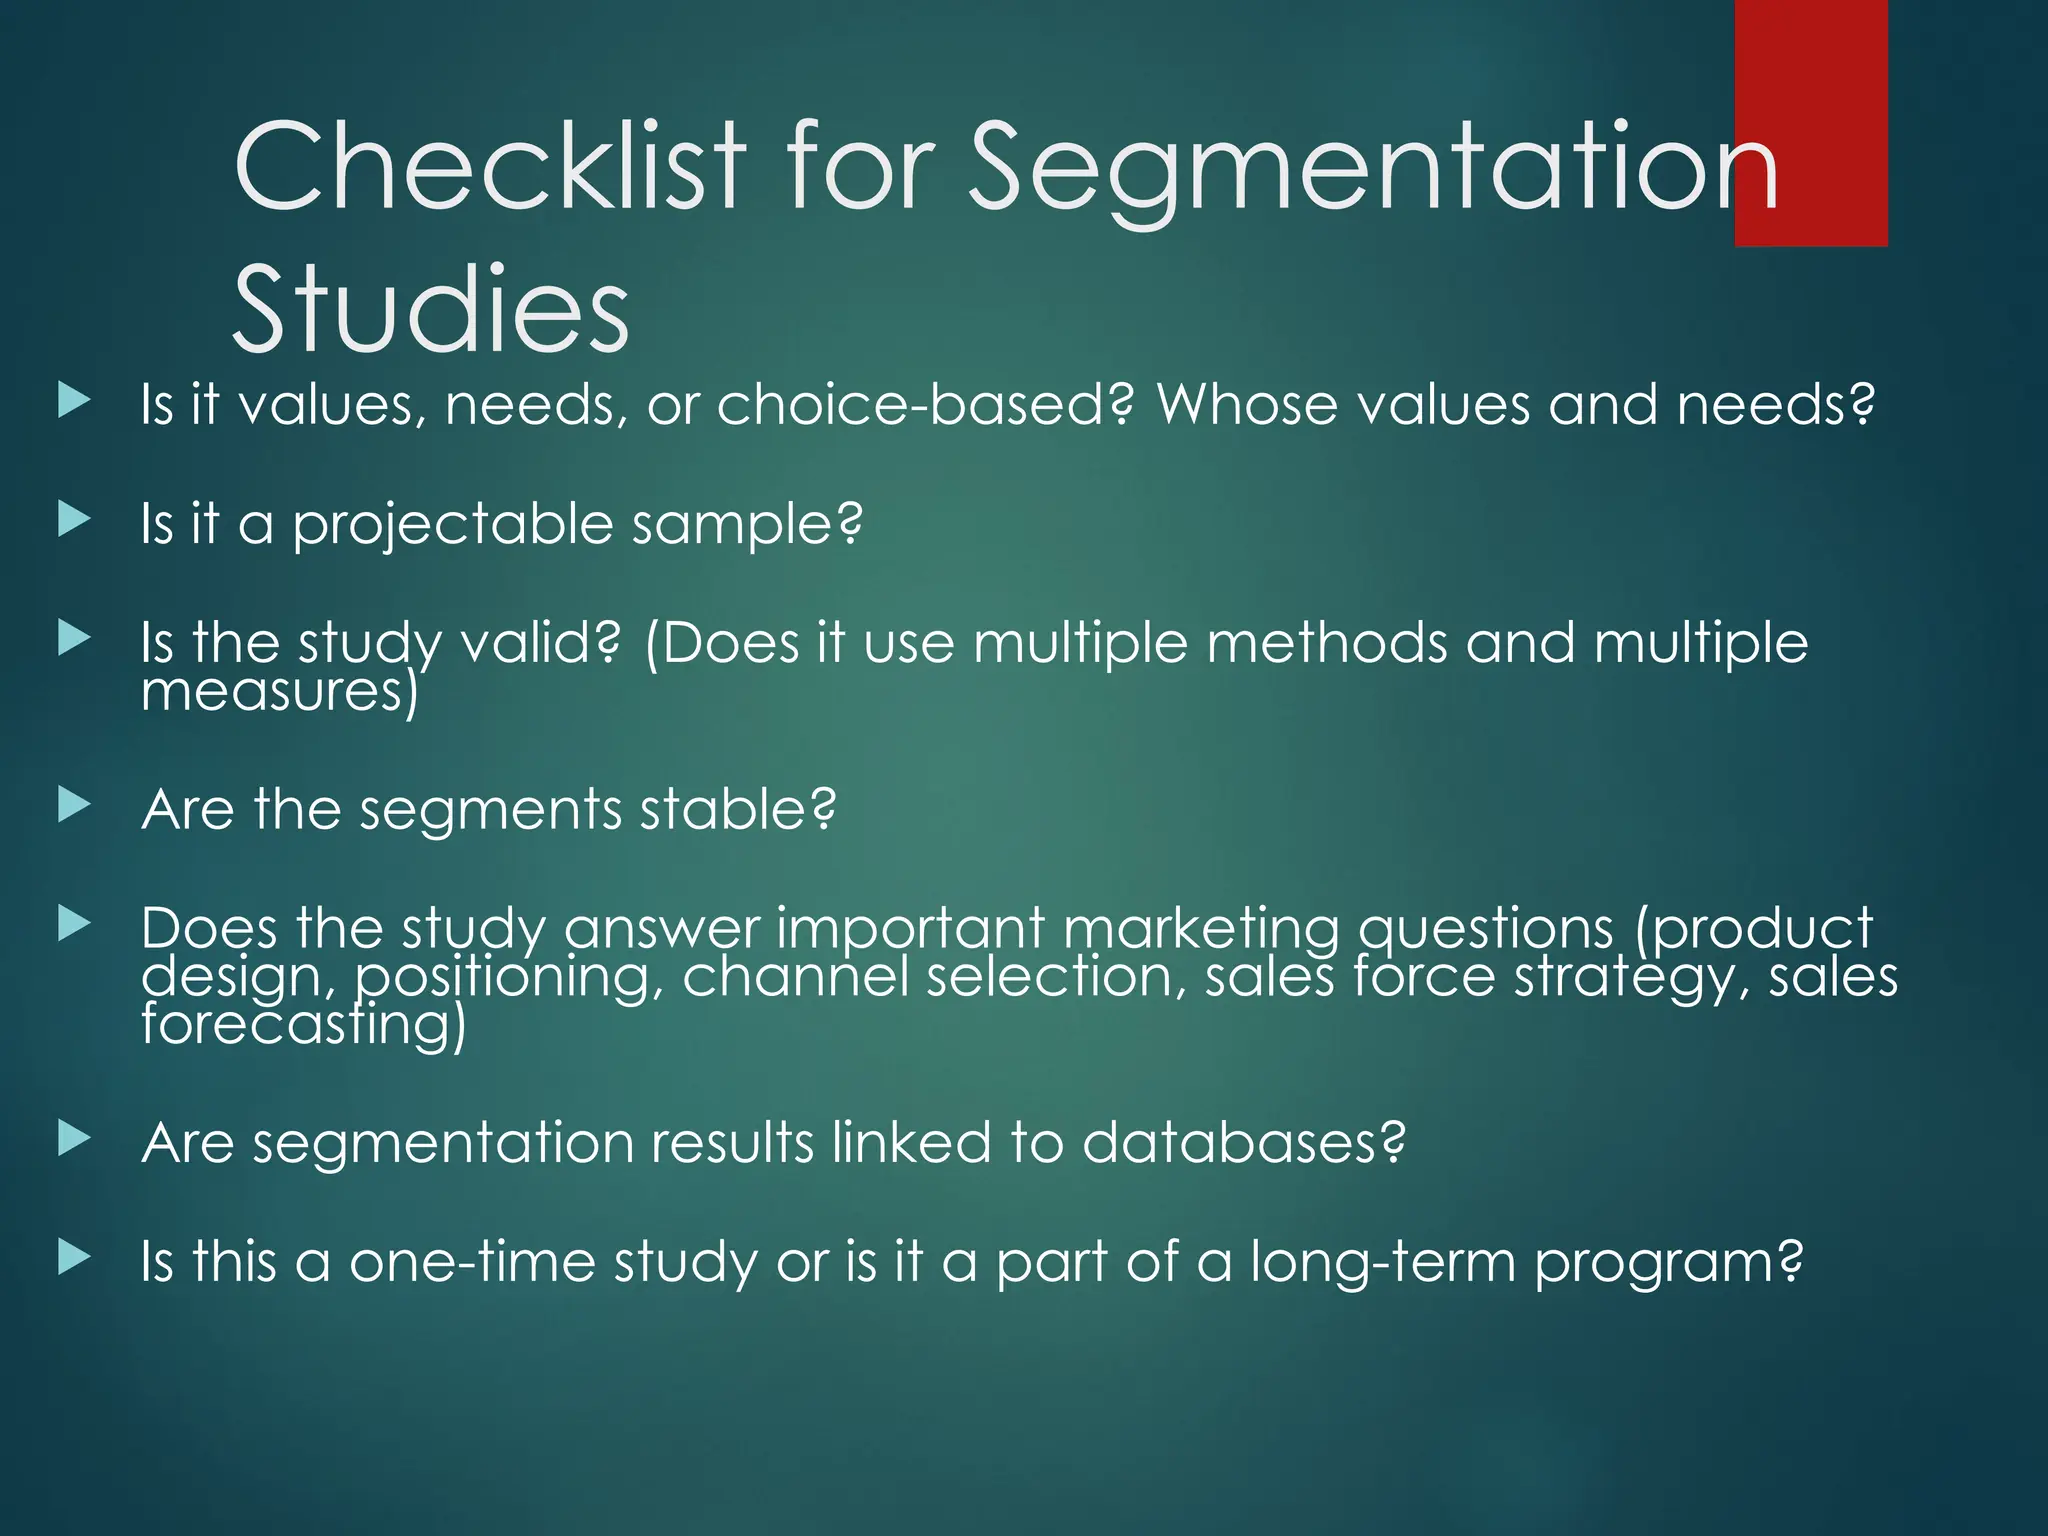
Checklist for Segmentation
Studies
Is it values, needs, or choice-based? Whose values and needs?
Is it a projectable sample?
Is the study valid? (Does it use multiple methods and multiple
measures)
Are the segments stable?
Does the study answer important marketing questions (product
design, positioning, channel selection, sales force strategy, sales
forecasting)
Are segmentation results linked to databases?
Is this a one-time study or is it a part of a long-term program?
77.
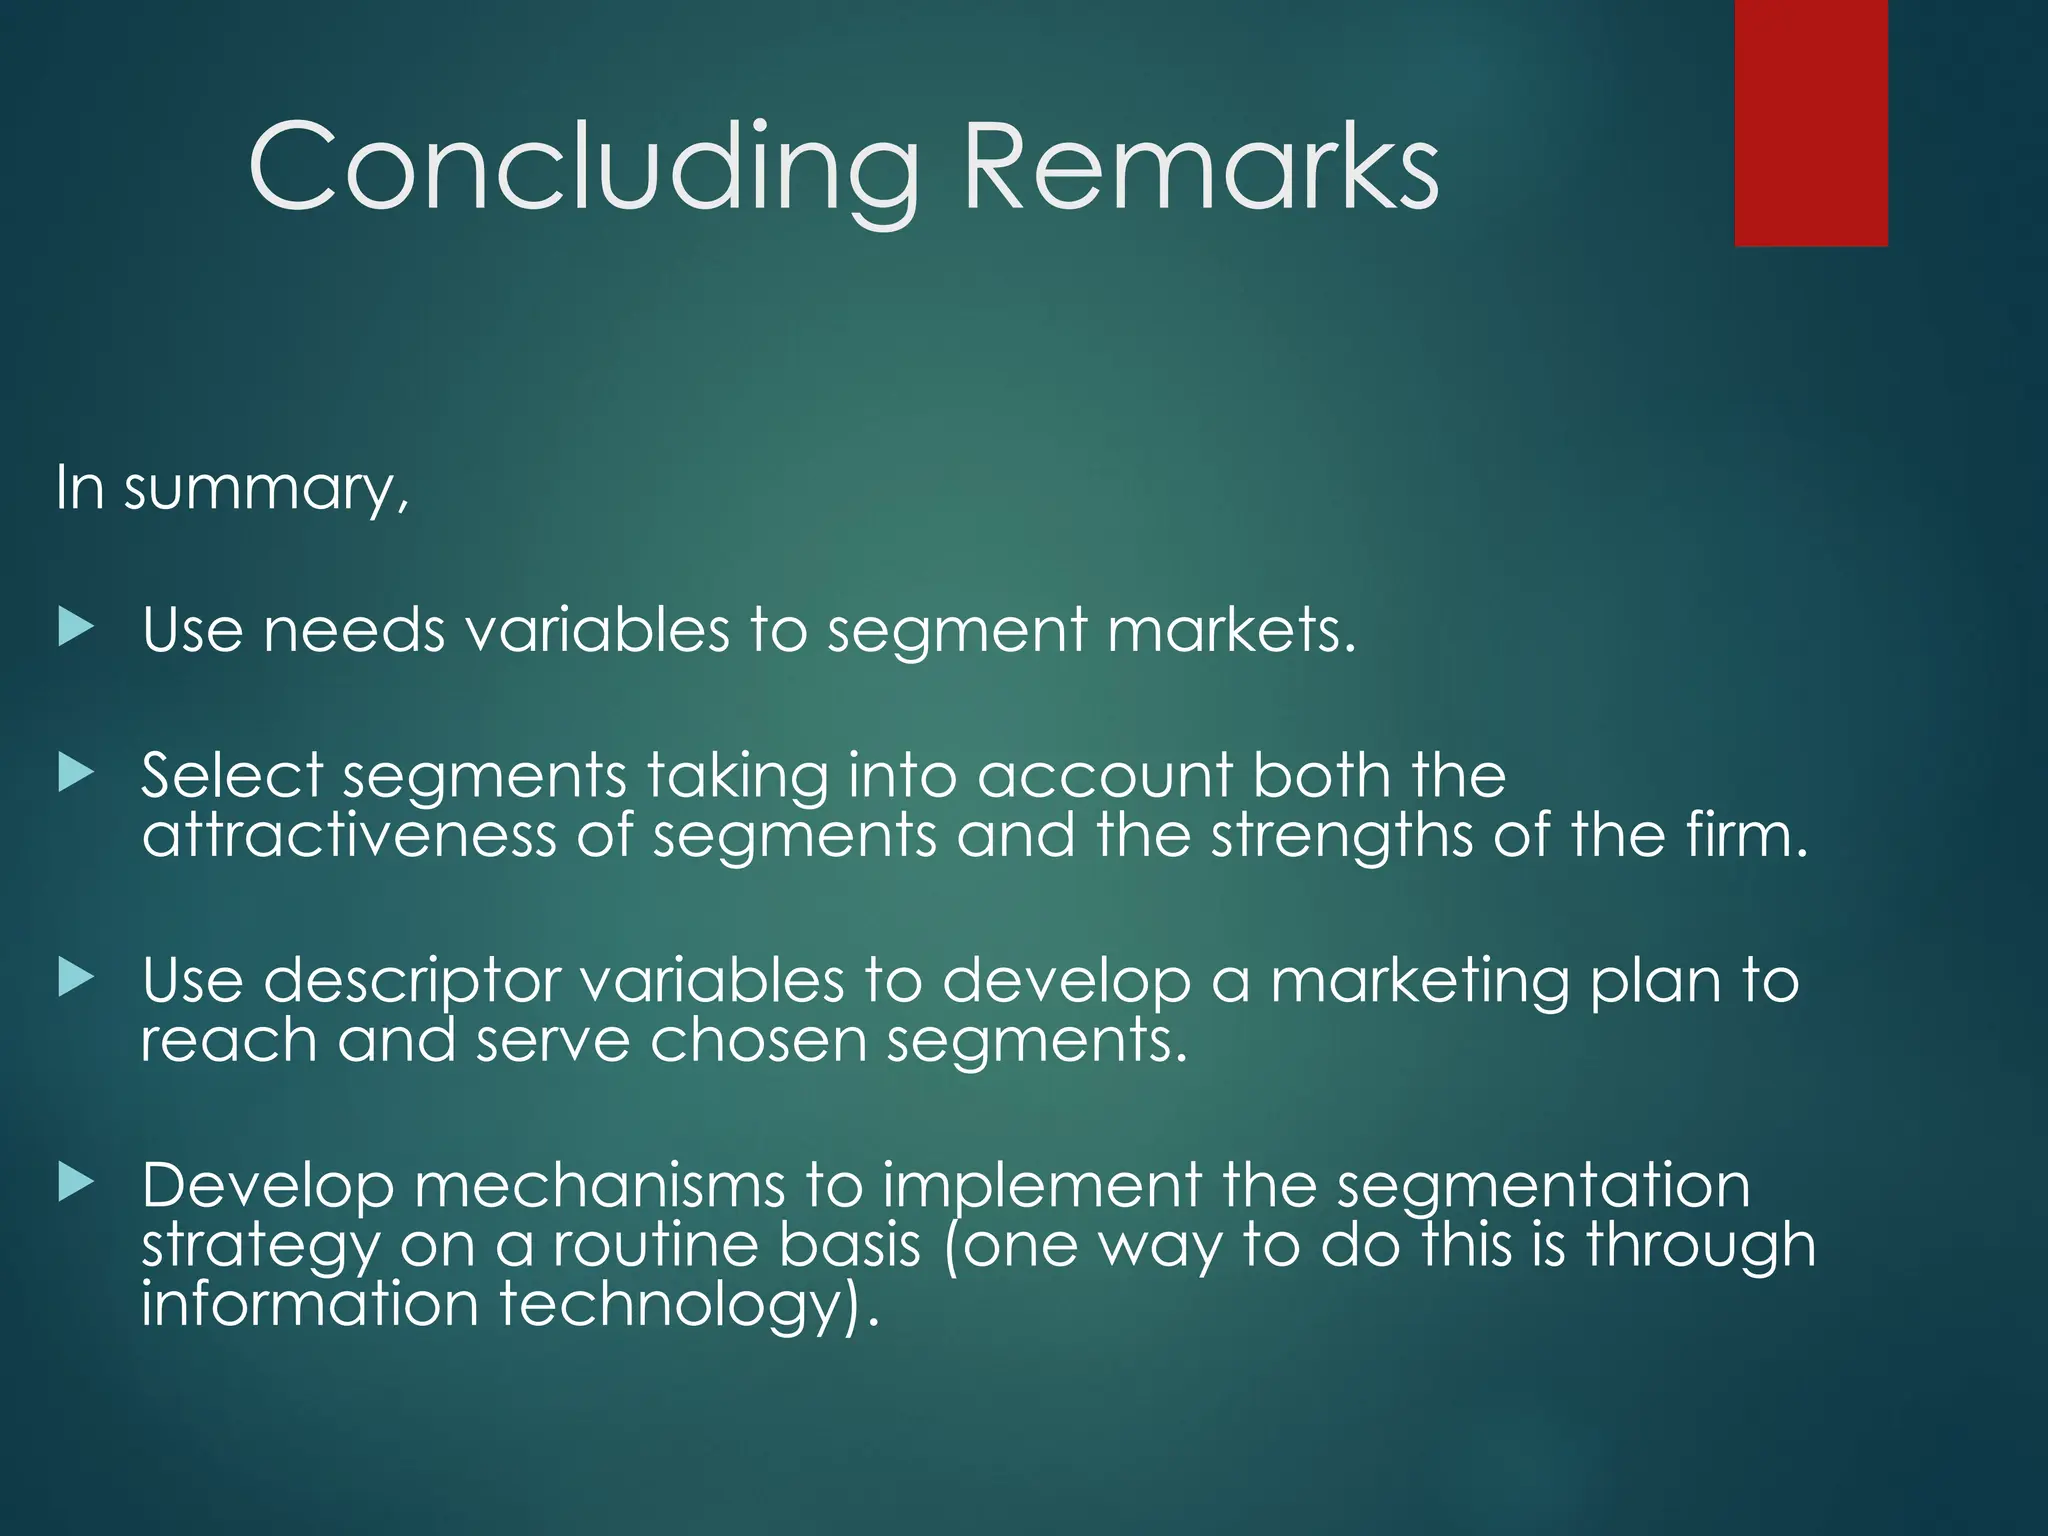
Concluding Remarks
In summary,
Use needs variables to segment markets.
Select segments taking into account both the
attractiveness of segments and the strengths of the firm.
Use descriptor variables to develop a marketing plan to
reach and serve chosen segments.
Develop mechanisms to implement the segmentation
strategy on a routine basis (one way to do this is through
information technology).

![Segmentation in Action
We segment our customers by letter volume, by
postage volume, by the type of equipment they use.
Then we segment on whether they buy or lease
equipment.
Based on this knowledge, we target our marketing
messages, fine tune our sales tactics, learn which
benefits appeal to which customers and zero in on key
decision makers at a company.
—Kathleen Synnot, VP, Worldwide Marketing
Mailing Systems Division, Pitney Bowes, Inc.
[quoted in Marketing Masters (Walden and Lawler)]](https://image.slidesharecdn.com/manojfinalppt-250303054704-792ad728/75/MANOJ-FINAL-PPT-welingkar-institution-of-mumbai-9-2048.jpg)
![A Note on Positioning
Positioning involves designing an offering so that the target
segment members perceive it in a distinct and valued way
relative to competitors.
Three ways to position an offering:
1. Unique (“Only product/service with XXX”)
2. Difference (“More than twice the [feature] vs.
[competitor]”)
3. Similarities (“Same functionality as
[competitor];
lower price”)
What are you telling your targeted segments?](https://image.slidesharecdn.com/manojfinalppt-250303054704-792ad728/75/MANOJ-FINAL-PPT-welingkar-institution-of-mumbai-16-2048.jpg)


![Consumer[1]](https://cdn.slidesharecdn.com/ss_thumbnails/consumer1-140109054507-phpapp01-thumbnail.jpg?width=640&height=640&fit=bounds)


