SlideShare a Scribd company logo
1 of 1
Making Sense of It: Parents at Risk for Complicated Grief
Nancy Bergquist-Trexler, Malauna Hudson, Emma Schmidt, Gretchen Stenger, & John Williams. Supervised by Dr. Catherine Daus.
Southern Illinois University Edwardsville
Abstract
The purpose of this study was to investigate levels of grief in parents who have lost a child. Variables examined included social support, anticipated or unanticipated cause of death, time since loss, and sense-making. 443 parents took a survey via social media or online support groups, and results were supportive of hypotheses.
Introduction
Grief is a universal emotion that almost everyone experiences following the
loss of someone (Averill, 1968). Losing a child can have an enormous effect
on parents and lead to severe problems, such as grief, or even worse,
complicated grief (CG). Researchers have clarified complicated grief (CG)
as unresolved and prolonged (Zisook & Shear, 2009). It is estimated that
10% of people grieving may suffer from complicated grief with higher rates
for losses due to disasters, violent or traumatic deaths, and among parents
(Shear et al., 2011).
Acute grief goes through a natural process of healing, while CG impedes
healing and can lead to prolonged and intensified acute grief (Shear et al.,
2011). CG can lead to significant distress; can be associated with
maladaptive behaviors, rumination about the circumstances of the death, and
a prolonged sense of shock and disbelief about the death. CG may also
produce feelings of alienation. Those experiencing CG may excessively try
to feel closer to the deceased to the point of suicidal ideation (Shear et al.,
2011).
Keesee, Currier, and Neimeyer (2008) found on average, that parents’ levels
of grief were equal to or greater than the cutoffs established for CG. They
also found that being a mother, a violent context of death, a shorter length of
time post-loss, and no or few living children were risk factors for predicting
CG. Parents also must attempt to align their pre-loss ideas about what it
means to be a parent with their post-loss reality; this re-alignment is referred
to as sense-making (Keesee, Currier, & Neimeyer, 2008).
Sense-making is a key factor of CG. A study done by Currier, Holland and
Neimeyer (2006) examined the concept of sense-making as a mechanism for
the association between violent loss and complications of grieving. Sense-
making, broadly, is how well the loss fits into the survivors’ existing
worldviews. The study also showed that having some type of support group
can help.
After losing someone, it is imperative that support, either peer or
professional, is given. Immediate and long-term support has helped people
cope with death. Self-help groups have been favored by mothers. Support
that fits the need of the complicated griever, that is both immediate and
long-term, is vital for their well-being (Nikkola, Kaunonen, & Aho, 2013).
Academic literature suggests further study of bereaved parents, their amount
of social support, and levels of grief and complicated grief due to the loss of
a child. The literature suggests that treatments for current diagnoses alone
are insufficient for the treatment of intense, persistent grieving reactions.
This study aims to add to the literature with hopes of expanding knowledge
on the topic of complicated grief and to help identify if there is a grieving
process that meets criteria for clinical evaluation and intervention. Society
in general might not know how to approach these parents, with the end result
of the parents often feeling alienated. This study attempts to reach out to
these parents in an attempt to let their voices be heard. Based on prior
research, we have developed three hypotheses.
Hypothesis 1: Risk factors associated with higher intensity of complicated
grief are: (a) being a mother; (b) unanticipated death; (c) shorter length of
time since loss; (d) no surviving children.
Hypothesis 2: Higher levels of sense-making will correlate negatively with
levels of complicated grief symptomology.
Hypothesis 3: Social support post-loss will correlate negatively with
intensity of complicated grief.
Results
Table 2
Descriptive and correlations of research variables (N = 443)
*p < .05 (1-tailed)
**p < .01 (1-tailed)
Note: aAge range was 19-76. b Gender was coded “1” male, or “2” female,. cRelationship to deceased child was coded “1” mother or “2” father. dAn initial ten causes of death were
categorized into unanticipated “1”, or anticipated death “2”. ecoded with “1” yes or “2” no. fcoded “1” less than six months, “2” six months to 1 year, “3” more than one year, “4” more than
two years, “5” more than three years, “6” more than four years, “7” more than five years, “8” more than six years, and “9” more than 7 years. gcoded “1” yes or “2” no. hability to make any
sense of the loss of the child was rated on a scale of “1” no sense to “5” a great deal of sense. IThe Multidimensional Scale of Perceived Social Support was measured with a “1” very strongly
disagree to “7” very strongly agree. Higher scores indicate the perception of more social support. jFive questions were asked regarding social support specific to the loss of the child and were
rated from a “1” very strongly disagree to “6” very strongly agree. Lower scores indicate more social support. kThe Inventory of Complicated Grief (ICG) was totaled for each participant to
measure intensity of grief. Clinical cut off score for complicated grief is 44. The parentheses indicate the coefficient alphas for each variable.
Table 2 represents the correlations and descriptive statistics that were run between
variables. There was a moderately negative correlation between total score on the
ICG and time since the loss of the child, r(437) = -.41, p < .01, thus supporting
hypothesis one part c. Higher levels of sense-making correlated negatively with
levels of grief, r(433) = -.60, p < .01, which supports hypothesis two of the study.
MSPSS had a negative relationship to ICG, r(437) = -.30, p < .01, higher scores
meant more social support, thus supporting hypothesis three. SS2 had a positive
relationship to ICG, r(437) = .48, p < .01, lower scores meant more social support,
thus supporting hypothesis three.
A series of independent t-tests were performed to analyze the relationship between
independent variables and the total scores of the ICG. The relationship to the child
and the total levels of ICG show that there was a statistically significant difference,
t(437) = 2.67, p < .01, with mothers (M = 57.41, SD = 13.61) having higher ICG
levels, thus supporting hypothesis one part a. There was no statistically significant
difference between parents who attended grief supports groups (M = 57.58, SD =
12.76), to parents who did not (M = 54.75, SD = 15.94), t (342) = 1.82, p = .07,
although it was approaching significance. Those who had surviving children (M =
54.94, SD = 13.78) had a statistically lower level of ICG than those with no
surviving children (M = 61.91, SD = 11.63); t(437) = -5.02, p < .01, thus supporting
hypothesis one part d. There was no significant difference of CG between
unanticipated death (M = 56.92, SD = 13.60) or anticipated death (M = 57.02, SD =
13.12), and total ICG: t(420) = -.05, p = .96, which does not support hypothesis one
part b.
Table 3 gives the specific breakdown of the mean ICG scores by ten causes of
death.
We also analyzed the self-report sense-making qualitative question. Of the 443
participants, 238 responded to this question (53.92%). Responses were categorized
into four general themes/categories which were: (1) No sense, negative attitude,
bitter, guilt (36.03%), “No. There is no logical or medical reason why my son is
gone”; (2) religious or spiritual meaning (positive or negative) (21.86%), “My
religious beliefs have helped me make sense of my son’s death”; (3) helping others,
positive attitude (10.12%), “In memory of our son, we have given numerous
scholarships in his name. We have shared our experience with his death with
fellow parents experiencing the same thing”; (4) understanding and knowing what
happened, having other children, being part of support group (31.98%), “I am part
of a couple support groups on Facebook. Hearing other stories of parents losing
their babies lets me know that I am not alone.”
Variable M SD 1 2 3 4 5 6 7 8 9 10 11
1. Agea 51.07 12.87 ---
2. Gender of parentb --- --- -.15** ---
3. Relationshipc --- --- .13** -.96** ---
4. Unanticipated
Anticipatedd
--- --- .04 .03 .02 ---
5. Surviving Childrene --- --- -.04 .07 -.04 .05 ---
6. Time Post Lossf 5.57 2.97 .38** -.08* .05 .01 -.18** ---
7. Participate Sup Grpg 1.22 .42 .17** -.02 .03 .05 .04 .10* ---
8. Sense Makingh 2.45 1.36 .04 -.07 .07 .04 .10* .30** -.06 ---
9. MSPSSi 57.36 16.39 -.12** -.03 .04 .04 -.13** .00 .05 .24 (.94)
10. SS2j 26.94 4.48 -.14** .03 -.02 .02 .07 -.09* .14** -.05 .15** (.71)
11. Total ICGk 56.96 13.56 -.14** .14** -.13** .01 .23** -.41** .05 -.59** -.30** .48** (.91)
Context of Child’s Death Mean of ICG N
Homicide 61.18 60
SIDS 60.55 9
Suicide 60.02 30
Other 57.88 16
Drug Overdose 57.77 26
Fatal Accident (e.g., Motor Vehicle
Accident)
57.14 137
Natural Anticipated (e.g., Cancer, illness) 57.02 44
Stillbirth (20 weeks or greater) 56.00 36
Natural Sudden (e.g., Heart Attack) 55.15 54
Miscarriage (less than 20 weeks) 45.48 27
Discussion
Our study received tremendous support from parents who have lost a
child. Most of the responses, 90.97%, came from what is termed chain
referral (Penrod, Preston, Cain, & Starks, 2003). Chain referral is a way to
reach hard-to-reach samples. The researchers posted a link to the survey on
social media sites and requested the link to be shared. The responses
reached over 500 in only six days. The total responses used, 443, were at
least 95% complete. The rapid response rate indicated that parents wanted
their voices and their child’s story to be heard. This was demonstrated
through a participant response, “...Thank you for bringing to light to such a
dark subject. It is so much more painful because we are so
misunderstood…”
This study suggests that risk factors associated with a higher intensity of
grief for parents are being a mother, a shorter length of time since the death,
and having no other children. This study also suggests that being able to
make some sense of the death is associated with lower levels of grief
intensity, which is difficult to do. Of the participants in this study 35.44%
reported not being able to make any sense of it, while only 9.93% were able
to make a great deal of sense of the death. According to this study, social
support after the loss of a child is also associated with lower levels of grief
intensity. One of the variables that this study also looked as was the
intensity of grief for an unanticipated death versus an anticipated death, such
as from cancer or an illness; which were not significantly different from
each other, regarding experienced levels of grief.
Out of 443 responses, only 28 participants were male. This may reflect
cultural norms on how males and females experience and express emotion
differently regarding the loss of a child (Keesee, et al., 2008). Dryregov and
colleagues (2003, p. 160) suggest that “fathers may postpone their
grief…and may be at risk for prolonged grieving.” Future studies may want
to consider how to reach bereaved fathers.
This study was different in that it recruited not only biological parents, but
step and adoptive parents. This study was also unique in that we did not
look for specific time frames post loss; it was open to any time post loss.
Since time post loss has been shown to be a factor in the intensity of grief
(Keesee et. al., 2008), this study attempted to allow all time frames post-
loss. Cause of death was explored, but not limited as in other studies of this
type. Many studies of this nature attempt to address only certain types of
death, such as suicide, SIDS, and accidents (Dryregov, et al., 2003).
A major finding was that 83.6% of participants scored at or above the cut off
of 44 on the ICG. Prigerson et al., (1995) indicate that participants with a
score above are significantly distressed and have impaired functions in their
social life, their mental health, and even in their physical health. This has
important implications for clinicians, family, and friends to have knowledge
that the bereaved parent is suffering longer and more intensely.
A limitation to this study was that we did not consider bereaved parents who
have lost more than one child. “Bereavement overload” is a phenomenon
where an individual experiences multiple losses (Neimeyer & Holland,
2006). Some participants indicated that they completed the survey more
than one time for different children, and some participants attempted to
respond for more than one child in one survey link.
The open-ended sense-making question was categorized into four different
themes. There were some responses that did not seem to fit in any of the
four categories, and there were some that clearly fit into more than one
category. There were also some responses that indicated this question was
insensitive. Some responses clearly indicated they were not sure what was
meant by sense-making, “Not sure what you are asking. There is no sense to
a person dying so young.” Participants also took an opportunity with this
response to inform the researchers that there were some confusing parts of
the survey, “I found the instructions for the survey confusing at times.”
Methods
Participants
Participants (N = 443) were recruited in one of two ways: (a) direct advertising to
The Compassionate Friends (a grief support group) via contact with leaders or
through their website; (b) chain referral (Penrod, Preston, Cain, & Starks, 2003);
through family, friends, church groups, and social media. Inclusion criteria
stipulated that all of the participants had to be at least 18 years of age and had lost a
child. Table 1 represents demographics for the participants.
Table 1
Demographics and sample characteristics
Measures
Multidimensional Scale of Perceived Social Support (MSPSS). MSPSS measures
the social support from family, friends, or a significant other. This has 12 items on
a seven-point scale ranging from very strongly disagree (1) to very strongly agree
(7) (e.g., there is a special person who is around when I am in need;” and “I can
talk about my problems with my family.”) The original Cronbach’s coefficient
alpha was .88 showing good reliability (Zimet, Dahlem, Zimet, & Farley, 1988).
Our coefficient alpha was .94.
Social Support 2 (SS2). Dryrego, Nordanger and Dryrego (2003) developed
statements specifically to measure professional and social network assistance as
well as to measure changes in social interaction post-loss. This measure includes
seven items such as “I have experienced that other people feel sorry for the family,”
and “I have isolated myself from myself from other people” which were rated on a
six-point Likert scale ranging from very strongly disagree (1), very strongly agree
(6). Cronbach’s alpha for this study was .711.
Inventory of Complicated Grief (ICG). The ICG was developed specifically to
assess maladaptive reactions to bereavement (Prigerson et al., 1995). The ICG used
in the present study includes 19 declarative statements, such as ‘‘I can’t help feeling
angry about his/her death;’’ ‘‘Ever since s/he died I feel like I have lost the ability
to care about other people;’’ and ‘‘I hear the voice of the person who died speak to
me,’’ to which responses are made on a five-point Likert scale describing the
frequency of symptoms (from 1, never, to 5, always). Scores can range from 19 to
95, with a clinical cutoff of 442 (Prigerson et al., 1995).
Sense-making. Sense-making was assessed by two questions, one qualitative and
the other quantitative. First, participants rated the amount of sense-making of the
loss experience on a five-point Likert scale, with anchor points of 1 (I have been
able to make no sense of my loss), to 5 (I have made a great deal of sense of my
loss). Then participants responded to an open-ended question in writing: ‘‘Have
there been any ways in which you have been able to make sense of the loss of your
child? If so, please, in a brief paragraph, describe that experience.’’ This method
corresponds to the manner in which Keesee, Currier, and Neimeyer (2008)
measured sense-making.
Procedure
Each eligible participant completed a questionnaire that elicited demographic
information and circumstances surrounding the loss. Order of the questionnaires
was MSPSS, social support questions, ICG, and sense-making. The data were
collected electronically via a Qualtrics survey link.1Coefficient alpha was determined after eliminating two unreliable items: “I have experienced that other people feel sorry for the family” and “I have gotten closer to other people.”
2This study’s Likert-scale for the ICG was 1-5 which is different than the original ICG (0-4), therefore this study’s cut-off score (44) is different than the original ICG (25).
Age, years ± SD 51.07 ± 12.86 Cause of death, N (%)
Gender, N (%) Fatal Accident (Eg., motor vehicle accident) 137 (30.93%)
Male 26 (5.9%) Natural Sudden (Eg., Heart Attack) 54 (12.19%)
Female 415 (93.7%) Natural Anticipated (Eg., cancer, illness) 44 (9.93%)
Describe 2 (0.5%) Suicide 30 (6.77%)
Ethnicity, N (%) Homicide 60 (13.54%)
Caucasian 390 (88%) SIDS 9 (2.03%)
African American/Black 17 (3.8%) Stillbirth (20 weeks or greater) 37 (8.35%)
Hispanic/Latino 13 (2.9%) Miscarriage (less than 20 weeks) 30 (6.77%)
Native American/Native Alaskan 6(1.4%) Drug Overdose 26 (5.87%)
Pacific Islander 4 (0.9&) If none above, please describe 16 (3.61%)
Asian 1 (.2%) Grouping into unanticipated and anticipated, N (%)
Other 12 (2.7%) unanticipated 382 (86.23%)
Relationship to child, N (%) anticipated 44 (9.93%)
Mother 415 (93.68%) could not group 17 (3.84%)
Father 28 (6.32%) Time since death, N (%)
Do you have surviving children, N (%) Less than 6 months 38 (8.58%)
Yes 315 (71.1%) 6 months to 1 year 54 (12.19%)
No 128 (28.9%) More than 1 year 58 (13.09%)
Participated in a grief support group, N (%) More than 2 years 44 (9.93%)
Yes 344 (77.65%) More than 3 years 33 (7.45%)
No 99 (9.93%) More than 4 years 22 (4.97%)
More than 5 years 25 (5.64%)
More than 6 years 22 (4.97%)
More than 7 years 147 (33.18%)

More Related Content

What's hot

REU poster- Raisa- 5.4.15_with Tables
REU poster- Raisa- 5.4.15_with TablesREU poster- Raisa- 5.4.15_with Tables
REU poster- Raisa- 5.4.15_with TablesRaisa Hasan
 
The Maltreatment and Adolescent Pathways (MAP) Research Study
The Maltreatment and Adolescent Pathways (MAP) Research StudyThe Maltreatment and Adolescent Pathways (MAP) Research Study
The Maltreatment and Adolescent Pathways (MAP) Research StudyChristine Wekerle
 
Hlm Presentation
Hlm PresentationHlm Presentation
Hlm Presentationbwetzell
 
Distress and retaliatory aggression in response to witnessing intergroup excl...
Distress and retaliatory aggression in response to witnessing intergroup excl...Distress and retaliatory aggression in response to witnessing intergroup excl...
Distress and retaliatory aggression in response to witnessing intergroup excl...Maciej Behnke
 
Sensory Enrichment Therapy Second RCT Design Study
Sensory Enrichment Therapy Second RCT Design StudySensory Enrichment Therapy Second RCT Design Study
Sensory Enrichment Therapy Second RCT Design StudyGreg Wootton, MOTR/L
 
Resiliency Program R. Davis U10A1
Resiliency Program R. Davis U10A1Resiliency Program R. Davis U10A1
Resiliency Program R. Davis U10A1Rachel Davis
 

What's hot (10)

REU poster- Raisa- 5.4.15_with Tables
REU poster- Raisa- 5.4.15_with TablesREU poster- Raisa- 5.4.15_with Tables
REU poster- Raisa- 5.4.15_with Tables
 
Games For Health 050908final
Games For Health 050908finalGames For Health 050908final
Games For Health 050908final
 
Research Presentation
Research PresentationResearch Presentation
Research Presentation
 
Wii Habilitation Scientific Poster Final
Wii Habilitation Scientific Poster FinalWii Habilitation Scientific Poster Final
Wii Habilitation Scientific Poster Final
 
The Maltreatment and Adolescent Pathways (MAP) Research Study
The Maltreatment and Adolescent Pathways (MAP) Research StudyThe Maltreatment and Adolescent Pathways (MAP) Research Study
The Maltreatment and Adolescent Pathways (MAP) Research Study
 
Hlm Presentation
Hlm PresentationHlm Presentation
Hlm Presentation
 
Distress and retaliatory aggression in response to witnessing intergroup excl...
Distress and retaliatory aggression in response to witnessing intergroup excl...Distress and retaliatory aggression in response to witnessing intergroup excl...
Distress and retaliatory aggression in response to witnessing intergroup excl...
 
Sensory Enrichment Therapy Second RCT Design Study
Sensory Enrichment Therapy Second RCT Design StudySensory Enrichment Therapy Second RCT Design Study
Sensory Enrichment Therapy Second RCT Design Study
 
Faces Lab Report
Faces Lab ReportFaces Lab Report
Faces Lab Report
 
Resiliency Program R. Davis U10A1
Resiliency Program R. Davis U10A1Resiliency Program R. Davis U10A1
Resiliency Program R. Davis U10A1
 

Similar to Making Sense of It Poster for MPA May 2016

Apa sample paper experiment paper assignment help
Apa sample paper experiment paper assignment helpApa sample paper experiment paper assignment help
Apa sample paper experiment paper assignment helpSample Assignment
 
APA Corrected Sample Papers -by APA.org
APA Corrected Sample Papers -by APA.orgAPA Corrected Sample Papers -by APA.org
APA Corrected Sample Papers -by APA.orgJonathan Underwood
 
The Experiences of Adults Exposed toIntimate Partner Violenc.docx
The Experiences of Adults Exposed toIntimate Partner Violenc.docxThe Experiences of Adults Exposed toIntimate Partner Violenc.docx
The Experiences of Adults Exposed toIntimate Partner Violenc.docxcherry686017
 
Expressed Emotion
Expressed EmotionExpressed Emotion
Expressed Emotiongueste519b8
 
Running head EFFECTS OF AGE ON DETECTION OF EMOTION 1Effe.docx
Running head EFFECTS OF AGE ON DETECTION OF EMOTION 1Effe.docxRunning head EFFECTS OF AGE ON DETECTION OF EMOTION 1Effe.docx
Running head EFFECTS OF AGE ON DETECTION OF EMOTION 1Effe.docxtodd271
 
Addressing parental bereavement support needs at the end of life for infants ...
Addressing parental bereavement support needs at the end of life for infants ...Addressing parental bereavement support needs at the end of life for infants ...
Addressing parental bereavement support needs at the end of life for infants ...Cláudia Farinha
 
Running head EFFECTS OF AGE ON DETECTION OF EMOTION 1Effe.docx
Running head EFFECTS OF AGE ON DETECTION OF EMOTION 1Effe.docxRunning head EFFECTS OF AGE ON DETECTION OF EMOTION 1Effe.docx
Running head EFFECTS OF AGE ON DETECTION OF EMOTION 1Effe.docxsusanschei
 
Resilience in the context of child maltreatment
Resilience in the context of child maltreatmentResilience in the context of child maltreatment
Resilience in the context of child maltreatmentChristine Wekerle
 
Facebook Talk on Empathy and Technology
Facebook Talk on Empathy and TechnologyFacebook Talk on Empathy and Technology
Facebook Talk on Empathy and TechnologyChristine Rosakranse
 
The beautiful mind.pdf
The beautiful mind.pdfThe beautiful mind.pdf
The beautiful mind.pdfdrnikahmad
 
Mental Illness Stigma and the Fundamental Components ofSuppo.docx
Mental Illness Stigma and the Fundamental Components ofSuppo.docxMental Illness Stigma and the Fundamental Components ofSuppo.docx
Mental Illness Stigma and the Fundamental Components ofSuppo.docxandreecapon
 
Ross Shegog - The Secret of Seven Stones: A Game to Impact Youth Skills and P...
Ross Shegog - The Secret of Seven Stones: A Game to Impact Youth Skills and P...Ross Shegog - The Secret of Seven Stones: A Game to Impact Youth Skills and P...
Ross Shegog - The Secret of Seven Stones: A Game to Impact Youth Skills and P...SeriousGamesAssoc
 
Parenting Practices among DepressedMothers in the Child Welf.docx
Parenting Practices among DepressedMothers in the Child Welf.docxParenting Practices among DepressedMothers in the Child Welf.docx
Parenting Practices among DepressedMothers in the Child Welf.docxkarlhennesey
 
Parenting Practices among DepressedMothers in the Child Welf.docx
Parenting Practices among DepressedMothers in the Child Welf.docxParenting Practices among DepressedMothers in the Child Welf.docx
Parenting Practices among DepressedMothers in the Child Welf.docxhoney690131
 
Emotional strategies for coping with bereavement of parent by teenagers in nn...
Emotional strategies for coping with bereavement of parent by teenagers in nn...Emotional strategies for coping with bereavement of parent by teenagers in nn...
Emotional strategies for coping with bereavement of parent by teenagers in nn...Alexander Decker
 

Similar to Making Sense of It Poster for MPA May 2016 (20)

Tech N 10
Tech N 10Tech N 10
Tech N 10
 
Apa sample paper experiment paper assignment help
Apa sample paper experiment paper assignment helpApa sample paper experiment paper assignment help
Apa sample paper experiment paper assignment help
 
APA Corrected Sample Papers -by APA.org
APA Corrected Sample Papers -by APA.orgAPA Corrected Sample Papers -by APA.org
APA Corrected Sample Papers -by APA.org
 
The Experiences of Adults Exposed toIntimate Partner Violenc.docx
The Experiences of Adults Exposed toIntimate Partner Violenc.docxThe Experiences of Adults Exposed toIntimate Partner Violenc.docx
The Experiences of Adults Exposed toIntimate Partner Violenc.docx
 
Expressed Emotion
Expressed EmotionExpressed Emotion
Expressed Emotion
 
Running head EFFECTS OF AGE ON DETECTION OF EMOTION 1Effe.docx
Running head EFFECTS OF AGE ON DETECTION OF EMOTION 1Effe.docxRunning head EFFECTS OF AGE ON DETECTION OF EMOTION 1Effe.docx
Running head EFFECTS OF AGE ON DETECTION OF EMOTION 1Effe.docx
 
Psihologija
PsihologijaPsihologija
Psihologija
 
Psihologija
PsihologijaPsihologija
Psihologija
 
Addressing parental bereavement support needs at the end of life for infants ...
Addressing parental bereavement support needs at the end of life for infants ...Addressing parental bereavement support needs at the end of life for infants ...
Addressing parental bereavement support needs at the end of life for infants ...
 
Running head EFFECTS OF AGE ON DETECTION OF EMOTION 1Effe.docx
Running head EFFECTS OF AGE ON DETECTION OF EMOTION 1Effe.docxRunning head EFFECTS OF AGE ON DETECTION OF EMOTION 1Effe.docx
Running head EFFECTS OF AGE ON DETECTION OF EMOTION 1Effe.docx
 
Resilience in the context of child maltreatment
Resilience in the context of child maltreatmentResilience in the context of child maltreatment
Resilience in the context of child maltreatment
 
Klein
KleinKlein
Klein
 
Facebook Talk on Empathy and Technology
Facebook Talk on Empathy and TechnologyFacebook Talk on Empathy and Technology
Facebook Talk on Empathy and Technology
 
The beautiful mind.pdf
The beautiful mind.pdfThe beautiful mind.pdf
The beautiful mind.pdf
 
Mental Illness Stigma and the Fundamental Components ofSuppo.docx
Mental Illness Stigma and the Fundamental Components ofSuppo.docxMental Illness Stigma and the Fundamental Components ofSuppo.docx
Mental Illness Stigma and the Fundamental Components ofSuppo.docx
 
Ross Shegog - The Secret of Seven Stones: A Game to Impact Youth Skills and P...
Ross Shegog - The Secret of Seven Stones: A Game to Impact Youth Skills and P...Ross Shegog - The Secret of Seven Stones: A Game to Impact Youth Skills and P...
Ross Shegog - The Secret of Seven Stones: A Game to Impact Youth Skills and P...
 
PSI posterFinal
PSI posterFinalPSI posterFinal
PSI posterFinal
 
Parenting Practices among DepressedMothers in the Child Welf.docx
Parenting Practices among DepressedMothers in the Child Welf.docxParenting Practices among DepressedMothers in the Child Welf.docx
Parenting Practices among DepressedMothers in the Child Welf.docx
 
Parenting Practices among DepressedMothers in the Child Welf.docx
Parenting Practices among DepressedMothers in the Child Welf.docxParenting Practices among DepressedMothers in the Child Welf.docx
Parenting Practices among DepressedMothers in the Child Welf.docx
 
Emotional strategies for coping with bereavement of parent by teenagers in nn...
Emotional strategies for coping with bereavement of parent by teenagers in nn...Emotional strategies for coping with bereavement of parent by teenagers in nn...
Emotional strategies for coping with bereavement of parent by teenagers in nn...
 

Making Sense of It Poster for MPA May 2016

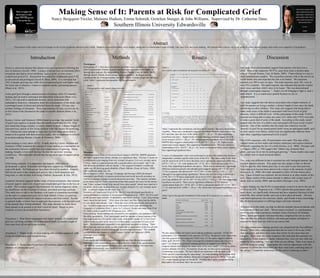
  • 1. Making Sense of It: Parents at Risk for Complicated Grief Nancy Bergquist-Trexler, Malauna Hudson, Emma Schmidt, Gretchen Stenger, & John Williams. Supervised by Dr. Catherine Daus. Southern Illinois University Edwardsville Abstract The purpose of this study was to investigate levels of grief in parents who have lost a child. Variables examined included social support, anticipated or unanticipated cause of death, time since loss, and sense-making. 443 parents took a survey via social media or online support groups, and results were supportive of hypotheses. Introduction Grief is a universal emotion that almost everyone experiences following the loss of someone (Averill, 1968). Losing a child can have an enormous effect on parents and lead to severe problems, such as grief, or even worse, complicated grief (CG). Researchers have clarified complicated grief (CG) as unresolved and prolonged (Zisook & Shear, 2009). It is estimated that 10% of people grieving may suffer from complicated grief with higher rates for losses due to disasters, violent or traumatic deaths, and among parents (Shear et al., 2011). Acute grief goes through a natural process of healing, while CG impedes healing and can lead to prolonged and intensified acute grief (Shear et al., 2011). CG can lead to significant distress; can be associated with maladaptive behaviors, rumination about the circumstances of the death, and a prolonged sense of shock and disbelief about the death. CG may also produce feelings of alienation. Those experiencing CG may excessively try to feel closer to the deceased to the point of suicidal ideation (Shear et al., 2011). Keesee, Currier, and Neimeyer (2008) found on average, that parents’ levels of grief were equal to or greater than the cutoffs established for CG. They also found that being a mother, a violent context of death, a shorter length of time post-loss, and no or few living children were risk factors for predicting CG. Parents also must attempt to align their pre-loss ideas about what it means to be a parent with their post-loss reality; this re-alignment is referred to as sense-making (Keesee, Currier, & Neimeyer, 2008). Sense-making is a key factor of CG. A study done by Currier, Holland and Neimeyer (2006) examined the concept of sense-making as a mechanism for the association between violent loss and complications of grieving. Sense- making, broadly, is how well the loss fits into the survivors’ existing worldviews. The study also showed that having some type of support group can help. After losing someone, it is imperative that support, either peer or professional, is given. Immediate and long-term support has helped people cope with death. Self-help groups have been favored by mothers. Support that fits the need of the complicated griever, that is both immediate and long-term, is vital for their well-being (Nikkola, Kaunonen, & Aho, 2013). Academic literature suggests further study of bereaved parents, their amount of social support, and levels of grief and complicated grief due to the loss of a child. The literature suggests that treatments for current diagnoses alone are insufficient for the treatment of intense, persistent grieving reactions. This study aims to add to the literature with hopes of expanding knowledge on the topic of complicated grief and to help identify if there is a grieving process that meets criteria for clinical evaluation and intervention. Society in general might not know how to approach these parents, with the end result of the parents often feeling alienated. This study attempts to reach out to these parents in an attempt to let their voices be heard. Based on prior research, we have developed three hypotheses. Hypothesis 1: Risk factors associated with higher intensity of complicated grief are: (a) being a mother; (b) unanticipated death; (c) shorter length of time since loss; (d) no surviving children. Hypothesis 2: Higher levels of sense-making will correlate negatively with levels of complicated grief symptomology. Hypothesis 3: Social support post-loss will correlate negatively with intensity of complicated grief. Results Table 2 Descriptive and correlations of research variables (N = 443) *p < .05 (1-tailed) **p < .01 (1-tailed) Note: aAge range was 19-76. b Gender was coded “1” male, or “2” female,. cRelationship to deceased child was coded “1” mother or “2” father. dAn initial ten causes of death were categorized into unanticipated “1”, or anticipated death “2”. ecoded with “1” yes or “2” no. fcoded “1” less than six months, “2” six months to 1 year, “3” more than one year, “4” more than two years, “5” more than three years, “6” more than four years, “7” more than five years, “8” more than six years, and “9” more than 7 years. gcoded “1” yes or “2” no. hability to make any sense of the loss of the child was rated on a scale of “1” no sense to “5” a great deal of sense. IThe Multidimensional Scale of Perceived Social Support was measured with a “1” very strongly disagree to “7” very strongly agree. Higher scores indicate the perception of more social support. jFive questions were asked regarding social support specific to the loss of the child and were rated from a “1” very strongly disagree to “6” very strongly agree. Lower scores indicate more social support. kThe Inventory of Complicated Grief (ICG) was totaled for each participant to measure intensity of grief. Clinical cut off score for complicated grief is 44. The parentheses indicate the coefficient alphas for each variable. Table 2 represents the correlations and descriptive statistics that were run between variables. There was a moderately negative correlation between total score on the ICG and time since the loss of the child, r(437) = -.41, p < .01, thus supporting hypothesis one part c. Higher levels of sense-making correlated negatively with levels of grief, r(433) = -.60, p < .01, which supports hypothesis two of the study. MSPSS had a negative relationship to ICG, r(437) = -.30, p < .01, higher scores meant more social support, thus supporting hypothesis three. SS2 had a positive relationship to ICG, r(437) = .48, p < .01, lower scores meant more social support, thus supporting hypothesis three. A series of independent t-tests were performed to analyze the relationship between independent variables and the total scores of the ICG. The relationship to the child and the total levels of ICG show that there was a statistically significant difference, t(437) = 2.67, p < .01, with mothers (M = 57.41, SD = 13.61) having higher ICG levels, thus supporting hypothesis one part a. There was no statistically significant difference between parents who attended grief supports groups (M = 57.58, SD = 12.76), to parents who did not (M = 54.75, SD = 15.94), t (342) = 1.82, p = .07, although it was approaching significance. Those who had surviving children (M = 54.94, SD = 13.78) had a statistically lower level of ICG than those with no surviving children (M = 61.91, SD = 11.63); t(437) = -5.02, p < .01, thus supporting hypothesis one part d. There was no significant difference of CG between unanticipated death (M = 56.92, SD = 13.60) or anticipated death (M = 57.02, SD = 13.12), and total ICG: t(420) = -.05, p = .96, which does not support hypothesis one part b. Table 3 gives the specific breakdown of the mean ICG scores by ten causes of death. We also analyzed the self-report sense-making qualitative question. Of the 443 participants, 238 responded to this question (53.92%). Responses were categorized into four general themes/categories which were: (1) No sense, negative attitude, bitter, guilt (36.03%), “No. There is no logical or medical reason why my son is gone”; (2) religious or spiritual meaning (positive or negative) (21.86%), “My religious beliefs have helped me make sense of my son’s death”; (3) helping others, positive attitude (10.12%), “In memory of our son, we have given numerous scholarships in his name. We have shared our experience with his death with fellow parents experiencing the same thing”; (4) understanding and knowing what happened, having other children, being part of support group (31.98%), “I am part of a couple support groups on Facebook. Hearing other stories of parents losing their babies lets me know that I am not alone.” Variable M SD 1 2 3 4 5 6 7 8 9 10 11 1. Agea 51.07 12.87 --- 2. Gender of parentb --- --- -.15** --- 3. Relationshipc --- --- .13** -.96** --- 4. Unanticipated Anticipatedd --- --- .04 .03 .02 --- 5. Surviving Childrene --- --- -.04 .07 -.04 .05 --- 6. Time Post Lossf 5.57 2.97 .38** -.08* .05 .01 -.18** --- 7. Participate Sup Grpg 1.22 .42 .17** -.02 .03 .05 .04 .10* --- 8. Sense Makingh 2.45 1.36 .04 -.07 .07 .04 .10* .30** -.06 --- 9. MSPSSi 57.36 16.39 -.12** -.03 .04 .04 -.13** .00 .05 .24 (.94) 10. SS2j 26.94 4.48 -.14** .03 -.02 .02 .07 -.09* .14** -.05 .15** (.71) 11. Total ICGk 56.96 13.56 -.14** .14** -.13** .01 .23** -.41** .05 -.59** -.30** .48** (.91) Context of Child’s Death Mean of ICG N Homicide 61.18 60 SIDS 60.55 9 Suicide 60.02 30 Other 57.88 16 Drug Overdose 57.77 26 Fatal Accident (e.g., Motor Vehicle Accident) 57.14 137 Natural Anticipated (e.g., Cancer, illness) 57.02 44 Stillbirth (20 weeks or greater) 56.00 36 Natural Sudden (e.g., Heart Attack) 55.15 54 Miscarriage (less than 20 weeks) 45.48 27 Discussion Our study received tremendous support from parents who have lost a child. Most of the responses, 90.97%, came from what is termed chain referral (Penrod, Preston, Cain, & Starks, 2003). Chain referral is a way to reach hard-to-reach samples. The researchers posted a link to the survey on social media sites and requested the link to be shared. The responses reached over 500 in only six days. The total responses used, 443, were at least 95% complete. The rapid response rate indicated that parents wanted their voices and their child’s story to be heard. This was demonstrated through a participant response, “...Thank you for bringing to light to such a dark subject. It is so much more painful because we are so misunderstood…” This study suggests that risk factors associated with a higher intensity of grief for parents are being a mother, a shorter length of time since the death, and having no other children. This study also suggests that being able to make some sense of the death is associated with lower levels of grief intensity, which is difficult to do. Of the participants in this study 35.44% reported not being able to make any sense of it, while only 9.93% were able to make a great deal of sense of the death. According to this study, social support after the loss of a child is also associated with lower levels of grief intensity. One of the variables that this study also looked as was the intensity of grief for an unanticipated death versus an anticipated death, such as from cancer or an illness; which were not significantly different from each other, regarding experienced levels of grief. Out of 443 responses, only 28 participants were male. This may reflect cultural norms on how males and females experience and express emotion differently regarding the loss of a child (Keesee, et al., 2008). Dryregov and colleagues (2003, p. 160) suggest that “fathers may postpone their grief…and may be at risk for prolonged grieving.” Future studies may want to consider how to reach bereaved fathers. This study was different in that it recruited not only biological parents, but step and adoptive parents. This study was also unique in that we did not look for specific time frames post loss; it was open to any time post loss. Since time post loss has been shown to be a factor in the intensity of grief (Keesee et. al., 2008), this study attempted to allow all time frames post- loss. Cause of death was explored, but not limited as in other studies of this type. Many studies of this nature attempt to address only certain types of death, such as suicide, SIDS, and accidents (Dryregov, et al., 2003). A major finding was that 83.6% of participants scored at or above the cut off of 44 on the ICG. Prigerson et al., (1995) indicate that participants with a score above are significantly distressed and have impaired functions in their social life, their mental health, and even in their physical health. This has important implications for clinicians, family, and friends to have knowledge that the bereaved parent is suffering longer and more intensely. A limitation to this study was that we did not consider bereaved parents who have lost more than one child. “Bereavement overload” is a phenomenon where an individual experiences multiple losses (Neimeyer & Holland, 2006). Some participants indicated that they completed the survey more than one time for different children, and some participants attempted to respond for more than one child in one survey link. The open-ended sense-making question was categorized into four different themes. There were some responses that did not seem to fit in any of the four categories, and there were some that clearly fit into more than one category. There were also some responses that indicated this question was insensitive. Some responses clearly indicated they were not sure what was meant by sense-making, “Not sure what you are asking. There is no sense to a person dying so young.” Participants also took an opportunity with this response to inform the researchers that there were some confusing parts of the survey, “I found the instructions for the survey confusing at times.” Methods Participants Participants (N = 443) were recruited in one of two ways: (a) direct advertising to The Compassionate Friends (a grief support group) via contact with leaders or through their website; (b) chain referral (Penrod, Preston, Cain, & Starks, 2003); through family, friends, church groups, and social media. Inclusion criteria stipulated that all of the participants had to be at least 18 years of age and had lost a child. Table 1 represents demographics for the participants. Table 1 Demographics and sample characteristics Measures Multidimensional Scale of Perceived Social Support (MSPSS). MSPSS measures the social support from family, friends, or a significant other. This has 12 items on a seven-point scale ranging from very strongly disagree (1) to very strongly agree (7) (e.g., there is a special person who is around when I am in need;” and “I can talk about my problems with my family.”) The original Cronbach’s coefficient alpha was .88 showing good reliability (Zimet, Dahlem, Zimet, & Farley, 1988). Our coefficient alpha was .94. Social Support 2 (SS2). Dryrego, Nordanger and Dryrego (2003) developed statements specifically to measure professional and social network assistance as well as to measure changes in social interaction post-loss. This measure includes seven items such as “I have experienced that other people feel sorry for the family,” and “I have isolated myself from myself from other people” which were rated on a six-point Likert scale ranging from very strongly disagree (1), very strongly agree (6). Cronbach’s alpha for this study was .711. Inventory of Complicated Grief (ICG). The ICG was developed specifically to assess maladaptive reactions to bereavement (Prigerson et al., 1995). The ICG used in the present study includes 19 declarative statements, such as ‘‘I can’t help feeling angry about his/her death;’’ ‘‘Ever since s/he died I feel like I have lost the ability to care about other people;’’ and ‘‘I hear the voice of the person who died speak to me,’’ to which responses are made on a five-point Likert scale describing the frequency of symptoms (from 1, never, to 5, always). Scores can range from 19 to 95, with a clinical cutoff of 442 (Prigerson et al., 1995). Sense-making. Sense-making was assessed by two questions, one qualitative and the other quantitative. First, participants rated the amount of sense-making of the loss experience on a five-point Likert scale, with anchor points of 1 (I have been able to make no sense of my loss), to 5 (I have made a great deal of sense of my loss). Then participants responded to an open-ended question in writing: ‘‘Have there been any ways in which you have been able to make sense of the loss of your child? If so, please, in a brief paragraph, describe that experience.’’ This method corresponds to the manner in which Keesee, Currier, and Neimeyer (2008) measured sense-making. Procedure Each eligible participant completed a questionnaire that elicited demographic information and circumstances surrounding the loss. Order of the questionnaires was MSPSS, social support questions, ICG, and sense-making. The data were collected electronically via a Qualtrics survey link.1Coefficient alpha was determined after eliminating two unreliable items: “I have experienced that other people feel sorry for the family” and “I have gotten closer to other people.” 2This study’s Likert-scale for the ICG was 1-5 which is different than the original ICG (0-4), therefore this study’s cut-off score (44) is different than the original ICG (25). Age, years ± SD 51.07 ± 12.86 Cause of death, N (%) Gender, N (%) Fatal Accident (Eg., motor vehicle accident) 137 (30.93%) Male 26 (5.9%) Natural Sudden (Eg., Heart Attack) 54 (12.19%) Female 415 (93.7%) Natural Anticipated (Eg., cancer, illness) 44 (9.93%) Describe 2 (0.5%) Suicide 30 (6.77%) Ethnicity, N (%) Homicide 60 (13.54%) Caucasian 390 (88%) SIDS 9 (2.03%) African American/Black 17 (3.8%) Stillbirth (20 weeks or greater) 37 (8.35%) Hispanic/Latino 13 (2.9%) Miscarriage (less than 20 weeks) 30 (6.77%) Native American/Native Alaskan 6(1.4%) Drug Overdose 26 (5.87%) Pacific Islander 4 (0.9&) If none above, please describe 16 (3.61%) Asian 1 (.2%) Grouping into unanticipated and anticipated, N (%) Other 12 (2.7%) unanticipated 382 (86.23%) Relationship to child, N (%) anticipated 44 (9.93%) Mother 415 (93.68%) could not group 17 (3.84%) Father 28 (6.32%) Time since death, N (%) Do you have surviving children, N (%) Less than 6 months 38 (8.58%) Yes 315 (71.1%) 6 months to 1 year 54 (12.19%) No 128 (28.9%) More than 1 year 58 (13.09%) Participated in a grief support group, N (%) More than 2 years 44 (9.93%) Yes 344 (77.65%) More than 3 years 33 (7.45%) No 99 (9.93%) More than 4 years 22 (4.97%) More than 5 years 25 (5.64%) More than 6 years 22 (4.97%) More than 7 years 147 (33.18%)