Download to read offline


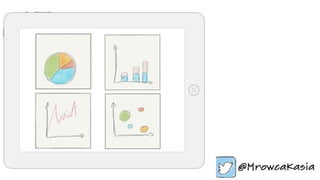


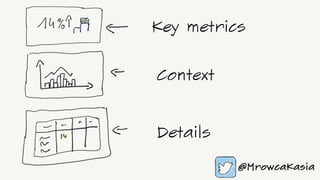


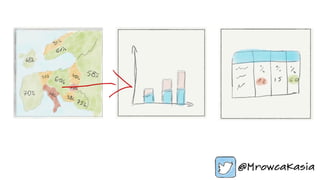
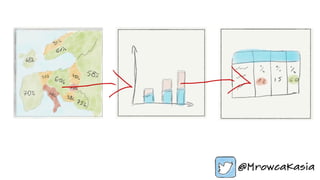


This document discusses data visualization and provides guidance on creating effective visualizations. It is divided into three parts that cover introducing the topic of data visualization, designing visualizations, and getting started with creating visualizations in R and D3.js. The document emphasizes designing visualizations that fit on one screen, use a top-down approach, and make the data interactive. Contact information is provided to connect about data visualization services.


![[ACE'14] The art of saying no](https://cdn.slidesharecdn.com/ss_thumbnails/ace-140619130630-phpapp01-thumbnail.jpg?width=640&height=640&fit=bounds)


