SlideShare a Scribd company logo
1 of 22
Download to read offline
Vol.:(0123456789)
Environment, Development and Sustainability
https://doi.org/10.1007/s10668-021-01321-3
1 3
Estimation of land surface temperature using different
retrieval methods for studying the spatiotemporal variations
of surface urban heat and cold islands in Indian Punjab
Atin Majumder1
· Raj Setia2
· P. K. Kingra1
· Harjinder Sembhi3
· Som Pal Singh1
·
Brijendra Pateriya2
Received: 16 June 2020 / Accepted: 2 March 2021
© The Author(s), under exclusive licence to Springer Nature B.V. 2021
Abstract
Spatial patterns of land surface temperature (LST), surface urban heat island (SUHI),
surface urban cold island (SUCI), and their seasonal variations during January (winter)
and September (summer) were analyzed over the three cities of Indian Punjab (Balachaur,
Ludhiana and Bathinda) using Landsat 5, 7 and 8 satellite data of the years 1991, 2001,
2011, and 2018. Urban hot spots and Urban Thermal Field Variance Index (UTFVI) were
used to measure the ecological environment of these cities. Land surface temperature
was retrieved from Landsat satellite data using Plank equation, mono-window algorithm
(MWA), single-channel algorithm (SCA), and radiative transfer equation. The LST derived
using these algorithms was validated with MODIS-LST product. The relationship between
LST derived from Landsat 5, 7 and 8 using the four methods and MODIS-LST product
was higher with the SCA algorithm (R2
>0.75). Land surface temperature was significantly
positively correlated with built-up but significantly negatively correlated with vegeta-
tion. The surface urban heat intensity was higher during September than January, and it
was higher in Ludhiana followed by Bathinda and Balachaur, irrespective of the season.
Besides built-up area and population density, soil moisture availability in surrounding rural
areas has significant impact on increasing surface urban heat intensity during September
than January. The SUCIs were formed in the center of Bathinda city during January 1991,
but these were in Ludhiana and Balachaur cities during January 2011. The most critical
areas for ecological environment based on UTFVI were identified and the critical UTFVI
values (>0.020) were highest in Bathinda city followed by Balachaur and Ludhiana cities.
These results suggest that SUHIs and SUCIs are influenced by seasons and the mitigating
plans to counteract the overheating of urban areas should be formulated taking into account
soil moisture availability in surrounding rural areas, landscape pattern, seasonal variations,
local climatic conditions, urban growth, and development plan etc.
* Raj Setia
setiark@gmail.com
1
Department of Climate Change and Agricultural Meteorology, Punjab Agricultural University,
Ludhiana 141 004, India
2
Punjab Remote Sensing Centre, Ludhiana, India
3
School of Physics and Astronomy, University of Leicester, Leicester, UK
A. Majumder et al.
1 3
Keywords Landsat · LST · Urban heat island · Urban cold island · UTFVI
1 Introduction
Land surface temperature (LST) is a significant parameter in terrestrial energy exchange
process between surface and atmosphere. LST is the temperature of several millimeters
(mm) of the Earth’s skin making it a major parameter of surface energy balances which has
a significant effect on many biophysical process including evapotranspiration, plant res-
piration, and photosynthesis (Kumar et al., 2017). Satellite thermal infrared (TIR) remote
sensing has been extensively used since 1990 for the retrieval of LST (Ahmed, 2018; Lak-
shmi et al., 2001; Li et al., 2013; Montazeri & Masoodian, 2020). The commonly used
thermal imaging sensors on satellite platforms are: advanced Spaceborne Thermal Emis-
sion and Reflection Radiometer (ASTER), Moderate-resolution Imaging Spectroradiome-
ter (MODIS), and Landsat and the spatial resolution of thermal bands of these satellites are
90 m (Ndossi & Avdan, 2016a, b), 1000 m (A. Li et al., 2019) and 120 m/100 m (resam-
pled to 30 m) (Sekertekin & Bonafoni, 2020), respectively. However, Sea and Land Surface
Temperature Radiometer (SLSTR) onboard Sentinel-3A carries two thermal bands with
spatial resolution of 1000 m (Zheng et al., 2019).
There are a number of algorithms to retrieve the LST using at sensor temperature and
auxiliary data. These methods are mainly grouped into single-channel method and multi-
channel (like split-window algorithms) and multi-angle method. The single-channel
method requires only one thermal sensor to retrieve the LST, whereas split-window algo-
rithm and multi-angle method require two thermal sensors to estimate the LST. In order
to study the temporal changes in LST using Landsat 5 and 7, only single-channel methods
can be used, but split-window algorithm can be used for Landsat 8. However, large calibra-
tion uncertainty in the band 11 of Landsat 8 limits its use. Sekertekin and Bonafoni (2020)
compared mono-window algorithm (MWA), radiative transfer equation (RTE) method, sin-
gle-channel algorithm (SCA), and split-window algorithm (SWA) to retrieve LST over the
rural areas using Landsat 5, 7 and 8. The Land Surface Emissivity Model of Sorbino et al.
(2008) provided the lowest root-mean-square error (RMSE) with RTE and MWA method
using Landsat 5 and Landsat 7/8, respectively. Alipour et al. (2003) compared the MWA
and SCA method to retrieve the LST of western part of the Iran and they found that MWA
algorithm was better than SCA. Similarly, a number of studies have used these algorithms
to estimate the LST (Songhan Wang et al., 2015; Yu et al., 2014; Zhou et al., 2012), but
there are very few studies in which various single-channel algorithms have been compared
to estimate the LST in Indian Punjab. The long-term changes in land use and land cover
(LULC) at various scales affect temperature and convective process which brings local
rains at many meteorological regions. The major impact of LULC changes on climate is
due to urban sprawl which changes natural habitats, biodiversity and alters biogeochemical
cycles including hydrological and nutrient cycles (Bentley et al., 2020; Guha et al., 2017).
The urban sprawl reduces vegetation and other land cover features and thus contributes
to urban heat island (UHI) intensities (Chakraborty et al., 2015). Urban heat island is a
phenomenon which refers to temperatures difference between cities and surroundings rural
areas (Rinner and Hussain, 2011), and it was first introduced by Howard in 1833, and till
now this phenomenon is manifested due to its effect on health, air quality and resource
use (Laosuwan & Sangpradit, 2012). Surawar and Kotharkar (2017) studied the effect of
changes in LULC on LST and its effect on urban heat island (UHI) formation within the
Estimation of land surface temperature using different retrieval…
1 3
Nagpur city (India) using Landsat 7 ETM+. Their results showed that area under built-up
increases with decrease in vegetation cover in the study area. The UHI intensity in Nagpur
was increased by 0.7 °C from 2000 to 2006; however, a drastic increase was observed with
difference of 1.8 °C during the period 2006–2013. Tsou et al. (2017) studied the distribu-
tion of LST over Shenzhen and Hong Kong using the Landsat 8 data and also assessed the
UHI phenomenon over the study region. Their results showed that LST was significantly
negatively correlated with the vegetation. Mathew et al. (2016) found an average annual
UHI intensity from 4.98 to 5.43 o
K from 2009 to 2013 in Chandigarh (India). de Faria
Peres et al. (2018) studied the UHI phenomenon in Metropolitan Area of Rio de Janeiro
using LST derived from Landsat 5, 7 and 8. Mukherjee et al. (2017) used the MODIS-LST
products (spatial resolution 1000 m) for studying the surface UHI in the major cities of
Indian Punjab. Most of these studies are mainly confined to analyze the UHI effect in a sin-
gle city (or few cities), but did not study the effect of seasonal variations on surface urban
heat intensity. Few studies have shown that climate variations greatly affect the UHI effect
across landscapes (Dialesandro et al., 2019; Yang et al., 2017). The Sea and Land Surface
Temperature Radiometer (SLSTR) onboard the Sentinel-3 satellite provides the high qual-
ity estimates of LST using a split-window algorithm (SWA) which implicitly utilizes the
land surface emissivity (LSE). Zheng et al. (2019) modified the conventional split-window
algorithm to retrieve LST from Sentinel-3A SLSTR MIR and TIR data, and they found
that LST can be estimated with the accuracy better than 1 K. Dar et al (2019) estimated
the land surface temperature in the parts of North India using Landsat-7 ETM+, TM, and
Terra ASTER satellite data and found that Landsat ETM+data was better than ASTER to
capture the temperature variations in the heterogeneous classes (like vegetation and rock
exposures), whereas the thermal band of ASTER ­
(B15) was better than Landsat ETM+and
TM to capture the temperature changes in the homogeneous classes (like snow and ice).
Urban hot spots (UHS) are the areas within the UHI which experience extreme heat
stress mainly due to manmade activities (Zhou et al., 2015). Therefore, identification of
UHS within a city helps in formulating the mitigation purposes for maintaining the ecolog-
ical balance within a city. Besides UHS, a number of thermal comfort indices (like temper-
ature-humidity index and physiological equivalent temperature, etc.) have been developed
for measuring the effects of UHI intensity but urban thermal field variance index (UTFVI)
is directly related with LST, therefore, this index is commonly used for the ecological eval-
uation of urban environments (Guha et al., 2017). The thermal comfort level of Raipur city
in India was studied by Guha et al. (2017) using the UTFVI and found that outer peripher-
ies of the city were ecologically not comfortable. There are very few studies in which ther-
mal comfort level in cities of Indian Punjab have been studied.
Kingra et al. (2018) found an increase in minimum air temperature of Punjab over a
period of 1974–2013 and the population of Punjab has increased sharply after 1970s. The
urban areas in Punjab have been increased by 201% from 1971 to 2001 (Tripathi & Mahey,
2017)which may cause an increase in urban heat island. This phenomenon not only affects
people psychologically and physiologically, but also increased energy consumption, con-
trols behavioral and economical changes, and can enforce to a sudden increase in morbidity
and mortality within urban areas (Ningrum, 2018). Few studies have used satellite remote
sensing for analyzing the UHI effect in Punjab using MODIS satellite data (Kumar et al.,
2017; Mukherjee et al., 2017) but there are very few studies in which the effects of seasons
on both urban heat and cold islands, and the thermal comfort level have been studied in the
cities of Indian Punjab using Landsat satellite data. The specific objectives of this study
were (i) to compare various algorithms to estimate the LST using Landsat 5, 7 and 8, (ii) to
identify the surface urban heat and cold islands in three cities located in different climatic
A. Majumder et al.
1 3
regions of Indian Punjab based on LST derived from Landsat satellite data over a period
of 27 years (1991–2018), (iii) to study the effect of seasons on surface urban heat and cold
islands, (iv) to locate the urban hot spots within the UHI and the cold spots within the UCI,
and (v) evaluation of ecological environment of the cities using the UTFVI index.
2 Material and methods
2.1 Study area
The three cities in Indian Punjab (Bathinda, Balachaur and Ludhiana) were selected on the
basis of landscape pattern and climatic conditions, among which Balachaur is in the sub-
mountain region, Ludhiana in the semiarid region and Bathinda in the arid region (Fig. 1).
The major physiographic unit of Balachaur is upland plain which is surrounded by river
and hills. Balachaur has semiarid subtropical climate with hot summers and cold winters.
The climate of Ludhiana, an industrial city of Punjab is subtropical subject to southeasterly
summer rains. The westerly atmospheric depressions cause winter rains. Ludhiana is situ-
ated in the center of the Punjab plain region which is devoid of major topographic features
and is conspicuously a flat terrain. The climate of Bathinda is characterized by a sweltering
and humid summer followed by dry and cool winter. Bathinda is surrounded by alluvial
plain and sand dunes. The population and its density are higher in Ludhiana city followed
by Bathinda and Balachaur. The main cropping system around rural areas of each city is
paddy (June–October) and wheat (November–April).
Fig. 1  Study area
Estimation of land surface temperature using different retrieval…
1 3
2.2 Satellite data
The Landsat program has provided long-term and consistent thermal infrared data through
the Landsat 4–8 satellites which carry on board thermal infrared (TIR) sensors. Landsat 4
and 5 included a single thermal band (band 6) on the Thematic Mapper (TM) sensor with
120 m spatial resolution (resampled to 30 m). Landsat 7 also included the similar band on
the Enhanced Thematic Mapper Plus (ETM+) sensor with 60 m spatial resolution (resam-
pled to 30 m). Landsat 8 has a separate Thermal Infrared Sensor (TIRS) with two thermal
bands (Band 10 and Band 11) and the TIRS bands are acquired at 100 m spatial resolu-
tion (resampled to 30 m). The Landsat satellite data of the years 1991, 2001, 2011 and
2018 (January and September) was downloaded from Earth Explorer of the United States
Geological Survey (USGS). The following satellite data was used for this study (Table S1,
Supporting information):
A. Years 1991 and 2011: Landsat-5 TM (Thematic Mapper)
B. Year 2001: Landsat-7 ETM+(Enhanced Thematic Mapper Plus)
C. Year 2018: Landsat-8
2.3 Extraction of land cover features using spectral indices
Remote sensing of vegetation is mainly performed to obtain the electromagnetic wave
reflectance information from canopies using passive sensors. It is well known that the
reflectance of light spectra from plants changes with plant type, water content within tis-
sues, and other intrinsic factors. Indices extracted from this light spectra range can be
attributed to a range of characteristics beyond growth and vigor quantification of plants
related to water content, pigments, sugar and carbohydrate content, protein content, and
aromatics among others (Foley et al., 1998). The Landsat downloaded images were terrain
corrected with projection system of UTM-WGS 84. The digital numbers of these Landsat
images were converted to radiance (radiometric correction) followed by surface reflectance
to eliminate the effect of atmospheric and illumination factors on the radiance values. The
surface reflectance of each band was used for extracting the land cover features using the
following spectral indices:
(a) Normalized Difference Vegetation Index (NDVI) for extracting vegetation=(NIR-R)/
(NIR+R)
(b) Normalized Difference Built-up Index (NDBI) for extracting built-up features=(NIR
– SWIR)/(NIR+SWIR)
(c) Modified Normalized Difference Water Index (MNDWI) for extracting water fea-
tures=(Green – MIR)/(Green+MIR)
(d) Normalized Difference Bareness Index (NDBaI) for extracting bare soil =(SWIR –
TIR)/(SWIR+TIR)
2.4 Retrieval of LST from Landsat‑5, Landsat‑7, and Landsat‑8
Thermal sensors detect emitted radiant energy. Due to atmospheric effects, these sensors
usually operate in the 3–5 μm or 8–14 μm. Most thermal remote sensing of earth features
lies in the range between 8 and 14 μm range because peak emission (based on Wien’s Law)
for objects around 300°K occurs at 9.7 μm. The radiometric corrections were performed
A. Majumder et al.
1 3
to convert the digital numbers to Top-of-Atmosphere (TOA) spectral radiance followed by
brightness temperature using the equations given in Majumder et al. (2020). However, for
Landsat 8, the digital numbers were converted to TOA radiance using band specific mul-
tiplicative rescaling factor, band-specific additive rescaling factor and offsets values. For
Landsat 5 and 7, gain and bias method was used to convert digital numbers to TOA radi-
ance. After conversion of digital numbers to TOA radiance for thermal sensors of Landsat
5, 7 and 8, brightness temperature was calculated from TOA radiance. Brightness tem-
perature is the temperature of a blackbody in thermal equilibrium with its surroundings.
Though brightness temperature is used for temperature measurement, but it has no physical
meaning. The real temperature of a surface is calculated by dividing the brightness tem-
perature by emissivity. The emissivity (ϵ) at a wavelength is defined as the ratio of radiance
emitted by a body at temperature T and the radiance emitted by a black body at the same
temperature T. Emissivity is affected by surface and wavelength. There are various meth-
ods to calculate the LSE, but we used the NDVI-based emissivity method of Sobrino et al.
(2008) to calculate the LSE. The LSE is 0.995 for NDVI less than − 0.185, 0.985 for NDVI
values between − 0.185 and 0.157, 1.009+0.047 × ln (NDVI) for NDVI values between
0.157 and 0.727 and 0.990 for NDVI values more than 0.727. Once radiance, brightness
temperature, and LSE are known, then brightness temperature is corrected against LSE and
atmospheric parameters. There are many algorithms to estimate LST from Landsat data,
but we used the four LST algorithms in this study: Plank`s equation (PE), mono-window
algorithm (MWA), radiative transfer equation (RTE), and single-channel algorithm (SCA).
The methodology to retrieve the LST using Plank`s equation is given in Majumder et al.
(2020). The details of MWA (Qin et al., 2001), SCA and RTE method have been given in
Sekertekin and Bonafoni (2020) and Ndossi and Avdan (2016a, b). The major difference
among these methods is the atmospheric correction process. In the Plank equation, LSE is
corrected using wavelength of the emitted radiance, brightness temperature (at sensor) and
plank constant. The MWA requires the knowledge effective mean atmospheric tempera-
ture, and atmospheric transmittance (two atmospheric parameters) besides LSE to estimate
the LST. For RTE method, the input parameters required to estimate the LST are upwelling
(or atmospheric path) radiance, down-welling (or sky) radiance, atmospheric transmittance
(three atmospheric parameters) besides radiance of the black body target of kinetic temper-
ature. The three atmospheric parameters in RTE method are calculated from atmospheric
profile using a radiative transfer model (Ndossi  Avdan, 2016a, b). The SCA method
requires the total atmospheric water vapor content, channel effective wavelength and LSE
to estimate the LST. In order to compare the four methods, LST was estimated using cloud
cleared (less than 10%) level 1 product of Landsat 5 (September 2011), Landsat 7 (Sep-
tember 2001) and Landsat 8 (September 2018). A brief overview of the calculation of LST
from these methods is given in Fig. S1 (Supporting information).
2.5 Intercomparison of Landsat derived LST with MODIS‑LST data
The ground measurements of LST were not taken so MODIS-LST products of September
2001, 2011 and 2018 were used in this study as a reference image for comparison of the
LST derived from Landsat. The LST retrieved from Landsat 5, 7 and 8 using PE, MWA,
RTE and SCA methods was validated with the MODIS data. The random points (n=100)
of MODIS-LST product of each year were generated and the values corresponding to
these points were extracted from the LST estimated from Landsat 5, 7 and 8 using the four
Estimation of land surface temperature using different retrieval…
1 3
methods. The relationship between LST derived using Landsat and MODIS data was stud-
ied using linear regression and Residual Mean Square Error (RMSE).
2.6 Mapping of Surface Urban Heat Island (SUHI) and Surface Urban Cold Island
(SCHI)
The surface urban heat and cold islands were calculated using the following equation:
A buffer area of 10 km around the boundary of main city was created to calculate the LST
of rural areas in different years. We also used the above equation to calculate the surface
urban heat and cold intensity.
2.7 Delineation of Urban Hot Spot (UHS)
The LST maps of all the years (January and September) were used to study the UHS in the
three cities. The following equation was used to measure the UHS:
μ is the mean temperature and δ is the standard deviation of the image.
2.8 Urban Thermal Field Variance Index (UTFVI)
Urban Thermal Field Variance Index (UTFVI) has been used for the ecological evaluation
of temperature distribution and its impacts on the quality of urban life (Guha et al., 2017;
Wang et al., 2018). The following equation was used to calculate the UTFVI:
Where Ts is the LST (°C) of the imagery. Tmean is the mean LST (°C) of the imagery.
The UTFVI was calculated for September 2018 which is hot and humid, and it greatly
affects human comfort.
3 Results and discussion
3.1 Comparison of retrieval methods to estimate the LST in the three cities
of Punjab
The relationship between LST estimated using PE, MWA, RTE, and SCA methods, and
MODIS–LST product showed that the coefficient of determination (R2
) was in the order:
SCARTEMWAPlank and the RMSE was in the order: SCAPlankMWARTE
(Table 1), therefore SCA algorithm was used to retrieve LST for all the cities during dif-
ferent years. García-Santos (2018) found that SCA method was better than RTE method to
estimate LST because RTE method requires the information about atmospheric profile at
the time of satellite pass. Masek et al. (2006) and Weng et al (2014) found that there was a
positive correlation between MODIS and Landsat derived LST.
SUHI/SUCI = (LST) Urban - (LST) Rural
LST  𝜇 + 2 ∗ 𝛿
UTFVI = (Ts − Tmean)∕Tmean
A. Majumder et al.
1 3
3.2 Spatiotemporal pattern of land use and land cover
The spatial pattern of built-up in Balachaur city over 27 years indicated that the built-up
expansion was mainly in Northwest of Balachaur city between 1991 and 2001, however
it was in Northwest and South directions between 2001 and 2018 (Fig. S2, Supporting
information). In Ludhiana city, the expansion of built-up was in the directions where
vegetation was available and the built-up growth was higher in the outer parts compared
with the inner part of Ludhiana city. Between the year 2001 and 2018, built-up has been
mainly expanded in the north of Bathinda (Fig. S2, Supporting information). These
results suggest that there is need for policy shifting from horizontal expansion of these
cities to vertical expansion to accommodate population growth in a sustainable manner.
Moreover, the horizontal expansion of cities has significant impact on environment and
population health (Pan, 2016).
3.3 Spatiotemporal variations in surface temperature of built‑up, vegetation,
water and bare soil
The temporal variations in surface temperature of impervious surfaces were variable over
27 years in Bathinda, Ludhiana and Balachaur cities (Table 2). The surface temperature of
built-up was increased over the years in these three cities. The degree of increase of surface
temperature was highest from the year 1991 to 2001, but there was a decrease in tempera-
ture from 2001 to 2011 followed by increase in 2018. During the year 2011, the average
cloud cover was higher (approximately 16%) compared with the other years due to which
the incoming solar radiation was lesser and a high pressure along with low wind speed
(less than 2 km per hour) created the stable atmospheric condition which reduced the free
advection and convection of the heat. The increase in temperature over the years was more
in inner parts of the city than the outskirts of the city. It was higher by 3–4 °C in Bathinda
city, 4–5 °C in Ludhiana city and 2–3 °C in Balachaur city from 1991 to 2001. This was
related with the changes in LULC which were higher from 1991 to 2001. The surface tem-
perature is influenced by properties of urban materials (including materials used for roofs,
paving and coating and painting) which affect solar reflectance, thermal emissivity, and
heat capacity (Akbari et al., 2012). In general, evapotranspiration from urban materials
does not take place because these are water resistant. Furthermore, urban surfaces absorb
and retain more of the sun’s heat than natural vegetation which causes increase in tempera-
ture of the urban areas.
Table 1  Results of the statistical test for the relationship between LST estimated from Landsat satellite data
using various algorithms and MODIS-LST product
LST algorithm Landsat 5 (September
2011)
Landsat 7 (September
2001)
Landsat 8 (Septem-
ber 2018)
R2
RMSE R2
RMSE R2
RMSE
Mono-window algorithm 0.58 3.25 0.59 3.25 0.61 2.88
Plank`s equation 0.60 3.13 0.62 2.99 0.63 2.80
Radiative transfer equation 0.65 3.38 0.74 3.35 0.67 2.92
Single-channel algorithm 0.75 2.25 0.79 2.32 0.82 2.00
Estimation of land surface temperature using different retrieval…
1 3
Similar the case of built-up regions, there was an increase in temperature of vegeta-
tion from 1991 to 2001 followed by decrease in temperature from 2001 to 2011 and
again increase in 2011 (Table 2). There was an effect of urban climate on increasing the
temperature of vegetation growing in the cities. Zhang et al (2004) also found that the
effect of urban footprints on increasing the temperature of vegetation growing in the cit-
ies is more than and decreases gradually towards rural areas.
The spatial and temporal changes in temperature of water bodies were similar to
built-up and vegetation. The water bodies around the built-up features significantly
affected the temperature of urban properties. For example, surface temperature was low-
ered by 1–2 °C in January 2018 and 2–3 °C in September 2018 in the urban proper-
ties surrounded by water bodies than the urban areas not surrounded by water bodies
in Ludhiana city (Table 2). These results suggest that there is positive impact of water
bodies on microclimate of the surrounding regions. Water bodies are the best radiation
absorbers, but they provide a very small thermal response (Kumar et al., 2017). The
sensible heat of the air and the surrounding areas are absorbed to be used as latent heat
necessary to evaporate water. The amount of heat absorbed depends on the amount of
water that can be evaporated so the areas near to the water body remain cooler (Zhou
et al., 2012).
The spatiotemporal variations of surface temperature in Balachaur city over 25 years
indicated that temperature was increased between 1991 and 2018 mainly in northeast and
center of the city (Fig. S4, Supporting information). The outer parts of Ludhiana city had
higher temperature than the inner parts during January 2011, but there was an increase in
temperature in all the directions during January 2018 due to expansion of built-up area
in all the directions of the Ludhiana. (Fig. S5, Supporting information). There was an
increase in temperature from 1991 to 2001 in northern part of Bathinda city (Fig. S6, Sup-
porting information). However, temperature increased in northwestern direction between
Table 2  Temporal changes in LST (o
C) of different land cover features in Balachaur Ludhiana and Bathinda
cities of Indian Punjab during January and September of the years 1991, 2001, 2011 and 2018
Year Built-up Bare soil Vegetation Water body
January September January September January September January September
Balachaur City
1991 16.4 28.6 17.2 28.9 13.2 25.8 14.0 27.1
2001 16.9 30.6 21.3 31.3 16.9 29.0 18.8 27.9
2011 17.2 29.1 18.3 28.7 17.5 28.5 16.4 29.2
2018 22.4 31.8 23.3 32.4 20.7 28.0 21.1 31.1
Ludhiana City
1991 16.2 29.4 17.8 29.3 13.1 25.5 15.2 28.1
2001 20.3 29.7 22.6 29.2 16.1 25.7 19.0 27.0
2011 16.1 29.8 16.8 29.7 15.1 29.3 15.7 28.9
2018 22.4 32.4 23.8 30.9 18.8 28.2 22.4 32.5
Bathinda City
1991 19.4 31.0 20.2 32.6 18.6 28.2 15.9 28.5
2001 21.6 32.3 22.4 26.2 15.4 26.9 19.9 30.9
2011 17.8 31.3 18.7 31.4 16.6 26.5 15.8 28.6
2018 23.1 34.0 25.4 35.3 20.2 28.2 20.3 30.3
A. Majumder et al.
1 3
September 2001 and 2011, but it increased in the western and southern part of the city
between 2011 and 2018.
These results suggest that the effect of land surface characteristics on surface tempera-
ture was variable: positive effects by vegetation and water, but negative effects by built-up
and bare soil. The development of the cities has increased surface temperature over the
years but the increase was higher in the inner part of the cities than the outskirts.
3.4 Spatiotemporal pattern of urban heat island and urban cold island
In Balachaur, the urban areas had 0.75, 1.45, and 1.90 °C higher temperatures compared
with their rural areas during 1991, 2001, and 2018, respectively (Table 3). The surface
temperature of urban areas in Ludhiana was 1.40, 1.65, and 3.41 °C higher than rural areas
during 1991, 2001, and 2018, respectively (Table 3). On an average, the urban areas in
Bathinda had 2.10, 1.30 and 3.25 °C higher temperatures compared with their rural areas
during 2001, 2011 and 2018, respectively (Table 3). This pattern was expected because
of extending the areas of municipal limits in these three cities by policy makers and the
changes in policies caused conversion of vegetation and other features to impervious sur-
faces (like industry and residential buildings).
The cold islands were formed in Balachaur and Ludhiana during January 2011 and in
Bathinda during January 1991 (Table 3). This was mainly due to lowering of minimum
air temperature during this period. During night time of these years, excessive radiational
cooling made the built-up surface colder than the air above it. So at next morning, daytime
inversion occurred when it came in contact with that warmer air parcel. This phenomenon
is also called advection inversion, where the lower atmosphere was colder than the upper
one (Haeger-Eugensson and Holmer 1999).
Table 3  Temporal changes in
surface urban heat and cold
intensity (o
C) in Balachaur
Ludhiana and Bathinda cities of
Indian Punjab during January
and September of the years 1991,
2001, 2011 and 2018
Year January September
Surface urban
heat intensity
Surface urban
cold intensity
Surface Urban
heat intensity
Surface urban
cold intensity
Balachaur City
1991 0.30 – 1.20 –
2001 1.10 – 1.80 –
2011 – – 0.60 0.90 –
2018 1.80 – 2.00 –
Ludhiana City
1991 0.80 – 2.00 –
2001 1.40 – 1.90 –
2011 – – 0.40 1.70 –
2018 2.12 – 4.70 –
Bathinda City
1991 – – 0.30 1.80 –
2001 1.80 – 2.40 –
2011 0.50 – 2.10 –
2018 3.10 – 3.40 –
Estimation of land surface temperature using different retrieval…
1 3
The UHI effect in Bathinda, Ludhiana and Balachaur city showed (Figs. 2, 3, 4) that
the spatial pattern of UHI was related with the location of land cover change which was
mainly related with urban development. The UHS was highest in Balachaur city (3.70%
Fig. 2  Spatiotemporal pattern of UHI/UCI in the Balachaur city of Indian Punjab during January and Sep-
tember of the years 1991, 2001, 2011 and 2018
A. Majumder et al.
1 3
of total city area) during January and highest in Ludhiana city (5.96% of total city area)
followed by Bathinda city (3.80% of total city area) during September (Table 4). The UHS
effect was more concentrated in Northwestern and Southern-east parts of the Ludhiana and
Fig. 3  Spatiotemporal pattern of UHI/UCI in the Ludhiana city of Indian Punjab during January and Sep-
tember of the years 1991, 2001, 2011 and 2018
Estimation of land surface temperature using different retrieval…
1 3
Fig. 4  Spatiotemporal pattern of
UHI/UCI in the Bathinda city
of Indian Punjab during January
and September of the years 1991,
2001, 2011 and 2018
A. Majumder et al.
1 3
Bathinda cities during January but at the center of the Balachaur city during September
(Figs. 5, 6, 7).
The surface urban heat intensity was higher during September than January from 1991
to 2018. This was mainly due to availability of sunshine hours and soil moisture during
January and September. The day length or maximum possible sunshine hours are more
during September than January, therefore insulation is more during September than Janu-
ary to heat up the earth surface (Veeran  Kumar, 1993). Since paddy is grown in sur-
rounding rural areas during September, therefore soil moisture availability is higher during
September than January. Higher soil moisture coupled with higher air temperature results
in higher evapotranspiration which causes cooling of surrounding rural areas (Kumar et al.,
2017; Yang et al., 2017), therefore the difference in temperature between urban and sur-
rounding rural areas is higher during September, The surface urban heat intensity was in
the order: LudhianaBathindaBalachaur and this was mainly related with built-up area
and population in these cities.
The SUCI was formed in Bathinda city during January 1991 only, but it was formed in
Ludhiana and Balachaur during January 2011. The surrounding rural areas of Balachaur city
were warmer by 0.60 °C than the urban area during January 2011 (Fig. 2). The urban areas of
Ludhiana city were colder by 0.40 °C during January 2011 than the surrounding rural areas
(Fig. 3). The surrounding rural areas were warmer by 0.30 °C than the urban area of Bathinda
city during January 2011 (Fig. 4). The reason for this phenomenon was not clear, but might
be related to lowering of minimum air temperature in these particular months during winter.
The lowering of minimum air temperature in Bathinda during January of the year 1991 but in
Ludhiana and Balachaur during 2011 resulted in the use of higher heating equipment for heat-
ing which may decrease incoming short wave solar radiation in the urban areas compared with
surrounded rural areas (Zhou et al., 2015), and due to excessive radiational cooling at night,
also the concrete area of the main city radiates more radiation and become colder than the
Table 4  Temporal changes in
areas under urban hot spots
(UHS) in Balachaur, Ludhiana,
and Bathinda cities of Indian
Punjab during January and
September of the years 1991,
2001, 2011 and 2018
Year Percent area (%)
UHS (January) UHS
(Septem-
ber)
Balachaur City
1991 3.70 1.48
2001 2.58 1.40
2011 1.86 0.84
2018 2.10 1.98
Ludhiana City
1991 1.94 5.96
2001 0.13 2.30
2011 2.36 5.53
2018 2.96 2.23
Bathinda City
1991 0.89 2.69
2001 1.87 2.26
2011 1.53 3.80
2018 2.81 0.85
Estimation of land surface temperature using different retrieval…
1 3
Fig. 5  Spatiotemporal pattern of UHS in the Balachaur city of Indian Punjab during January and September
of the years 1991, 2001, 2011 and 2018
A. Majumder et al.
1 3
Fig. 6  Spatiotemporal pattern of UHS in the Ludhiana city of Indian Punjab during January and September
of the years 1991, 2001, 2011 and 2018
Estimation of land surface temperature using different retrieval…
1 3
Fig. 7  Spatiotemporal pattern
of UHS in the Bathinda city of
Indian Punjab during January
and September of the years 1991,
2001, 2011 and 2018
A. Majumder et al.
1 3
surrounding area. This might have resulted in artificially reducing urban temperature and even
resulted in the cold island effect.
3.5 Ecological evaluation of Balachaur, Ludhiana and Bathinda cities using UTFVI
The UTFVI values during September 2018 were divided into six categories. The three cit-
ies have the extreme categories: excellent (UTFVI0) and worst (UTFVI0.020). The area
under excellent thermal condition was 52.3% in Balachaur city, 52.6% in Ludhiana city and
46.3% in Bathinda city (Table 5). The normal thermal conditions were 0.32% of the total
area in Balachaur city, 0.26% of the total area in Ludhiana city and 0.18% of the total area
in Bathinda city. The area under UTFVI0.020 (worst thermal condition) was highest in
Bathinda (53.0% area) followed by Balachaur (46.8%) and Ludhiana (46.3%) during Septem-
ber 2018. The excellent thermal conditions were in the periphery region of Balachaur city,
central and western portion in Ludhiana city and northeastern, northwestern, and southern
direction in Bathinda city, but the worst thermal conditions were mainly in center portion of
the Balachaur city, periphery region in Ludhiana city and middle part of the Bathinda city
(Fig. 8).
Table 5  Area under different
classes of UTFVI in Balachaur,
Ludhiana and Bathinda cities of
Indian Punjab during January
and September of the years 1991,
2001, 2011 and 2018
UTFVI Percent area (%)
Balachaur City
0 52.3
0–0.005 0.32
0.005–0.010 0.14
0.010–0.015 0.20
0.015–0.020 0.26
0.020 46.8
Ludhiana City
0 52.6
0–0.005 0.26
0.005–0.010 0.25
0.010–0.015 0.26
0.015–0.020 0.26
0.020 46.3
Bathinda City
0 46.3
0–0.005 0.18
0.005–0.010 0.15
0.010–0.015 0.15
0.015–0.020 0.15
0.020 53.0
Estimation of land surface temperature using different retrieval…
1 3
Fig. 8  Spatial pattern of UTFVI
in Balachaur, Ludhiana and
Bathinda cities of Indian Punjab
during September 2018
A. Majumder et al.
1 3
4 Conclusions
The results of this study showed that single-channel algorithm was better over Plank equa-
tion, mono-window algorithm, and radiative transfer equation to estimate the LST from
Landsat satellite images in Indian Punjab. This study has shown the effect of changes in
LULC and seasons on LST and the formation of urban heat/cold islands in the three cit-
ies of Indian Punjab in different climatic regions (Balachaur in sub-humid, Ludhiana in
semiarid and Bathinda in arid region). The urban sprawl increased the surface temperature
of built-up, bare soil, vegetation and water bodies over the years. However, an increase in
built-up area followed by soil moisture availability in surrounding rural area and air tem-
perature are the main causes of UHIs and UCIs which may have different consequences
on human and environment. The surface urban heat intensity was higher during Septem-
ber than January from 1991 to 2018. The effect of increasing urban heat intensity over
the years was higher in Ludhiana followed by Bathinda and Balachaur. The surface cold
intensity was concentrated in the center of city during January 1991 in Bathinda city and
during January 2011 in Ludhiana and Balachaur cities. More than 30% areas in Balachaur,
Ludhiana and Bathinda have worst thermal conditions and it may affect the heat related
mortality. The accuracy of LST retrieval methods is significantly affected by land surface
emissivity (LSE). In this study, one NDVI-based LSE model was used but further stud-
ies are required to study the impact of different NDVI-based LSE models on the accuracy
of LST derived from satellite data. The ground measurements of LST are also required
to select the best method for retrieving LST from satellite images. These result suggest
that increased temperature due to increased UHI will significantly influenced the urban cli-
mates, urban hydrological situations, biological habits, material cycles, energy metabolism
and population health (Yang et al., 2016). The mitigation measures include controlling an
increase in built-up area, better planning of built-up area and increasing the area under blue
and green to maintain a balance among social, ecological and economical factors. There
should be policy on the use of building materials with lower absorptivity, higher reflectiv-
ity, and larger thermal conductivity, and the top floor of high buildings should use the cool
paint and roof ventilation. The day time surface urban heat/cold intensity is not only con-
trolled by population density and built-up area but also by soil moisture availability in sur-
rounding rural areas. In order to tackle the negative effect of urban sprawl and making the
excellent thermal conditions in these cities, smart growth policies are required to mitigate
the UHI effect.
Supplementary Information The online version contains supplementary material available at https://​doi.​
org/​10.​1007/​s10668-​021-​01321-3.
References
Ahmed, S. (2018). Assessment of urban heat islands and impact of climate change on socioeconomic over
Suez Governorate using remote sensing and GIS techniques. The Egyptian Journal of Remote Sensing
and Space Science, 21(1), 15–25.
Akbari, H., Matthews, H. D.,  Seto, D. (2012). The long-term effect of increasing the albedo of urban
areas. Environmental Research Letters, 7(2), 024004.
Alipour, T., Sarajian, M.,  Esmaeily, A. (2003). Land surface temperature estimation from thermal band
of landsat sensor, case study: Alashtar city. The International Achieves of the Photogrammetry, Remote
Sensing and Spatial Information Sciences, 38(4), 1–6.
Estimation of land surface temperature using different retrieval…
1 3
Bentley, M. L., Sae-Jung, J., Kaminski, S.,  Kesavawong, P. (2020). Documenting the evolution and
expansion of surface urban heat in the Bangkok Metropolitan Region, 2000–2019. Asian Geographer,
37(2), 171–188.
Chakraborty, S. D., Kant, Y.,  Mitra, D. (2015). Assessment of land surface temperature and heat fluxes
over Delhi using remote sensing data. Journal of environmental management, 148, 143–152.
Dar, I., Qadir, J.,  Shukla, A. (2019). Estimation of LST from multi-sensor thermal remote sensing data
and evaluating the influence of sensor characteristics. Annals of GIS, 25(3), 263–281.
de Faria Peres, L., de Lucena, A. J., RotunnoFilho, O. C.,  de Almeida França, J. R. (2018). The urban
heat island in Rio de Janeiro, Brazil, in the last 30 years using remote sensing data. International Jour-
nal of Applied Earth Observation and Geoinformation, 64, 104–116.
Dialesandro, J. M., Wheeler, S. M.,  Abunnasr, Y. (2019). Urban heat island behaviors in dryland regions.
Environmental Research Communications, 1(8), 081005.
Foley, W. J., McIlwee, A., Lawler, I., Aragones, L., Woolnough, A. P.,  Berding, N. (1998). Ecologi-
cal applications of near infrared reflectance spectroscopy–a tool for rapid, cost-effective prediction of
the composition of plant and animal tissues and aspects of animal performance. Oecologia, 116(3),
293–305.
García-Santos, V., Cuxart, J., Martínez-Villagrasa, D., Jiménez, M. A.,  Simó, G. (2018). Comparison of
three methods for estimating land surface temperature from landsat 8-tirs sensor data. Remote Sensing,
10(9), 1450.
Guha, S., Govil, H.,  Mukherjee, S. (2017). Dynamic analysis and ecological evaluation of urban heat
islands in Raipur city India. Journal of Applied Remote Sensing, 11(3), 036020.
Haeger-Eugensson, M.,  Holmer, B. (1999). Advection caused by the urban heat island circulation as a
regulating factor on the nocturnal urban heat island. International Journal of Climatology: A Journal
of the Royal Meteorological Society, 19(9), 975–988.
Kingra, P., Setia, R., Kaur, J., Singh, S., Singh, S. P., Kukal, S., et al. (2018). Assessing the impact of cli-
mate variations on wheat yield in north-west India using GIS. Spatial Information Research, 26(3),
281–294.
Kumar, R., Mishra, V., Buzan, J., Kumar, R., Shindell, D.,  Huber, M. (2017). Dominant control of agri-
culture and irrigation on urban heat island in India. Scientific reports, 7(1), 1–10.
Lakshmi, V., Czajkowski, K., Dubayah, R.,  Susskind, J. (2001). Land surface air temperature mapping
using TOVS and AVHRR. International Journal of Remote Sensing, 22(4), 643–662.
Laosuwan, T.,  Sangpradit, S. (2012). Urban heat island monitoring and analysis by using integration of
satellite data and knowledge based method. International Journal of Development and Sustainability,
1(2), 99–110.
Li, A., Xia, C., Bao, C.,  Yin, G. (2019). Using MODIS land surface temperatures for permafrost thermal
modeling in beiluhe basin on the Qinghai-Tibet Plateau. Sensors, 19(19), 4200.
Li, Z.-L., Tang, B.-H., Wu, H., Ren, H., Yan, G., Wan, Z., et al. (2013). Satellite-derived land surface tem-
perature: Current status and perspectives. Remote sensing of environment, 131, 14–37.
Majumder, A., Kingra, P., Setia, R., Singh, S. P.,  Pateriya, B. (2020). Influence of land use/land cover
changes on surface temperature and its effect on crop yield in different agro-climatic regions of Indian
Punjab. Geocarto International, 35(6), 663–686.
Masek, J. G., Vermote, E. F., Saleous, N. E., Wolfe, R., Hall, F. G., Huemmrich, K. F., et al. (2006). A
Landsat surface reflectance dataset for North America, 1990–2000. IEEE Geoscience and Remote
Sensing Letters, 3(1), 68–72.
Mathew, A., Khandelwal, S.,  Kaul, N. (2016). Spatial and temporal variations of urban heat island effect
and the effect of percentage impervious surface area and elevation on land surface temperature: Study
of Chandigarh city, India. Sustainable Cities and Society, 26, 264–277.
Montazeri, M.,  Masoodian, S. A. (2020). Tempo-spatial behavior of surface urban heat island of Isfahan
Metropolitan Area. Journal of the Indian Society of Remote Sensing, 48(2), 263–270.
Mukherjee, S., Joshi, P.,  Garg, R. (2017). Analysis of urban built-up areas and surface urban heat island
using downscaled MODIS derived land surface temperature data. Geocarto International, 32(8),
900–918.
Ndossi, M. I.,  Avdan, U. (2016a). Application of open source coding technologies in the production of
land surface temperature (LST) maps from Landsat: A PyQGIS plugin. Remote Sensing, 8(5), 413.
Ndossi, M. I.,  Avdan, U. (2016b). Inversion of land surface temperature (LST) using Terra ASTER data:
A comparison of three algorithms. Remote Sensing, 8(12), 993.
Ningrum, W. (2018). Urban heat island towards urban climate. In: IOP Conference Series: Earth and Envi-
ronmental Science , (Vols. 1, 118)
Pan, J. (2016). Area delineation and spatial-temporal dynamics of urban heat island in Lanzhou City, China
using remote sensing imagery. Journal of the Indian Society of Remote Sensing, 44(1), 111–127.
A. Majumder et al.
1 3
Qin, Z., Karnieli, A.,  Berliner, P. (2001). A mono-window algorithm for retrieving land surface tempera-
ture from Landsat TM data and its application to the Israel-Egypt border region. International Journal
of Remote Sensing, 22(18), 3719–3746.
Rinner, C.,  Hussain, M. (2011). Toronto’s urban heat island—Exploring the relationship between land use
and surface temperature. Remote Sensing, 3(6), 1251–1265.
Sekertekin, A.,  Bonafoni, S. (2020). Land surface temperature retrieval from Landsat 5, 7, and 8 over
rural areas: Assessment of different retrieval algorithms and emissivity models and toolbox implemen-
tation. Remote Sensing, 12(2), 294.
Sobrino, J. A., Jiménez-Muñoz, J. C., Sòria, G., Romaguera, M., Guanter, L., Moreno, J., et al. (2008). Land
surface emissivity retrieval from different VNIR and TIR sensors. IEEE Transactions on Geoscience
and Remote Sensing, 46(2), 316–327.
Surawar, M.,  Kotharkar, R. (2017). Assessment of urban heat island through remote sensing in Nagpur
urban area using Landsat 7 ETM+ satellite images. International Journal of Urban and Civil Engi-
neering, 11(7), 868–874.
Tripathi, S.,  Mahey, K. (2017). Urbanization and economic growth in Punjab (India): An empirical analy-
sis. Urban Research  Practice, 10(4), 379–402.
Tsou, J., Zhuang, J., Li, Y.,  Zhang, Y. (2017). Urban heat island assessment using the Landsat 8 data: A
case study in Shenzhen and Hong Kong. Urban Science, 1(1), 10.
Veeran, P.,  Kumar, S. (1993). Analysis of monthly average daily global radiation and monthly average
sunshine duration at two tropical locations. Renewable Energy, 3(8), 935–939.
Wang, S., He, L.,  Hu, W. (2015). A temperature and emissivity separation algorithm for landsat-8 thermal
infrared sensor data. Remote Sensing, 7(8), 9904–9927.
Wang, S., Xiang, M., He, Y., Tsou, J., Zhang, Y., San Liang, X., et al. (2018). Evaluating Urban heat island
effects in rapidly developing coastal cities. In Coastal Environment, Disaster, and Infrastructure-A
Case Study of China’s Coastline: IntechOpen.
Weng, Q., Fu, P.,  Gao, F. (2014). Generating daily land surface temperature at Landsat resolution by fus-
ing Landsat and MODIS data. Remote sensing of environment, 145, 55–67.
Yang, L., Qian, F., Song, D.-X.,  Zheng, K.-J. (2016). Research on urban heat-island effect. Procedia
Engineering, 169, 11–18.
Yang, Q., Huang, X.,  Li, J. (2017). Assessing the relationship between surface urban heat islands and
landscape patterns across climatic zones in China. Scientific reports, 7(1), 1–11.
Yu, X., Guo, X.,  Wu, Z. (2014). Land surface temperature retrieval from Landsat 8 TIRS—comparison
between radiative transfer equation-based method, split window algorithm and single channel method.
Remote Sensing, 6(10), 9829–9852.
Zhang, X., Friedl, M. A., Schaaf, C. B., Strahler, A. H.,  Schneider, A. (2004). The footprint of urban cli-
mates on vegetation phenology. Geophysical Research Letters. https://​doi.​org/​10.​1029/​2004G​L0201​37
Zheng, Y., Ren, H., Guo, J., Ghent, D., Tansey, K., Hu, X., et al. (2019). Land surface temperature retrieval
from sentinel-3A sea and land surface temperature radiometer, using a split-window algorithm. Remote
Sensing, 11(6), 650.
Zhou, D., Zhao, S., Zhang, L., Sun, G.,  Liu, Y. (2015). The footprint of urban heat island effect in China.
Scientific reports, 5(1), 1–11.
Zhou, J., Li, J., Zhang, L., Hu, D.,  Zhan, W. (2012). Intercomparison of methods for estimating land
surface temperature from a Landsat-5 TM image in an arid region with low water vapour in the atmos-
phere. International Journal of Remote Sensing, 33(8), 2582–2602.
Publisher’s Note Springer Nature remains neutral with regard to jurisdictional claims in published maps and
institutional affiliations.

More Related Content

Similar to majumder2021 research paper of atin m.pdf

Development of an Integrated Urban Heat Island Simulation Tool
Development of an Integrated Urban Heat Island Simulation  ToolDevelopment of an Integrated Urban Heat Island Simulation  Tool
Development of an Integrated Urban Heat Island Simulation ToolSryahwa Publications
 
Barren land index to assessment land use land cover changes in himreen lake a...
Barren land index to assessment land use land cover changes in himreen lake a...Barren land index to assessment land use land cover changes in himreen lake a...
Barren land index to assessment land use land cover changes in himreen lake a...Alexander Decker
 
Spatial Patterns of Climate Change in India
Spatial Patterns of Climate Change in IndiaSpatial Patterns of Climate Change in India
Spatial Patterns of Climate Change in Indiakhalid_nitt
 
Temporal Patterns in the Surface Urban Heat Island Effect and Land Cover Chan...
Temporal Patterns in the Surface Urban Heat Island Effect and Land Cover Chan...Temporal Patterns in the Surface Urban Heat Island Effect and Land Cover Chan...
Temporal Patterns in the Surface Urban Heat Island Effect and Land Cover Chan...Bijesh Mishra
 
Forecasting monthly water resources conditions by using different indices
Forecasting monthly water resources conditions by using different indicesForecasting monthly water resources conditions by using different indices
Forecasting monthly water resources conditions by using different indicesAI Publications
 
LAND USE /LAND COVER CLASSIFICATION AND CHANGE DETECTION USING GEOGRAPHICAL I...
LAND USE /LAND COVER CLASSIFICATION AND CHANGE DETECTION USING GEOGRAPHICAL I...LAND USE /LAND COVER CLASSIFICATION AND CHANGE DETECTION USING GEOGRAPHICAL I...
LAND USE /LAND COVER CLASSIFICATION AND CHANGE DETECTION USING GEOGRAPHICAL I...IAEME Publication
 
Assessment of Landsat 8 TIRS data capability for the preliminary study of geo...
Assessment of Landsat 8 TIRS data capability for the preliminary study of geo...Assessment of Landsat 8 TIRS data capability for the preliminary study of geo...
Assessment of Landsat 8 TIRS data capability for the preliminary study of geo...TELKOMNIKA JOURNAL
 
Temperature and Humidity Variability for Surat (coastal) city, India
Temperature and Humidity Variability for Surat (coastal) city, IndiaTemperature and Humidity Variability for Surat (coastal) city, India
Temperature and Humidity Variability for Surat (coastal) city, IndiaUrvi Patel
 
Estimation of Spatial Variability of Land Surface Temperature using Landsat 8...
Estimation of Spatial Variability of Land Surface Temperature using Landsat 8...Estimation of Spatial Variability of Land Surface Temperature using Landsat 8...
Estimation of Spatial Variability of Land Surface Temperature using Landsat 8...theijes
 
Trend analysis of seasonal rainfall and temperature pattern in Kalahandi, Bol...
Trend analysis of seasonal rainfall and temperature pattern in Kalahandi, Bol...Trend analysis of seasonal rainfall and temperature pattern in Kalahandi, Bol...
Trend analysis of seasonal rainfall and temperature pattern in Kalahandi, Bol...DEGU ZEWDU
 
Gaddam et al-2017-journal_of_earth_system_science (1)
Gaddam et al-2017-journal_of_earth_system_science (1)Gaddam et al-2017-journal_of_earth_system_science (1)
Gaddam et al-2017-journal_of_earth_system_science (1)Vinay G
 
IRJET- Mapping Change in Water Spread Area of Himayatsagar using Remote Sensi...
IRJET- Mapping Change in Water Spread Area of Himayatsagar using Remote Sensi...IRJET- Mapping Change in Water Spread Area of Himayatsagar using Remote Sensi...
IRJET- Mapping Change in Water Spread Area of Himayatsagar using Remote Sensi...IRJET Journal
 
LAND USE AND LAND COVER CHANGE ANALYSIS OF KOTLA SUB-WATERSHED OF PUNJAB USIN...
LAND USE AND LAND COVER CHANGE ANALYSIS OF KOTLA SUB-WATERSHED OF PUNJAB USIN...LAND USE AND LAND COVER CHANGE ANALYSIS OF KOTLA SUB-WATERSHED OF PUNJAB USIN...
LAND USE AND LAND COVER CHANGE ANALYSIS OF KOTLA SUB-WATERSHED OF PUNJAB USIN...amritpaldigra30
 
LAND SURFACE TEMPERATURE AND ITS CORRELATION WITH VEGETATION COVER USING LAND...
LAND SURFACE TEMPERATURE AND ITS CORRELATION WITH VEGETATION COVER USING LAND...LAND SURFACE TEMPERATURE AND ITS CORRELATION WITH VEGETATION COVER USING LAND...
LAND SURFACE TEMPERATURE AND ITS CORRELATION WITH VEGETATION COVER USING LAND...IRJET Journal
 
Land Use Land Cover Change Detection of Gulbarga City Using Remote Sensing an...
Land Use Land Cover Change Detection of Gulbarga City Using Remote Sensing an...Land Use Land Cover Change Detection of Gulbarga City Using Remote Sensing an...
Land Use Land Cover Change Detection of Gulbarga City Using Remote Sensing an...ijsrd.com
 
The Relationship between Surface Soil Moisture with Real Evaporation and Pote...
The Relationship between Surface Soil Moisture with Real Evaporation and Pote...The Relationship between Surface Soil Moisture with Real Evaporation and Pote...
The Relationship between Surface Soil Moisture with Real Evaporation and Pote...IJEAB
 
CLIMATE CHANGE AND ITS IMPACT ON GROUNDWATER TABLE FLUCTUATION IN PRECAMBRIAN...
CLIMATE CHANGE AND ITS IMPACT ON GROUNDWATER TABLE FLUCTUATION IN PRECAMBRIAN...CLIMATE CHANGE AND ITS IMPACT ON GROUNDWATER TABLE FLUCTUATION IN PRECAMBRIAN...
CLIMATE CHANGE AND ITS IMPACT ON GROUNDWATER TABLE FLUCTUATION IN PRECAMBRIAN...IAEME Publication
 
The Evaluation of Land Use Evolution and Ecological Sensitivity of Guangzhou ...
The Evaluation of Land Use Evolution and Ecological Sensitivity of Guangzhou ...The Evaluation of Land Use Evolution and Ecological Sensitivity of Guangzhou ...
The Evaluation of Land Use Evolution and Ecological Sensitivity of Guangzhou ...AI Publications
 
Kush Defense
Kush DefenseKush Defense
Kush Defensekbhusal
 

Similar to majumder2021 research paper of atin m.pdf (20)

Development of an Integrated Urban Heat Island Simulation Tool
Development of an Integrated Urban Heat Island Simulation  ToolDevelopment of an Integrated Urban Heat Island Simulation  Tool
Development of an Integrated Urban Heat Island Simulation Tool
 
Barren land index to assessment land use land cover changes in himreen lake a...
Barren land index to assessment land use land cover changes in himreen lake a...Barren land index to assessment land use land cover changes in himreen lake a...
Barren land index to assessment land use land cover changes in himreen lake a...
 
Spatial Patterns of Climate Change in India
Spatial Patterns of Climate Change in IndiaSpatial Patterns of Climate Change in India
Spatial Patterns of Climate Change in India
 
Temporal Patterns in the Surface Urban Heat Island Effect and Land Cover Chan...
Temporal Patterns in the Surface Urban Heat Island Effect and Land Cover Chan...Temporal Patterns in the Surface Urban Heat Island Effect and Land Cover Chan...
Temporal Patterns in the Surface Urban Heat Island Effect and Land Cover Chan...
 
Forecasting monthly water resources conditions by using different indices
Forecasting monthly water resources conditions by using different indicesForecasting monthly water resources conditions by using different indices
Forecasting monthly water resources conditions by using different indices
 
LAND USE /LAND COVER CLASSIFICATION AND CHANGE DETECTION USING GEOGRAPHICAL I...
LAND USE /LAND COVER CLASSIFICATION AND CHANGE DETECTION USING GEOGRAPHICAL I...LAND USE /LAND COVER CLASSIFICATION AND CHANGE DETECTION USING GEOGRAPHICAL I...
LAND USE /LAND COVER CLASSIFICATION AND CHANGE DETECTION USING GEOGRAPHICAL I...
 
Assessment of Landsat 8 TIRS data capability for the preliminary study of geo...
Assessment of Landsat 8 TIRS data capability for the preliminary study of geo...Assessment of Landsat 8 TIRS data capability for the preliminary study of geo...
Assessment of Landsat 8 TIRS data capability for the preliminary study of geo...
 
Temperature and Humidity Variability for Surat (coastal) city, India
Temperature and Humidity Variability for Surat (coastal) city, IndiaTemperature and Humidity Variability for Surat (coastal) city, India
Temperature and Humidity Variability for Surat (coastal) city, India
 
Temp. & Humidity
Temp. & HumidityTemp. & Humidity
Temp. & Humidity
 
Estimation of Spatial Variability of Land Surface Temperature using Landsat 8...
Estimation of Spatial Variability of Land Surface Temperature using Landsat 8...Estimation of Spatial Variability of Land Surface Temperature using Landsat 8...
Estimation of Spatial Variability of Land Surface Temperature using Landsat 8...
 
Trend analysis of seasonal rainfall and temperature pattern in Kalahandi, Bol...
Trend analysis of seasonal rainfall and temperature pattern in Kalahandi, Bol...Trend analysis of seasonal rainfall and temperature pattern in Kalahandi, Bol...
Trend analysis of seasonal rainfall and temperature pattern in Kalahandi, Bol...
 
Gaddam et al-2017-journal_of_earth_system_science (1)
Gaddam et al-2017-journal_of_earth_system_science (1)Gaddam et al-2017-journal_of_earth_system_science (1)
Gaddam et al-2017-journal_of_earth_system_science (1)
 
IRJET- Mapping Change in Water Spread Area of Himayatsagar using Remote Sensi...
IRJET- Mapping Change in Water Spread Area of Himayatsagar using Remote Sensi...IRJET- Mapping Change in Water Spread Area of Himayatsagar using Remote Sensi...
IRJET- Mapping Change in Water Spread Area of Himayatsagar using Remote Sensi...
 
LAND USE AND LAND COVER CHANGE ANALYSIS OF KOTLA SUB-WATERSHED OF PUNJAB USIN...
LAND USE AND LAND COVER CHANGE ANALYSIS OF KOTLA SUB-WATERSHED OF PUNJAB USIN...LAND USE AND LAND COVER CHANGE ANALYSIS OF KOTLA SUB-WATERSHED OF PUNJAB USIN...
LAND USE AND LAND COVER CHANGE ANALYSIS OF KOTLA SUB-WATERSHED OF PUNJAB USIN...
 
LAND SURFACE TEMPERATURE AND ITS CORRELATION WITH VEGETATION COVER USING LAND...
LAND SURFACE TEMPERATURE AND ITS CORRELATION WITH VEGETATION COVER USING LAND...LAND SURFACE TEMPERATURE AND ITS CORRELATION WITH VEGETATION COVER USING LAND...
LAND SURFACE TEMPERATURE AND ITS CORRELATION WITH VEGETATION COVER USING LAND...
 
Land Use Land Cover Change Detection of Gulbarga City Using Remote Sensing an...
Land Use Land Cover Change Detection of Gulbarga City Using Remote Sensing an...Land Use Land Cover Change Detection of Gulbarga City Using Remote Sensing an...
Land Use Land Cover Change Detection of Gulbarga City Using Remote Sensing an...
 
The Relationship between Surface Soil Moisture with Real Evaporation and Pote...
The Relationship between Surface Soil Moisture with Real Evaporation and Pote...The Relationship between Surface Soil Moisture with Real Evaporation and Pote...
The Relationship between Surface Soil Moisture with Real Evaporation and Pote...
 
CLIMATE CHANGE AND ITS IMPACT ON GROUNDWATER TABLE FLUCTUATION IN PRECAMBRIAN...
CLIMATE CHANGE AND ITS IMPACT ON GROUNDWATER TABLE FLUCTUATION IN PRECAMBRIAN...CLIMATE CHANGE AND ITS IMPACT ON GROUNDWATER TABLE FLUCTUATION IN PRECAMBRIAN...
CLIMATE CHANGE AND ITS IMPACT ON GROUNDWATER TABLE FLUCTUATION IN PRECAMBRIAN...
 
The Evaluation of Land Use Evolution and Ecological Sensitivity of Guangzhou ...
The Evaluation of Land Use Evolution and Ecological Sensitivity of Guangzhou ...The Evaluation of Land Use Evolution and Ecological Sensitivity of Guangzhou ...
The Evaluation of Land Use Evolution and Ecological Sensitivity of Guangzhou ...
 
Kush Defense
Kush DefenseKush Defense
Kush Defense
 

Recently uploaded

Just Call Vip call girls Mysore Escorts ☎️9352988975 Two shot with one girl (...
Just Call Vip call girls Mysore Escorts ☎️9352988975 Two shot with one girl (...Just Call Vip call girls Mysore Escorts ☎️9352988975 Two shot with one girl (...
Just Call Vip call girls Mysore Escorts ☎️9352988975 Two shot with one girl (...gajnagarg
 
➥🔝 7737669865 🔝▻ mahisagar Call-girls in Women Seeking Men 🔝mahisagar🔝 Esc...
➥🔝 7737669865 🔝▻ mahisagar Call-girls in Women Seeking Men  🔝mahisagar🔝   Esc...➥🔝 7737669865 🔝▻ mahisagar Call-girls in Women Seeking Men  🔝mahisagar🔝   Esc...
➥🔝 7737669865 🔝▻ mahisagar Call-girls in Women Seeking Men 🔝mahisagar🔝 Esc...amitlee9823
 
Call Girls In Bellandur ☎ 7737669865 🥵 Book Your One night Stand
Call Girls In Bellandur ☎ 7737669865 🥵 Book Your One night StandCall Girls In Bellandur ☎ 7737669865 🥵 Book Your One night Stand
Call Girls In Bellandur ☎ 7737669865 🥵 Book Your One night Standamitlee9823
 
Call Girls In Doddaballapur Road ☎ 7737669865 🥵 Book Your One night Stand
Call Girls In Doddaballapur Road ☎ 7737669865 🥵 Book Your One night StandCall Girls In Doddaballapur Road ☎ 7737669865 🥵 Book Your One night Stand
Call Girls In Doddaballapur Road ☎ 7737669865 🥵 Book Your One night Standamitlee9823
 
Call Girls Bommasandra Just Call 👗 7737669865 👗 Top Class Call Girl Service B...
Call Girls Bommasandra Just Call 👗 7737669865 👗 Top Class Call Girl Service B...Call Girls Bommasandra Just Call 👗 7737669865 👗 Top Class Call Girl Service B...
Call Girls Bommasandra Just Call 👗 7737669865 👗 Top Class Call Girl Service B...amitlee9823
 
Chintamani Call Girls: 🍓 7737669865 🍓 High Profile Model Escorts | Bangalore ...
Chintamani Call Girls: 🍓 7737669865 🍓 High Profile Model Escorts | Bangalore ...Chintamani Call Girls: 🍓 7737669865 🍓 High Profile Model Escorts | Bangalore ...
Chintamani Call Girls: 🍓 7737669865 🍓 High Profile Model Escorts | Bangalore ...amitlee9823
 
Call Girls Hsr Layout Just Call 👗 7737669865 👗 Top Class Call Girl Service Ba...
Call Girls Hsr Layout Just Call 👗 7737669865 👗 Top Class Call Girl Service Ba...Call Girls Hsr Layout Just Call 👗 7737669865 👗 Top Class Call Girl Service Ba...
Call Girls Hsr Layout Just Call 👗 7737669865 👗 Top Class Call Girl Service Ba...amitlee9823
 
Call Girls Indiranagar Just Call 👗 9155563397 👗 Top Class Call Girl Service B...
Call Girls Indiranagar Just Call 👗 9155563397 👗 Top Class Call Girl Service B...Call Girls Indiranagar Just Call 👗 9155563397 👗 Top Class Call Girl Service B...
Call Girls Indiranagar Just Call 👗 9155563397 👗 Top Class Call Girl Service B...only4webmaster01
 
Escorts Service Kumaraswamy Layout ☎ 7737669865☎ Book Your One night Stand (B...
Escorts Service Kumaraswamy Layout ☎ 7737669865☎ Book Your One night Stand (B...Escorts Service Kumaraswamy Layout ☎ 7737669865☎ Book Your One night Stand (B...
Escorts Service Kumaraswamy Layout ☎ 7737669865☎ Book Your One night Stand (B...amitlee9823
 
Just Call Vip call girls Erode Escorts ☎️9352988975 Two shot with one girl (E...
Just Call Vip call girls Erode Escorts ☎️9352988975 Two shot with one girl (E...Just Call Vip call girls Erode Escorts ☎️9352988975 Two shot with one girl (E...
Just Call Vip call girls Erode Escorts ☎️9352988975 Two shot with one girl (E...gajnagarg
 
Call Girls In Shivaji Nagar ☎ 7737669865 🥵 Book Your One night Stand
Call Girls In Shivaji Nagar ☎ 7737669865 🥵 Book Your One night StandCall Girls In Shivaji Nagar ☎ 7737669865 🥵 Book Your One night Stand
Call Girls In Shivaji Nagar ☎ 7737669865 🥵 Book Your One night Standamitlee9823
 
Call Girls In Hsr Layout ☎ 7737669865 🥵 Book Your One night Stand
Call Girls In Hsr Layout ☎ 7737669865 🥵 Book Your One night StandCall Girls In Hsr Layout ☎ 7737669865 🥵 Book Your One night Stand
Call Girls In Hsr Layout ☎ 7737669865 🥵 Book Your One night Standamitlee9823
 
Call Girls In Nandini Layout ☎ 7737669865 🥵 Book Your One night Stand
Call Girls In Nandini Layout ☎ 7737669865 🥵 Book Your One night StandCall Girls In Nandini Layout ☎ 7737669865 🥵 Book Your One night Stand
Call Girls In Nandini Layout ☎ 7737669865 🥵 Book Your One night Standamitlee9823
 
Junnasandra Call Girls: 🍓 7737669865 🍓 High Profile Model Escorts | Bangalore...
Junnasandra Call Girls: 🍓 7737669865 🍓 High Profile Model Escorts | Bangalore...Junnasandra Call Girls: 🍓 7737669865 🍓 High Profile Model Escorts | Bangalore...
Junnasandra Call Girls: 🍓 7737669865 🍓 High Profile Model Escorts | Bangalore...amitlee9823
 
Vip Mumbai Call Girls Marol Naka Call On 9920725232 With Body to body massage...
Vip Mumbai Call Girls Marol Naka Call On 9920725232 With Body to body massage...Vip Mumbai Call Girls Marol Naka Call On 9920725232 With Body to body massage...
Vip Mumbai Call Girls Marol Naka Call On 9920725232 With Body to body massage...amitlee9823
 
5CL-ADBA,5cladba, Chinese supplier, safety is guaranteed
5CL-ADBA,5cladba, Chinese supplier, safety is guaranteed5CL-ADBA,5cladba, Chinese supplier, safety is guaranteed
5CL-ADBA,5cladba, Chinese supplier, safety is guaranteedamy56318795
 
Thane Call Girls 7091864438 Call Girls in Thane Escort service book now -
Thane Call Girls 7091864438 Call Girls in Thane Escort service book now -Thane Call Girls 7091864438 Call Girls in Thane Escort service book now -
Thane Call Girls 7091864438 Call Girls in Thane Escort service book now -Pooja Nehwal
 

Recently uploaded (20)

Just Call Vip call girls Mysore Escorts ☎️9352988975 Two shot with one girl (...
Just Call Vip call girls Mysore Escorts ☎️9352988975 Two shot with one girl (...Just Call Vip call girls Mysore Escorts ☎️9352988975 Two shot with one girl (...
Just Call Vip call girls Mysore Escorts ☎️9352988975 Two shot with one girl (...
 
➥🔝 7737669865 🔝▻ mahisagar Call-girls in Women Seeking Men 🔝mahisagar🔝 Esc...
➥🔝 7737669865 🔝▻ mahisagar Call-girls in Women Seeking Men  🔝mahisagar🔝   Esc...➥🔝 7737669865 🔝▻ mahisagar Call-girls in Women Seeking Men  🔝mahisagar🔝   Esc...
➥🔝 7737669865 🔝▻ mahisagar Call-girls in Women Seeking Men 🔝mahisagar🔝 Esc...
 
Call Girls In Bellandur ☎ 7737669865 🥵 Book Your One night Stand
Call Girls In Bellandur ☎ 7737669865 🥵 Book Your One night StandCall Girls In Bellandur ☎ 7737669865 🥵 Book Your One night Stand
Call Girls In Bellandur ☎ 7737669865 🥵 Book Your One night Stand
 
Call Girls In Shalimar Bagh ( Delhi) 9953330565 Escorts Service
Call Girls In Shalimar Bagh ( Delhi) 9953330565 Escorts ServiceCall Girls In Shalimar Bagh ( Delhi) 9953330565 Escorts Service
Call Girls In Shalimar Bagh ( Delhi) 9953330565 Escorts Service
 
Call Girls In Doddaballapur Road ☎ 7737669865 🥵 Book Your One night Stand
Call Girls In Doddaballapur Road ☎ 7737669865 🥵 Book Your One night StandCall Girls In Doddaballapur Road ☎ 7737669865 🥵 Book Your One night Stand
Call Girls In Doddaballapur Road ☎ 7737669865 🥵 Book Your One night Stand
 
Call Girls Bommasandra Just Call 👗 7737669865 👗 Top Class Call Girl Service B...
Call Girls Bommasandra Just Call 👗 7737669865 👗 Top Class Call Girl Service B...Call Girls Bommasandra Just Call 👗 7737669865 👗 Top Class Call Girl Service B...
Call Girls Bommasandra Just Call 👗 7737669865 👗 Top Class Call Girl Service B...
 
Chintamani Call Girls: 🍓 7737669865 🍓 High Profile Model Escorts | Bangalore ...
Chintamani Call Girls: 🍓 7737669865 🍓 High Profile Model Escorts | Bangalore ...Chintamani Call Girls: 🍓 7737669865 🍓 High Profile Model Escorts | Bangalore ...
Chintamani Call Girls: 🍓 7737669865 🍓 High Profile Model Escorts | Bangalore ...
 
Call Girls Hsr Layout Just Call 👗 7737669865 👗 Top Class Call Girl Service Ba...
Call Girls Hsr Layout Just Call 👗 7737669865 👗 Top Class Call Girl Service Ba...Call Girls Hsr Layout Just Call 👗 7737669865 👗 Top Class Call Girl Service Ba...
Call Girls Hsr Layout Just Call 👗 7737669865 👗 Top Class Call Girl Service Ba...
 
Call Girls Indiranagar Just Call 👗 9155563397 👗 Top Class Call Girl Service B...
Call Girls Indiranagar Just Call 👗 9155563397 👗 Top Class Call Girl Service B...Call Girls Indiranagar Just Call 👗 9155563397 👗 Top Class Call Girl Service B...
Call Girls Indiranagar Just Call 👗 9155563397 👗 Top Class Call Girl Service B...
 
Escorts Service Kumaraswamy Layout ☎ 7737669865☎ Book Your One night Stand (B...
Escorts Service Kumaraswamy Layout ☎ 7737669865☎ Book Your One night Stand (B...Escorts Service Kumaraswamy Layout ☎ 7737669865☎ Book Your One night Stand (B...
Escorts Service Kumaraswamy Layout ☎ 7737669865☎ Book Your One night Stand (B...
 
Just Call Vip call girls Erode Escorts ☎️9352988975 Two shot with one girl (E...
Just Call Vip call girls Erode Escorts ☎️9352988975 Two shot with one girl (E...Just Call Vip call girls Erode Escorts ☎️9352988975 Two shot with one girl (E...
Just Call Vip call girls Erode Escorts ☎️9352988975 Two shot with one girl (E...
 
Call Girls In Shivaji Nagar ☎ 7737669865 🥵 Book Your One night Stand
Call Girls In Shivaji Nagar ☎ 7737669865 🥵 Book Your One night StandCall Girls In Shivaji Nagar ☎ 7737669865 🥵 Book Your One night Stand
Call Girls In Shivaji Nagar ☎ 7737669865 🥵 Book Your One night Stand
 
Call Girls In Hsr Layout ☎ 7737669865 🥵 Book Your One night Stand
Call Girls In Hsr Layout ☎ 7737669865 🥵 Book Your One night StandCall Girls In Hsr Layout ☎ 7737669865 🥵 Book Your One night Stand
Call Girls In Hsr Layout ☎ 7737669865 🥵 Book Your One night Stand
 
Call Girls In Nandini Layout ☎ 7737669865 🥵 Book Your One night Stand
Call Girls In Nandini Layout ☎ 7737669865 🥵 Book Your One night StandCall Girls In Nandini Layout ☎ 7737669865 🥵 Book Your One night Stand
Call Girls In Nandini Layout ☎ 7737669865 🥵 Book Your One night Stand
 
Junnasandra Call Girls: 🍓 7737669865 🍓 High Profile Model Escorts | Bangalore...
Junnasandra Call Girls: 🍓 7737669865 🍓 High Profile Model Escorts | Bangalore...Junnasandra Call Girls: 🍓 7737669865 🍓 High Profile Model Escorts | Bangalore...
Junnasandra Call Girls: 🍓 7737669865 🍓 High Profile Model Escorts | Bangalore...
 
CHEAP Call Girls in Rabindra Nagar (-DELHI )🔝 9953056974🔝(=)/CALL GIRLS SERVICE
CHEAP Call Girls in Rabindra Nagar  (-DELHI )🔝 9953056974🔝(=)/CALL GIRLS SERVICECHEAP Call Girls in Rabindra Nagar  (-DELHI )🔝 9953056974🔝(=)/CALL GIRLS SERVICE
CHEAP Call Girls in Rabindra Nagar (-DELHI )🔝 9953056974🔝(=)/CALL GIRLS SERVICE
 
Vip Mumbai Call Girls Marol Naka Call On 9920725232 With Body to body massage...
Vip Mumbai Call Girls Marol Naka Call On 9920725232 With Body to body massage...Vip Mumbai Call Girls Marol Naka Call On 9920725232 With Body to body massage...
Vip Mumbai Call Girls Marol Naka Call On 9920725232 With Body to body massage...
 
5CL-ADBA,5cladba, Chinese supplier, safety is guaranteed
5CL-ADBA,5cladba, Chinese supplier, safety is guaranteed5CL-ADBA,5cladba, Chinese supplier, safety is guaranteed
5CL-ADBA,5cladba, Chinese supplier, safety is guaranteed
 
Thane Call Girls 7091864438 Call Girls in Thane Escort service book now -
Thane Call Girls 7091864438 Call Girls in Thane Escort service book now -Thane Call Girls 7091864438 Call Girls in Thane Escort service book now -
Thane Call Girls 7091864438 Call Girls in Thane Escort service book now -
 
Abortion pills in Jeddah | +966572737505 | Get Cytotec
Abortion pills in Jeddah | +966572737505 | Get CytotecAbortion pills in Jeddah | +966572737505 | Get Cytotec
Abortion pills in Jeddah | +966572737505 | Get Cytotec
 

majumder2021 research paper of atin m.pdf

  • 1. Vol.:(0123456789) Environment, Development and Sustainability https://doi.org/10.1007/s10668-021-01321-3 1 3 Estimation of land surface temperature using different retrieval methods for studying the spatiotemporal variations of surface urban heat and cold islands in Indian Punjab Atin Majumder1 · Raj Setia2 · P. K. Kingra1 · Harjinder Sembhi3 · Som Pal Singh1 · Brijendra Pateriya2 Received: 16 June 2020 / Accepted: 2 March 2021 © The Author(s), under exclusive licence to Springer Nature B.V. 2021 Abstract Spatial patterns of land surface temperature (LST), surface urban heat island (SUHI), surface urban cold island (SUCI), and their seasonal variations during January (winter) and September (summer) were analyzed over the three cities of Indian Punjab (Balachaur, Ludhiana and Bathinda) using Landsat 5, 7 and 8 satellite data of the years 1991, 2001, 2011, and 2018. Urban hot spots and Urban Thermal Field Variance Index (UTFVI) were used to measure the ecological environment of these cities. Land surface temperature was retrieved from Landsat satellite data using Plank equation, mono-window algorithm (MWA), single-channel algorithm (SCA), and radiative transfer equation. The LST derived using these algorithms was validated with MODIS-LST product. The relationship between LST derived from Landsat 5, 7 and 8 using the four methods and MODIS-LST product was higher with the SCA algorithm (R2 >0.75). Land surface temperature was significantly positively correlated with built-up but significantly negatively correlated with vegeta- tion. The surface urban heat intensity was higher during September than January, and it was higher in Ludhiana followed by Bathinda and Balachaur, irrespective of the season. Besides built-up area and population density, soil moisture availability in surrounding rural areas has significant impact on increasing surface urban heat intensity during September than January. The SUCIs were formed in the center of Bathinda city during January 1991, but these were in Ludhiana and Balachaur cities during January 2011. The most critical areas for ecological environment based on UTFVI were identified and the critical UTFVI values (>0.020) were highest in Bathinda city followed by Balachaur and Ludhiana cities. These results suggest that SUHIs and SUCIs are influenced by seasons and the mitigating plans to counteract the overheating of urban areas should be formulated taking into account soil moisture availability in surrounding rural areas, landscape pattern, seasonal variations, local climatic conditions, urban growth, and development plan etc. * Raj Setia setiark@gmail.com 1 Department of Climate Change and Agricultural Meteorology, Punjab Agricultural University, Ludhiana 141 004, India 2 Punjab Remote Sensing Centre, Ludhiana, India 3 School of Physics and Astronomy, University of Leicester, Leicester, UK
  • 2. A. Majumder et al. 1 3 Keywords Landsat · LST · Urban heat island · Urban cold island · UTFVI 1 Introduction Land surface temperature (LST) is a significant parameter in terrestrial energy exchange process between surface and atmosphere. LST is the temperature of several millimeters (mm) of the Earth’s skin making it a major parameter of surface energy balances which has a significant effect on many biophysical process including evapotranspiration, plant res- piration, and photosynthesis (Kumar et al., 2017). Satellite thermal infrared (TIR) remote sensing has been extensively used since 1990 for the retrieval of LST (Ahmed, 2018; Lak- shmi et al., 2001; Li et al., 2013; Montazeri & Masoodian, 2020). The commonly used thermal imaging sensors on satellite platforms are: advanced Spaceborne Thermal Emis- sion and Reflection Radiometer (ASTER), Moderate-resolution Imaging Spectroradiome- ter (MODIS), and Landsat and the spatial resolution of thermal bands of these satellites are 90 m (Ndossi & Avdan, 2016a, b), 1000 m (A. Li et al., 2019) and 120 m/100 m (resam- pled to 30 m) (Sekertekin & Bonafoni, 2020), respectively. However, Sea and Land Surface Temperature Radiometer (SLSTR) onboard Sentinel-3A carries two thermal bands with spatial resolution of 1000 m (Zheng et al., 2019). There are a number of algorithms to retrieve the LST using at sensor temperature and auxiliary data. These methods are mainly grouped into single-channel method and multi- channel (like split-window algorithms) and multi-angle method. The single-channel method requires only one thermal sensor to retrieve the LST, whereas split-window algo- rithm and multi-angle method require two thermal sensors to estimate the LST. In order to study the temporal changes in LST using Landsat 5 and 7, only single-channel methods can be used, but split-window algorithm can be used for Landsat 8. However, large calibra- tion uncertainty in the band 11 of Landsat 8 limits its use. Sekertekin and Bonafoni (2020) compared mono-window algorithm (MWA), radiative transfer equation (RTE) method, sin- gle-channel algorithm (SCA), and split-window algorithm (SWA) to retrieve LST over the rural areas using Landsat 5, 7 and 8. The Land Surface Emissivity Model of Sorbino et al. (2008) provided the lowest root-mean-square error (RMSE) with RTE and MWA method using Landsat 5 and Landsat 7/8, respectively. Alipour et al. (2003) compared the MWA and SCA method to retrieve the LST of western part of the Iran and they found that MWA algorithm was better than SCA. Similarly, a number of studies have used these algorithms to estimate the LST (Songhan Wang et al., 2015; Yu et al., 2014; Zhou et al., 2012), but there are very few studies in which various single-channel algorithms have been compared to estimate the LST in Indian Punjab. The long-term changes in land use and land cover (LULC) at various scales affect temperature and convective process which brings local rains at many meteorological regions. The major impact of LULC changes on climate is due to urban sprawl which changes natural habitats, biodiversity and alters biogeochemical cycles including hydrological and nutrient cycles (Bentley et al., 2020; Guha et al., 2017). The urban sprawl reduces vegetation and other land cover features and thus contributes to urban heat island (UHI) intensities (Chakraborty et al., 2015). Urban heat island is a phenomenon which refers to temperatures difference between cities and surroundings rural areas (Rinner and Hussain, 2011), and it was first introduced by Howard in 1833, and till now this phenomenon is manifested due to its effect on health, air quality and resource use (Laosuwan & Sangpradit, 2012). Surawar and Kotharkar (2017) studied the effect of changes in LULC on LST and its effect on urban heat island (UHI) formation within the
  • 3. Estimation of land surface temperature using different retrieval… 1 3 Nagpur city (India) using Landsat 7 ETM+. Their results showed that area under built-up increases with decrease in vegetation cover in the study area. The UHI intensity in Nagpur was increased by 0.7 °C from 2000 to 2006; however, a drastic increase was observed with difference of 1.8 °C during the period 2006–2013. Tsou et al. (2017) studied the distribu- tion of LST over Shenzhen and Hong Kong using the Landsat 8 data and also assessed the UHI phenomenon over the study region. Their results showed that LST was significantly negatively correlated with the vegetation. Mathew et al. (2016) found an average annual UHI intensity from 4.98 to 5.43 o K from 2009 to 2013 in Chandigarh (India). de Faria Peres et al. (2018) studied the UHI phenomenon in Metropolitan Area of Rio de Janeiro using LST derived from Landsat 5, 7 and 8. Mukherjee et al. (2017) used the MODIS-LST products (spatial resolution 1000 m) for studying the surface UHI in the major cities of Indian Punjab. Most of these studies are mainly confined to analyze the UHI effect in a sin- gle city (or few cities), but did not study the effect of seasonal variations on surface urban heat intensity. Few studies have shown that climate variations greatly affect the UHI effect across landscapes (Dialesandro et al., 2019; Yang et al., 2017). The Sea and Land Surface Temperature Radiometer (SLSTR) onboard the Sentinel-3 satellite provides the high qual- ity estimates of LST using a split-window algorithm (SWA) which implicitly utilizes the land surface emissivity (LSE). Zheng et al. (2019) modified the conventional split-window algorithm to retrieve LST from Sentinel-3A SLSTR MIR and TIR data, and they found that LST can be estimated with the accuracy better than 1 K. Dar et al (2019) estimated the land surface temperature in the parts of North India using Landsat-7 ETM+, TM, and Terra ASTER satellite data and found that Landsat ETM+data was better than ASTER to capture the temperature variations in the heterogeneous classes (like vegetation and rock exposures), whereas the thermal band of ASTER ­ (B15) was better than Landsat ETM+and TM to capture the temperature changes in the homogeneous classes (like snow and ice). Urban hot spots (UHS) are the areas within the UHI which experience extreme heat stress mainly due to manmade activities (Zhou et al., 2015). Therefore, identification of UHS within a city helps in formulating the mitigation purposes for maintaining the ecolog- ical balance within a city. Besides UHS, a number of thermal comfort indices (like temper- ature-humidity index and physiological equivalent temperature, etc.) have been developed for measuring the effects of UHI intensity but urban thermal field variance index (UTFVI) is directly related with LST, therefore, this index is commonly used for the ecological eval- uation of urban environments (Guha et al., 2017). The thermal comfort level of Raipur city in India was studied by Guha et al. (2017) using the UTFVI and found that outer peripher- ies of the city were ecologically not comfortable. There are very few studies in which ther- mal comfort level in cities of Indian Punjab have been studied. Kingra et al. (2018) found an increase in minimum air temperature of Punjab over a period of 1974–2013 and the population of Punjab has increased sharply after 1970s. The urban areas in Punjab have been increased by 201% from 1971 to 2001 (Tripathi & Mahey, 2017)which may cause an increase in urban heat island. This phenomenon not only affects people psychologically and physiologically, but also increased energy consumption, con- trols behavioral and economical changes, and can enforce to a sudden increase in morbidity and mortality within urban areas (Ningrum, 2018). Few studies have used satellite remote sensing for analyzing the UHI effect in Punjab using MODIS satellite data (Kumar et al., 2017; Mukherjee et al., 2017) but there are very few studies in which the effects of seasons on both urban heat and cold islands, and the thermal comfort level have been studied in the cities of Indian Punjab using Landsat satellite data. The specific objectives of this study were (i) to compare various algorithms to estimate the LST using Landsat 5, 7 and 8, (ii) to identify the surface urban heat and cold islands in three cities located in different climatic
  • 4. A. Majumder et al. 1 3 regions of Indian Punjab based on LST derived from Landsat satellite data over a period of 27 years (1991–2018), (iii) to study the effect of seasons on surface urban heat and cold islands, (iv) to locate the urban hot spots within the UHI and the cold spots within the UCI, and (v) evaluation of ecological environment of the cities using the UTFVI index. 2 Material and methods 2.1 Study area The three cities in Indian Punjab (Bathinda, Balachaur and Ludhiana) were selected on the basis of landscape pattern and climatic conditions, among which Balachaur is in the sub- mountain region, Ludhiana in the semiarid region and Bathinda in the arid region (Fig. 1). The major physiographic unit of Balachaur is upland plain which is surrounded by river and hills. Balachaur has semiarid subtropical climate with hot summers and cold winters. The climate of Ludhiana, an industrial city of Punjab is subtropical subject to southeasterly summer rains. The westerly atmospheric depressions cause winter rains. Ludhiana is situ- ated in the center of the Punjab plain region which is devoid of major topographic features and is conspicuously a flat terrain. The climate of Bathinda is characterized by a sweltering and humid summer followed by dry and cool winter. Bathinda is surrounded by alluvial plain and sand dunes. The population and its density are higher in Ludhiana city followed by Bathinda and Balachaur. The main cropping system around rural areas of each city is paddy (June–October) and wheat (November–April). Fig. 1  Study area
  • 5. Estimation of land surface temperature using different retrieval… 1 3 2.2 Satellite data The Landsat program has provided long-term and consistent thermal infrared data through the Landsat 4–8 satellites which carry on board thermal infrared (TIR) sensors. Landsat 4 and 5 included a single thermal band (band 6) on the Thematic Mapper (TM) sensor with 120 m spatial resolution (resampled to 30 m). Landsat 7 also included the similar band on the Enhanced Thematic Mapper Plus (ETM+) sensor with 60 m spatial resolution (resam- pled to 30 m). Landsat 8 has a separate Thermal Infrared Sensor (TIRS) with two thermal bands (Band 10 and Band 11) and the TIRS bands are acquired at 100 m spatial resolu- tion (resampled to 30 m). The Landsat satellite data of the years 1991, 2001, 2011 and 2018 (January and September) was downloaded from Earth Explorer of the United States Geological Survey (USGS). The following satellite data was used for this study (Table S1, Supporting information): A. Years 1991 and 2011: Landsat-5 TM (Thematic Mapper) B. Year 2001: Landsat-7 ETM+(Enhanced Thematic Mapper Plus) C. Year 2018: Landsat-8 2.3 Extraction of land cover features using spectral indices Remote sensing of vegetation is mainly performed to obtain the electromagnetic wave reflectance information from canopies using passive sensors. It is well known that the reflectance of light spectra from plants changes with plant type, water content within tis- sues, and other intrinsic factors. Indices extracted from this light spectra range can be attributed to a range of characteristics beyond growth and vigor quantification of plants related to water content, pigments, sugar and carbohydrate content, protein content, and aromatics among others (Foley et al., 1998). The Landsat downloaded images were terrain corrected with projection system of UTM-WGS 84. The digital numbers of these Landsat images were converted to radiance (radiometric correction) followed by surface reflectance to eliminate the effect of atmospheric and illumination factors on the radiance values. The surface reflectance of each band was used for extracting the land cover features using the following spectral indices: (a) Normalized Difference Vegetation Index (NDVI) for extracting vegetation=(NIR-R)/ (NIR+R) (b) Normalized Difference Built-up Index (NDBI) for extracting built-up features=(NIR – SWIR)/(NIR+SWIR) (c) Modified Normalized Difference Water Index (MNDWI) for extracting water fea- tures=(Green – MIR)/(Green+MIR) (d) Normalized Difference Bareness Index (NDBaI) for extracting bare soil =(SWIR – TIR)/(SWIR+TIR) 2.4 Retrieval of LST from Landsat‑5, Landsat‑7, and Landsat‑8 Thermal sensors detect emitted radiant energy. Due to atmospheric effects, these sensors usually operate in the 3–5 μm or 8–14 μm. Most thermal remote sensing of earth features lies in the range between 8 and 14 μm range because peak emission (based on Wien’s Law) for objects around 300°K occurs at 9.7 μm. The radiometric corrections were performed
  • 6. A. Majumder et al. 1 3 to convert the digital numbers to Top-of-Atmosphere (TOA) spectral radiance followed by brightness temperature using the equations given in Majumder et al. (2020). However, for Landsat 8, the digital numbers were converted to TOA radiance using band specific mul- tiplicative rescaling factor, band-specific additive rescaling factor and offsets values. For Landsat 5 and 7, gain and bias method was used to convert digital numbers to TOA radi- ance. After conversion of digital numbers to TOA radiance for thermal sensors of Landsat 5, 7 and 8, brightness temperature was calculated from TOA radiance. Brightness tem- perature is the temperature of a blackbody in thermal equilibrium with its surroundings. Though brightness temperature is used for temperature measurement, but it has no physical meaning. The real temperature of a surface is calculated by dividing the brightness tem- perature by emissivity. The emissivity (ϵ) at a wavelength is defined as the ratio of radiance emitted by a body at temperature T and the radiance emitted by a black body at the same temperature T. Emissivity is affected by surface and wavelength. There are various meth- ods to calculate the LSE, but we used the NDVI-based emissivity method of Sobrino et al. (2008) to calculate the LSE. The LSE is 0.995 for NDVI less than − 0.185, 0.985 for NDVI values between − 0.185 and 0.157, 1.009+0.047 × ln (NDVI) for NDVI values between 0.157 and 0.727 and 0.990 for NDVI values more than 0.727. Once radiance, brightness temperature, and LSE are known, then brightness temperature is corrected against LSE and atmospheric parameters. There are many algorithms to estimate LST from Landsat data, but we used the four LST algorithms in this study: Plank`s equation (PE), mono-window algorithm (MWA), radiative transfer equation (RTE), and single-channel algorithm (SCA). The methodology to retrieve the LST using Plank`s equation is given in Majumder et al. (2020). The details of MWA (Qin et al., 2001), SCA and RTE method have been given in Sekertekin and Bonafoni (2020) and Ndossi and Avdan (2016a, b). The major difference among these methods is the atmospheric correction process. In the Plank equation, LSE is corrected using wavelength of the emitted radiance, brightness temperature (at sensor) and plank constant. The MWA requires the knowledge effective mean atmospheric tempera- ture, and atmospheric transmittance (two atmospheric parameters) besides LSE to estimate the LST. For RTE method, the input parameters required to estimate the LST are upwelling (or atmospheric path) radiance, down-welling (or sky) radiance, atmospheric transmittance (three atmospheric parameters) besides radiance of the black body target of kinetic temper- ature. The three atmospheric parameters in RTE method are calculated from atmospheric profile using a radiative transfer model (Ndossi Avdan, 2016a, b). The SCA method requires the total atmospheric water vapor content, channel effective wavelength and LSE to estimate the LST. In order to compare the four methods, LST was estimated using cloud cleared (less than 10%) level 1 product of Landsat 5 (September 2011), Landsat 7 (Sep- tember 2001) and Landsat 8 (September 2018). A brief overview of the calculation of LST from these methods is given in Fig. S1 (Supporting information). 2.5 Intercomparison of Landsat derived LST with MODIS‑LST data The ground measurements of LST were not taken so MODIS-LST products of September 2001, 2011 and 2018 were used in this study as a reference image for comparison of the LST derived from Landsat. The LST retrieved from Landsat 5, 7 and 8 using PE, MWA, RTE and SCA methods was validated with the MODIS data. The random points (n=100) of MODIS-LST product of each year were generated and the values corresponding to these points were extracted from the LST estimated from Landsat 5, 7 and 8 using the four
  • 7. Estimation of land surface temperature using different retrieval… 1 3 methods. The relationship between LST derived using Landsat and MODIS data was stud- ied using linear regression and Residual Mean Square Error (RMSE). 2.6 Mapping of Surface Urban Heat Island (SUHI) and Surface Urban Cold Island (SCHI) The surface urban heat and cold islands were calculated using the following equation: A buffer area of 10 km around the boundary of main city was created to calculate the LST of rural areas in different years. We also used the above equation to calculate the surface urban heat and cold intensity. 2.7 Delineation of Urban Hot Spot (UHS) The LST maps of all the years (January and September) were used to study the UHS in the three cities. The following equation was used to measure the UHS: μ is the mean temperature and δ is the standard deviation of the image. 2.8 Urban Thermal Field Variance Index (UTFVI) Urban Thermal Field Variance Index (UTFVI) has been used for the ecological evaluation of temperature distribution and its impacts on the quality of urban life (Guha et al., 2017; Wang et al., 2018). The following equation was used to calculate the UTFVI: Where Ts is the LST (°C) of the imagery. Tmean is the mean LST (°C) of the imagery. The UTFVI was calculated for September 2018 which is hot and humid, and it greatly affects human comfort. 3 Results and discussion 3.1 Comparison of retrieval methods to estimate the LST in the three cities of Punjab The relationship between LST estimated using PE, MWA, RTE, and SCA methods, and MODIS–LST product showed that the coefficient of determination (R2 ) was in the order: SCARTEMWAPlank and the RMSE was in the order: SCAPlankMWARTE (Table 1), therefore SCA algorithm was used to retrieve LST for all the cities during dif- ferent years. García-Santos (2018) found that SCA method was better than RTE method to estimate LST because RTE method requires the information about atmospheric profile at the time of satellite pass. Masek et al. (2006) and Weng et al (2014) found that there was a positive correlation between MODIS and Landsat derived LST. SUHI/SUCI = (LST) Urban - (LST) Rural LST 𝜇 + 2 ∗ 𝛿 UTFVI = (Ts − Tmean)∕Tmean
  • 8. A. Majumder et al. 1 3 3.2 Spatiotemporal pattern of land use and land cover The spatial pattern of built-up in Balachaur city over 27 years indicated that the built-up expansion was mainly in Northwest of Balachaur city between 1991 and 2001, however it was in Northwest and South directions between 2001 and 2018 (Fig. S2, Supporting information). In Ludhiana city, the expansion of built-up was in the directions where vegetation was available and the built-up growth was higher in the outer parts compared with the inner part of Ludhiana city. Between the year 2001 and 2018, built-up has been mainly expanded in the north of Bathinda (Fig. S2, Supporting information). These results suggest that there is need for policy shifting from horizontal expansion of these cities to vertical expansion to accommodate population growth in a sustainable manner. Moreover, the horizontal expansion of cities has significant impact on environment and population health (Pan, 2016). 3.3 Spatiotemporal variations in surface temperature of built‑up, vegetation, water and bare soil The temporal variations in surface temperature of impervious surfaces were variable over 27 years in Bathinda, Ludhiana and Balachaur cities (Table 2). The surface temperature of built-up was increased over the years in these three cities. The degree of increase of surface temperature was highest from the year 1991 to 2001, but there was a decrease in tempera- ture from 2001 to 2011 followed by increase in 2018. During the year 2011, the average cloud cover was higher (approximately 16%) compared with the other years due to which the incoming solar radiation was lesser and a high pressure along with low wind speed (less than 2 km per hour) created the stable atmospheric condition which reduced the free advection and convection of the heat. The increase in temperature over the years was more in inner parts of the city than the outskirts of the city. It was higher by 3–4 °C in Bathinda city, 4–5 °C in Ludhiana city and 2–3 °C in Balachaur city from 1991 to 2001. This was related with the changes in LULC which were higher from 1991 to 2001. The surface tem- perature is influenced by properties of urban materials (including materials used for roofs, paving and coating and painting) which affect solar reflectance, thermal emissivity, and heat capacity (Akbari et al., 2012). In general, evapotranspiration from urban materials does not take place because these are water resistant. Furthermore, urban surfaces absorb and retain more of the sun’s heat than natural vegetation which causes increase in tempera- ture of the urban areas. Table 1  Results of the statistical test for the relationship between LST estimated from Landsat satellite data using various algorithms and MODIS-LST product LST algorithm Landsat 5 (September 2011) Landsat 7 (September 2001) Landsat 8 (Septem- ber 2018) R2 RMSE R2 RMSE R2 RMSE Mono-window algorithm 0.58 3.25 0.59 3.25 0.61 2.88 Plank`s equation 0.60 3.13 0.62 2.99 0.63 2.80 Radiative transfer equation 0.65 3.38 0.74 3.35 0.67 2.92 Single-channel algorithm 0.75 2.25 0.79 2.32 0.82 2.00
  • 9. Estimation of land surface temperature using different retrieval… 1 3 Similar the case of built-up regions, there was an increase in temperature of vegeta- tion from 1991 to 2001 followed by decrease in temperature from 2001 to 2011 and again increase in 2011 (Table 2). There was an effect of urban climate on increasing the temperature of vegetation growing in the cities. Zhang et al (2004) also found that the effect of urban footprints on increasing the temperature of vegetation growing in the cit- ies is more than and decreases gradually towards rural areas. The spatial and temporal changes in temperature of water bodies were similar to built-up and vegetation. The water bodies around the built-up features significantly affected the temperature of urban properties. For example, surface temperature was low- ered by 1–2 °C in January 2018 and 2–3 °C in September 2018 in the urban proper- ties surrounded by water bodies than the urban areas not surrounded by water bodies in Ludhiana city (Table 2). These results suggest that there is positive impact of water bodies on microclimate of the surrounding regions. Water bodies are the best radiation absorbers, but they provide a very small thermal response (Kumar et al., 2017). The sensible heat of the air and the surrounding areas are absorbed to be used as latent heat necessary to evaporate water. The amount of heat absorbed depends on the amount of water that can be evaporated so the areas near to the water body remain cooler (Zhou et al., 2012). The spatiotemporal variations of surface temperature in Balachaur city over 25 years indicated that temperature was increased between 1991 and 2018 mainly in northeast and center of the city (Fig. S4, Supporting information). The outer parts of Ludhiana city had higher temperature than the inner parts during January 2011, but there was an increase in temperature in all the directions during January 2018 due to expansion of built-up area in all the directions of the Ludhiana. (Fig. S5, Supporting information). There was an increase in temperature from 1991 to 2001 in northern part of Bathinda city (Fig. S6, Sup- porting information). However, temperature increased in northwestern direction between Table 2  Temporal changes in LST (o C) of different land cover features in Balachaur Ludhiana and Bathinda cities of Indian Punjab during January and September of the years 1991, 2001, 2011 and 2018 Year Built-up Bare soil Vegetation Water body January September January September January September January September Balachaur City 1991 16.4 28.6 17.2 28.9 13.2 25.8 14.0 27.1 2001 16.9 30.6 21.3 31.3 16.9 29.0 18.8 27.9 2011 17.2 29.1 18.3 28.7 17.5 28.5 16.4 29.2 2018 22.4 31.8 23.3 32.4 20.7 28.0 21.1 31.1 Ludhiana City 1991 16.2 29.4 17.8 29.3 13.1 25.5 15.2 28.1 2001 20.3 29.7 22.6 29.2 16.1 25.7 19.0 27.0 2011 16.1 29.8 16.8 29.7 15.1 29.3 15.7 28.9 2018 22.4 32.4 23.8 30.9 18.8 28.2 22.4 32.5 Bathinda City 1991 19.4 31.0 20.2 32.6 18.6 28.2 15.9 28.5 2001 21.6 32.3 22.4 26.2 15.4 26.9 19.9 30.9 2011 17.8 31.3 18.7 31.4 16.6 26.5 15.8 28.6 2018 23.1 34.0 25.4 35.3 20.2 28.2 20.3 30.3
  • 10. A. Majumder et al. 1 3 September 2001 and 2011, but it increased in the western and southern part of the city between 2011 and 2018. These results suggest that the effect of land surface characteristics on surface tempera- ture was variable: positive effects by vegetation and water, but negative effects by built-up and bare soil. The development of the cities has increased surface temperature over the years but the increase was higher in the inner part of the cities than the outskirts. 3.4 Spatiotemporal pattern of urban heat island and urban cold island In Balachaur, the urban areas had 0.75, 1.45, and 1.90 °C higher temperatures compared with their rural areas during 1991, 2001, and 2018, respectively (Table 3). The surface temperature of urban areas in Ludhiana was 1.40, 1.65, and 3.41 °C higher than rural areas during 1991, 2001, and 2018, respectively (Table 3). On an average, the urban areas in Bathinda had 2.10, 1.30 and 3.25 °C higher temperatures compared with their rural areas during 2001, 2011 and 2018, respectively (Table 3). This pattern was expected because of extending the areas of municipal limits in these three cities by policy makers and the changes in policies caused conversion of vegetation and other features to impervious sur- faces (like industry and residential buildings). The cold islands were formed in Balachaur and Ludhiana during January 2011 and in Bathinda during January 1991 (Table 3). This was mainly due to lowering of minimum air temperature during this period. During night time of these years, excessive radiational cooling made the built-up surface colder than the air above it. So at next morning, daytime inversion occurred when it came in contact with that warmer air parcel. This phenomenon is also called advection inversion, where the lower atmosphere was colder than the upper one (Haeger-Eugensson and Holmer 1999). Table 3  Temporal changes in surface urban heat and cold intensity (o C) in Balachaur Ludhiana and Bathinda cities of Indian Punjab during January and September of the years 1991, 2001, 2011 and 2018 Year January September Surface urban heat intensity Surface urban cold intensity Surface Urban heat intensity Surface urban cold intensity Balachaur City 1991 0.30 – 1.20 – 2001 1.10 – 1.80 – 2011 – – 0.60 0.90 – 2018 1.80 – 2.00 – Ludhiana City 1991 0.80 – 2.00 – 2001 1.40 – 1.90 – 2011 – – 0.40 1.70 – 2018 2.12 – 4.70 – Bathinda City 1991 – – 0.30 1.80 – 2001 1.80 – 2.40 – 2011 0.50 – 2.10 – 2018 3.10 – 3.40 –
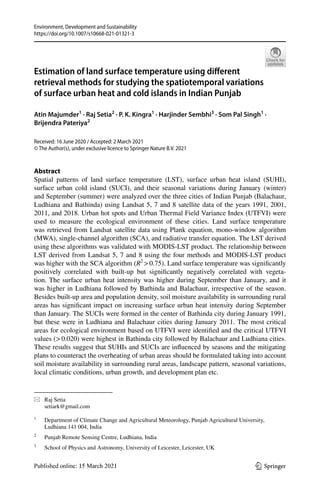
  • 11. Estimation of land surface temperature using different retrieval… 1 3 The UHI effect in Bathinda, Ludhiana and Balachaur city showed (Figs. 2, 3, 4) that the spatial pattern of UHI was related with the location of land cover change which was mainly related with urban development. The UHS was highest in Balachaur city (3.70% Fig. 2  Spatiotemporal pattern of UHI/UCI in the Balachaur city of Indian Punjab during January and Sep- tember of the years 1991, 2001, 2011 and 2018
  • 12. A. Majumder et al. 1 3 of total city area) during January and highest in Ludhiana city (5.96% of total city area) followed by Bathinda city (3.80% of total city area) during September (Table 4). The UHS effect was more concentrated in Northwestern and Southern-east parts of the Ludhiana and Fig. 3  Spatiotemporal pattern of UHI/UCI in the Ludhiana city of Indian Punjab during January and Sep- tember of the years 1991, 2001, 2011 and 2018
  • 13. Estimation of land surface temperature using different retrieval… 1 3 Fig. 4  Spatiotemporal pattern of UHI/UCI in the Bathinda city of Indian Punjab during January and September of the years 1991, 2001, 2011 and 2018
  • 14. A. Majumder et al. 1 3 Bathinda cities during January but at the center of the Balachaur city during September (Figs. 5, 6, 7). The surface urban heat intensity was higher during September than January from 1991 to 2018. This was mainly due to availability of sunshine hours and soil moisture during January and September. The day length or maximum possible sunshine hours are more during September than January, therefore insulation is more during September than Janu- ary to heat up the earth surface (Veeran Kumar, 1993). Since paddy is grown in sur- rounding rural areas during September, therefore soil moisture availability is higher during September than January. Higher soil moisture coupled with higher air temperature results in higher evapotranspiration which causes cooling of surrounding rural areas (Kumar et al., 2017; Yang et al., 2017), therefore the difference in temperature between urban and sur- rounding rural areas is higher during September, The surface urban heat intensity was in the order: LudhianaBathindaBalachaur and this was mainly related with built-up area and population in these cities. The SUCI was formed in Bathinda city during January 1991 only, but it was formed in Ludhiana and Balachaur during January 2011. The surrounding rural areas of Balachaur city were warmer by 0.60 °C than the urban area during January 2011 (Fig. 2). The urban areas of Ludhiana city were colder by 0.40 °C during January 2011 than the surrounding rural areas (Fig. 3). The surrounding rural areas were warmer by 0.30 °C than the urban area of Bathinda city during January 2011 (Fig. 4). The reason for this phenomenon was not clear, but might be related to lowering of minimum air temperature in these particular months during winter. The lowering of minimum air temperature in Bathinda during January of the year 1991 but in Ludhiana and Balachaur during 2011 resulted in the use of higher heating equipment for heat- ing which may decrease incoming short wave solar radiation in the urban areas compared with surrounded rural areas (Zhou et al., 2015), and due to excessive radiational cooling at night, also the concrete area of the main city radiates more radiation and become colder than the Table 4  Temporal changes in areas under urban hot spots (UHS) in Balachaur, Ludhiana, and Bathinda cities of Indian Punjab during January and September of the years 1991, 2001, 2011 and 2018 Year Percent area (%) UHS (January) UHS (Septem- ber) Balachaur City 1991 3.70 1.48 2001 2.58 1.40 2011 1.86 0.84 2018 2.10 1.98 Ludhiana City 1991 1.94 5.96 2001 0.13 2.30 2011 2.36 5.53 2018 2.96 2.23 Bathinda City 1991 0.89 2.69 2001 1.87 2.26 2011 1.53 3.80 2018 2.81 0.85
  • 15. Estimation of land surface temperature using different retrieval… 1 3 Fig. 5  Spatiotemporal pattern of UHS in the Balachaur city of Indian Punjab during January and September of the years 1991, 2001, 2011 and 2018
  • 16. A. Majumder et al. 1 3 Fig. 6  Spatiotemporal pattern of UHS in the Ludhiana city of Indian Punjab during January and September of the years 1991, 2001, 2011 and 2018
  • 17. Estimation of land surface temperature using different retrieval… 1 3 Fig. 7  Spatiotemporal pattern of UHS in the Bathinda city of Indian Punjab during January and September of the years 1991, 2001, 2011 and 2018
  • 18. A. Majumder et al. 1 3 surrounding area. This might have resulted in artificially reducing urban temperature and even resulted in the cold island effect. 3.5 Ecological evaluation of Balachaur, Ludhiana and Bathinda cities using UTFVI The UTFVI values during September 2018 were divided into six categories. The three cit- ies have the extreme categories: excellent (UTFVI0) and worst (UTFVI0.020). The area under excellent thermal condition was 52.3% in Balachaur city, 52.6% in Ludhiana city and 46.3% in Bathinda city (Table 5). The normal thermal conditions were 0.32% of the total area in Balachaur city, 0.26% of the total area in Ludhiana city and 0.18% of the total area in Bathinda city. The area under UTFVI0.020 (worst thermal condition) was highest in Bathinda (53.0% area) followed by Balachaur (46.8%) and Ludhiana (46.3%) during Septem- ber 2018. The excellent thermal conditions were in the periphery region of Balachaur city, central and western portion in Ludhiana city and northeastern, northwestern, and southern direction in Bathinda city, but the worst thermal conditions were mainly in center portion of the Balachaur city, periphery region in Ludhiana city and middle part of the Bathinda city (Fig. 8). Table 5  Area under different classes of UTFVI in Balachaur, Ludhiana and Bathinda cities of Indian Punjab during January and September of the years 1991, 2001, 2011 and 2018 UTFVI Percent area (%) Balachaur City 0 52.3 0–0.005 0.32 0.005–0.010 0.14 0.010–0.015 0.20 0.015–0.020 0.26 0.020 46.8 Ludhiana City 0 52.6 0–0.005 0.26 0.005–0.010 0.25 0.010–0.015 0.26 0.015–0.020 0.26 0.020 46.3 Bathinda City 0 46.3 0–0.005 0.18 0.005–0.010 0.15 0.010–0.015 0.15 0.015–0.020 0.15 0.020 53.0
  • 19. Estimation of land surface temperature using different retrieval… 1 3 Fig. 8  Spatial pattern of UTFVI in Balachaur, Ludhiana and Bathinda cities of Indian Punjab during September 2018
  • 20. A. Majumder et al. 1 3 4 Conclusions The results of this study showed that single-channel algorithm was better over Plank equa- tion, mono-window algorithm, and radiative transfer equation to estimate the LST from Landsat satellite images in Indian Punjab. This study has shown the effect of changes in LULC and seasons on LST and the formation of urban heat/cold islands in the three cit- ies of Indian Punjab in different climatic regions (Balachaur in sub-humid, Ludhiana in semiarid and Bathinda in arid region). The urban sprawl increased the surface temperature of built-up, bare soil, vegetation and water bodies over the years. However, an increase in built-up area followed by soil moisture availability in surrounding rural area and air tem- perature are the main causes of UHIs and UCIs which may have different consequences on human and environment. The surface urban heat intensity was higher during Septem- ber than January from 1991 to 2018. The effect of increasing urban heat intensity over the years was higher in Ludhiana followed by Bathinda and Balachaur. The surface cold intensity was concentrated in the center of city during January 1991 in Bathinda city and during January 2011 in Ludhiana and Balachaur cities. More than 30% areas in Balachaur, Ludhiana and Bathinda have worst thermal conditions and it may affect the heat related mortality. The accuracy of LST retrieval methods is significantly affected by land surface emissivity (LSE). In this study, one NDVI-based LSE model was used but further stud- ies are required to study the impact of different NDVI-based LSE models on the accuracy of LST derived from satellite data. The ground measurements of LST are also required to select the best method for retrieving LST from satellite images. These result suggest that increased temperature due to increased UHI will significantly influenced the urban cli- mates, urban hydrological situations, biological habits, material cycles, energy metabolism and population health (Yang et al., 2016). The mitigation measures include controlling an increase in built-up area, better planning of built-up area and increasing the area under blue and green to maintain a balance among social, ecological and economical factors. There should be policy on the use of building materials with lower absorptivity, higher reflectiv- ity, and larger thermal conductivity, and the top floor of high buildings should use the cool paint and roof ventilation. The day time surface urban heat/cold intensity is not only con- trolled by population density and built-up area but also by soil moisture availability in sur- rounding rural areas. In order to tackle the negative effect of urban sprawl and making the excellent thermal conditions in these cities, smart growth policies are required to mitigate the UHI effect. Supplementary Information The online version contains supplementary material available at https://​doi.​ org/​10.​1007/​s10668-​021-​01321-3. References Ahmed, S. (2018). Assessment of urban heat islands and impact of climate change on socioeconomic over Suez Governorate using remote sensing and GIS techniques. The Egyptian Journal of Remote Sensing and Space Science, 21(1), 15–25. Akbari, H., Matthews, H. D., Seto, D. (2012). The long-term effect of increasing the albedo of urban areas. Environmental Research Letters, 7(2), 024004. Alipour, T., Sarajian, M., Esmaeily, A. (2003). Land surface temperature estimation from thermal band of landsat sensor, case study: Alashtar city. The International Achieves of the Photogrammetry, Remote Sensing and Spatial Information Sciences, 38(4), 1–6.
  • 21. Estimation of land surface temperature using different retrieval… 1 3 Bentley, M. L., Sae-Jung, J., Kaminski, S., Kesavawong, P. (2020). Documenting the evolution and expansion of surface urban heat in the Bangkok Metropolitan Region, 2000–2019. Asian Geographer, 37(2), 171–188. Chakraborty, S. D., Kant, Y., Mitra, D. (2015). Assessment of land surface temperature and heat fluxes over Delhi using remote sensing data. Journal of environmental management, 148, 143–152. Dar, I., Qadir, J., Shukla, A. (2019). Estimation of LST from multi-sensor thermal remote sensing data and evaluating the influence of sensor characteristics. Annals of GIS, 25(3), 263–281. de Faria Peres, L., de Lucena, A. J., RotunnoFilho, O. C., de Almeida França, J. R. (2018). The urban heat island in Rio de Janeiro, Brazil, in the last 30 years using remote sensing data. International Jour- nal of Applied Earth Observation and Geoinformation, 64, 104–116. Dialesandro, J. M., Wheeler, S. M., Abunnasr, Y. (2019). Urban heat island behaviors in dryland regions. Environmental Research Communications, 1(8), 081005. Foley, W. J., McIlwee, A., Lawler, I., Aragones, L., Woolnough, A. P., Berding, N. (1998). Ecologi- cal applications of near infrared reflectance spectroscopy–a tool for rapid, cost-effective prediction of the composition of plant and animal tissues and aspects of animal performance. Oecologia, 116(3), 293–305. García-Santos, V., Cuxart, J., Martínez-Villagrasa, D., Jiménez, M. A., Simó, G. (2018). Comparison of three methods for estimating land surface temperature from landsat 8-tirs sensor data. Remote Sensing, 10(9), 1450. Guha, S., Govil, H., Mukherjee, S. (2017). Dynamic analysis and ecological evaluation of urban heat islands in Raipur city India. Journal of Applied Remote Sensing, 11(3), 036020. Haeger-Eugensson, M., Holmer, B. (1999). Advection caused by the urban heat island circulation as a regulating factor on the nocturnal urban heat island. International Journal of Climatology: A Journal of the Royal Meteorological Society, 19(9), 975–988. Kingra, P., Setia, R., Kaur, J., Singh, S., Singh, S. P., Kukal, S., et al. (2018). Assessing the impact of cli- mate variations on wheat yield in north-west India using GIS. Spatial Information Research, 26(3), 281–294. Kumar, R., Mishra, V., Buzan, J., Kumar, R., Shindell, D., Huber, M. (2017). Dominant control of agri- culture and irrigation on urban heat island in India. Scientific reports, 7(1), 1–10. Lakshmi, V., Czajkowski, K., Dubayah, R., Susskind, J. (2001). Land surface air temperature mapping using TOVS and AVHRR. International Journal of Remote Sensing, 22(4), 643–662. Laosuwan, T., Sangpradit, S. (2012). Urban heat island monitoring and analysis by using integration of satellite data and knowledge based method. International Journal of Development and Sustainability, 1(2), 99–110. Li, A., Xia, C., Bao, C., Yin, G. (2019). Using MODIS land surface temperatures for permafrost thermal modeling in beiluhe basin on the Qinghai-Tibet Plateau. Sensors, 19(19), 4200. Li, Z.-L., Tang, B.-H., Wu, H., Ren, H., Yan, G., Wan, Z., et al. (2013). Satellite-derived land surface tem- perature: Current status and perspectives. Remote sensing of environment, 131, 14–37. Majumder, A., Kingra, P., Setia, R., Singh, S. P., Pateriya, B. (2020). Influence of land use/land cover changes on surface temperature and its effect on crop yield in different agro-climatic regions of Indian Punjab. Geocarto International, 35(6), 663–686. Masek, J. G., Vermote, E. F., Saleous, N. E., Wolfe, R., Hall, F. G., Huemmrich, K. F., et al. (2006). A Landsat surface reflectance dataset for North America, 1990–2000. IEEE Geoscience and Remote Sensing Letters, 3(1), 68–72. Mathew, A., Khandelwal, S., Kaul, N. (2016). Spatial and temporal variations of urban heat island effect and the effect of percentage impervious surface area and elevation on land surface temperature: Study of Chandigarh city, India. Sustainable Cities and Society, 26, 264–277. Montazeri, M., Masoodian, S. A. (2020). Tempo-spatial behavior of surface urban heat island of Isfahan Metropolitan Area. Journal of the Indian Society of Remote Sensing, 48(2), 263–270. Mukherjee, S., Joshi, P., Garg, R. (2017). Analysis of urban built-up areas and surface urban heat island using downscaled MODIS derived land surface temperature data. Geocarto International, 32(8), 900–918. Ndossi, M. I., Avdan, U. (2016a). Application of open source coding technologies in the production of land surface temperature (LST) maps from Landsat: A PyQGIS plugin. Remote Sensing, 8(5), 413. Ndossi, M. I., Avdan, U. (2016b). Inversion of land surface temperature (LST) using Terra ASTER data: A comparison of three algorithms. Remote Sensing, 8(12), 993. Ningrum, W. (2018). Urban heat island towards urban climate. In: IOP Conference Series: Earth and Envi- ronmental Science , (Vols. 1, 118) Pan, J. (2016). Area delineation and spatial-temporal dynamics of urban heat island in Lanzhou City, China using remote sensing imagery. Journal of the Indian Society of Remote Sensing, 44(1), 111–127.
  • 22. A. Majumder et al. 1 3 Qin, Z., Karnieli, A., Berliner, P. (2001). A mono-window algorithm for retrieving land surface tempera- ture from Landsat TM data and its application to the Israel-Egypt border region. International Journal of Remote Sensing, 22(18), 3719–3746. Rinner, C., Hussain, M. (2011). Toronto’s urban heat island—Exploring the relationship between land use and surface temperature. Remote Sensing, 3(6), 1251–1265. Sekertekin, A., Bonafoni, S. (2020). Land surface temperature retrieval from Landsat 5, 7, and 8 over rural areas: Assessment of different retrieval algorithms and emissivity models and toolbox implemen- tation. Remote Sensing, 12(2), 294. Sobrino, J. A., Jiménez-Muñoz, J. C., Sòria, G., Romaguera, M., Guanter, L., Moreno, J., et al. (2008). Land surface emissivity retrieval from different VNIR and TIR sensors. IEEE Transactions on Geoscience and Remote Sensing, 46(2), 316–327. Surawar, M., Kotharkar, R. (2017). Assessment of urban heat island through remote sensing in Nagpur urban area using Landsat 7 ETM+ satellite images. International Journal of Urban and Civil Engi- neering, 11(7), 868–874. Tripathi, S., Mahey, K. (2017). Urbanization and economic growth in Punjab (India): An empirical analy- sis. Urban Research Practice, 10(4), 379–402. Tsou, J., Zhuang, J., Li, Y., Zhang, Y. (2017). Urban heat island assessment using the Landsat 8 data: A case study in Shenzhen and Hong Kong. Urban Science, 1(1), 10. Veeran, P., Kumar, S. (1993). Analysis of monthly average daily global radiation and monthly average sunshine duration at two tropical locations. Renewable Energy, 3(8), 935–939. Wang, S., He, L., Hu, W. (2015). A temperature and emissivity separation algorithm for landsat-8 thermal infrared sensor data. Remote Sensing, 7(8), 9904–9927. Wang, S., Xiang, M., He, Y., Tsou, J., Zhang, Y., San Liang, X., et al. (2018). Evaluating Urban heat island effects in rapidly developing coastal cities. In Coastal Environment, Disaster, and Infrastructure-A Case Study of China’s Coastline: IntechOpen. Weng, Q., Fu, P., Gao, F. (2014). Generating daily land surface temperature at Landsat resolution by fus- ing Landsat and MODIS data. Remote sensing of environment, 145, 55–67. Yang, L., Qian, F., Song, D.-X., Zheng, K.-J. (2016). Research on urban heat-island effect. Procedia Engineering, 169, 11–18. Yang, Q., Huang, X., Li, J. (2017). Assessing the relationship between surface urban heat islands and landscape patterns across climatic zones in China. Scientific reports, 7(1), 1–11. Yu, X., Guo, X., Wu, Z. (2014). Land surface temperature retrieval from Landsat 8 TIRS—comparison between radiative transfer equation-based method, split window algorithm and single channel method. Remote Sensing, 6(10), 9829–9852. Zhang, X., Friedl, M. A., Schaaf, C. B., Strahler, A. H., Schneider, A. (2004). The footprint of urban cli- mates on vegetation phenology. Geophysical Research Letters. https://​doi.​org/​10.​1029/​2004G​L0201​37 Zheng, Y., Ren, H., Guo, J., Ghent, D., Tansey, K., Hu, X., et al. (2019). Land surface temperature retrieval from sentinel-3A sea and land surface temperature radiometer, using a split-window algorithm. Remote Sensing, 11(6), 650. Zhou, D., Zhao, S., Zhang, L., Sun, G., Liu, Y. (2015). The footprint of urban heat island effect in China. Scientific reports, 5(1), 1–11. Zhou, J., Li, J., Zhang, L., Hu, D., Zhan, W. (2012). Intercomparison of methods for estimating land surface temperature from a Landsat-5 TM image in an arid region with low water vapour in the atmos- phere. International Journal of Remote Sensing, 33(8), 2582–2602. Publisher’s Note Springer Nature remains neutral with regard to jurisdictional claims in published maps and institutional affiliations.