The document presents the results of a land degradation assessment conducted in the Georgetown Watershed in St. Vincent and the Grenadines. It describes the physical, biological, and socio-cultural environment of the watershed area. The assessment identifies several critical land degradation issues affecting the watershed, including increasing pressure on land, improper waste disposal, coastal erosion, and removal of forest areas.


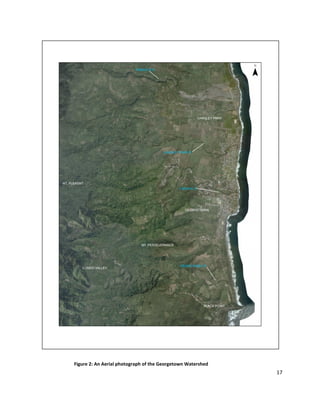
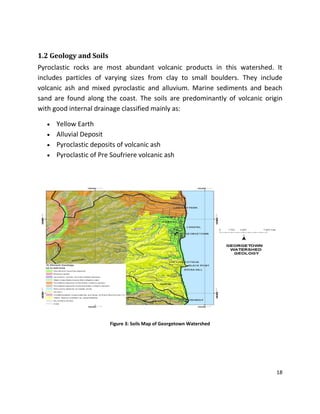
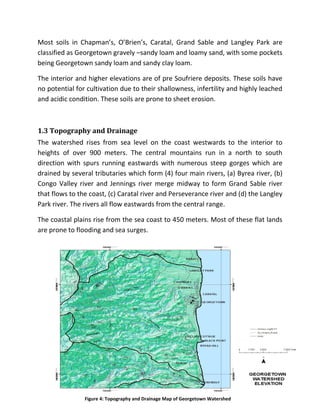
![6
Table 5: Fauna of the watershed ................................................................................................................26
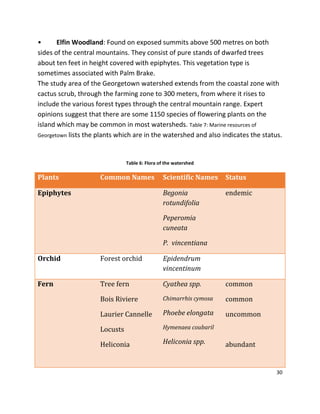
Table 6: Flora of the watershed..................................................................................................................30
Table 7: Marine resources of Georgetown.................................................................................................33
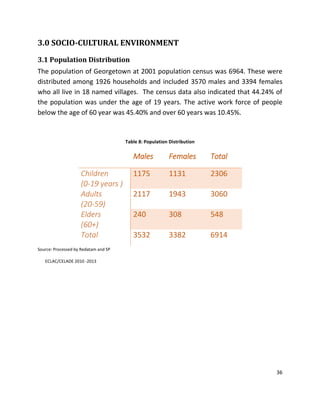
Table 8: Population Distribution.................................................................................................................36
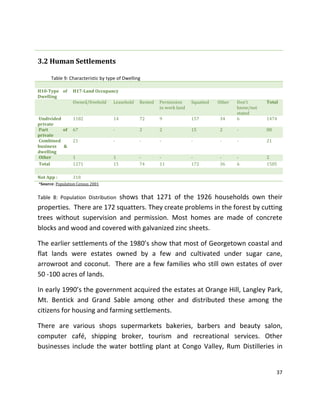
Table 9: Characteristic by type of Dwelling ................................................................................................37
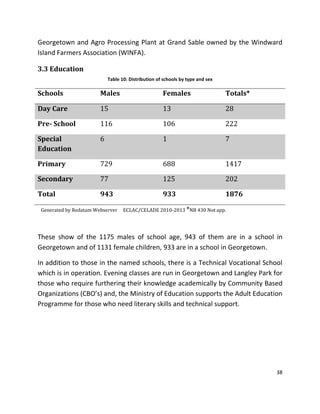
Table 10: Distribution of schools by type and sex ......................................................................................38
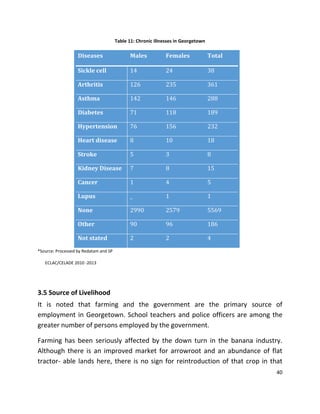
Table 11: Chronic illnesses in Georgetown.................................................................................................40
Table 12: Distribution of water from Perseverance (2009- 2012)..............................................................42
Table 13: The volume of garbage collected in Georgetown area between (2009 – 2012) [measured in
cubic meters]..............................................................................................................................44
Table 14: Environmental assets and their threats......................................................................................56
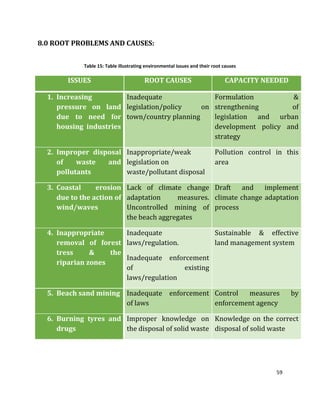
Table 15: Table illustrating environmental issues and their root causes ...................................................59
Table 16: A summary of development challenges and development opportunities in the Georgetown
Watershed ..................................................................................................................................60
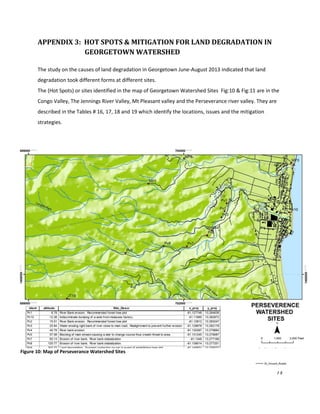
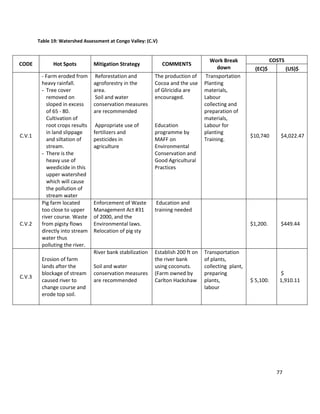
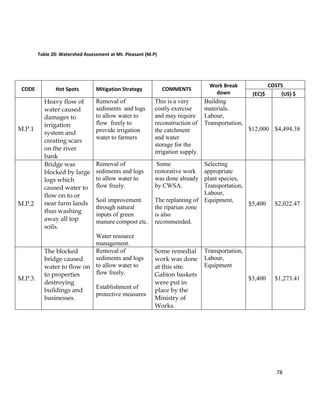
Table 17: Watershed Assessment of Perseverance: (P.V) ..........................................................................74
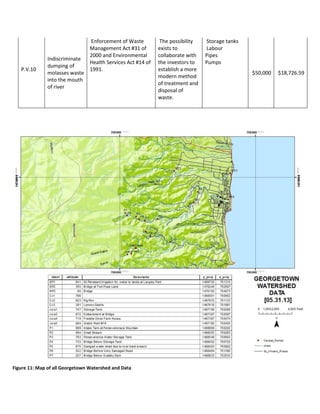
Table 18: Watershed Assessment of Jennings: (J.W)..................................................................................76
Table 19: Watershed Assessment at Congo Valley: (C.V)...........................................................................77
Table 20: Watershed Assessment at Mt. Pleasant (M.P) ...........................................................................78](https://image.slidesharecdn.com/9b18e00d-38ae-431b-aa4b-71aadf1822c3-150211205838-conversion-gate02/85/Main-Document-30-11-2013-6-320.jpg)
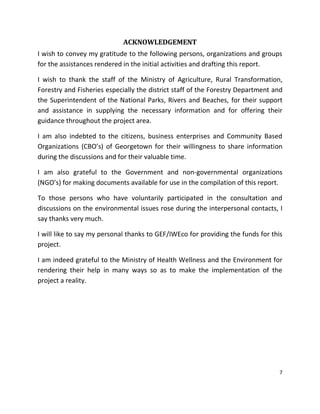
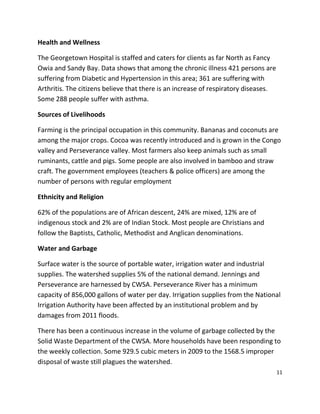
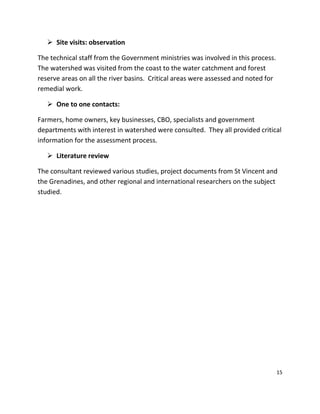
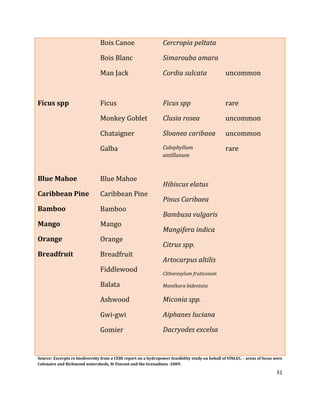
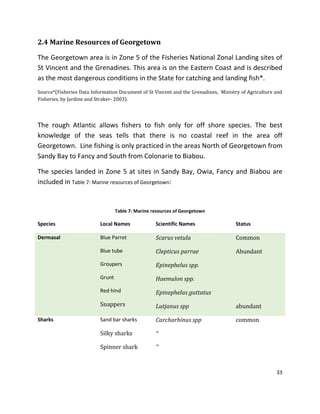
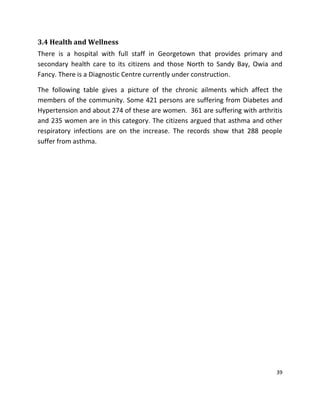
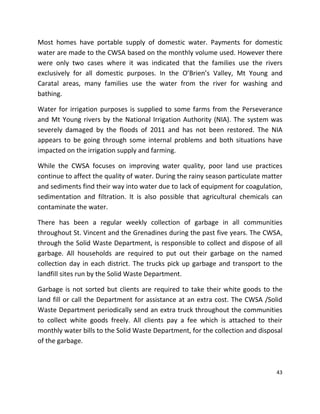
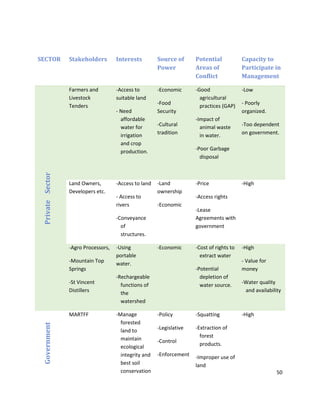
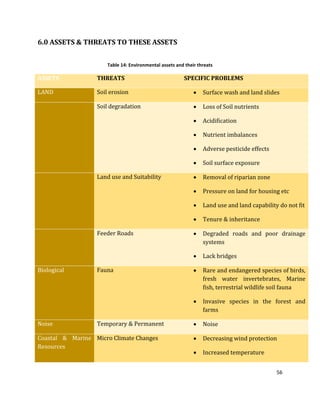
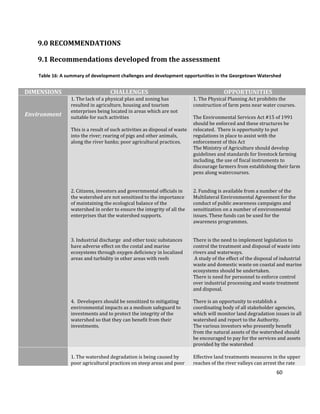
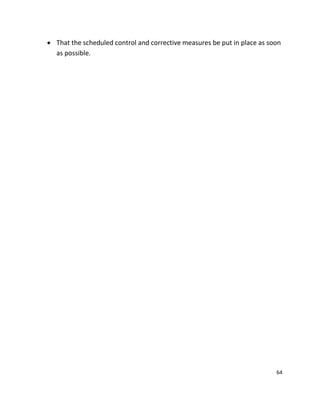
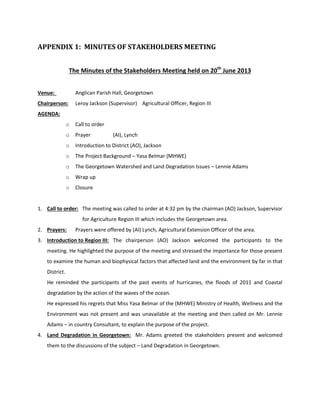
![44
The table which follows shows the volume of garbage collected in the
Georgetown area from 2009 to 2012.
Table 13: The volume of garbage collected in Georgetown area between (2009 – 2012) [measured in cubic
meters]
MONTHS 2009 2010 2011 2012
Jan 146 71 121 187
Feb 88 96 78 139**
March 86.5 86 132 167
April 56 106 41 86
May 62 44.3 127 100
June 49 60 60 121
July 76 71 82 71
Aug 86 88 121 126.5
Sept 70 99 173** 198**
Oct 45 97 62 150**
Nov 99 43 96 170
Dec 66 146 58 113
Total 929.5 1007.3 1151 1568.5
*NB Source CWSA/ Solid Waste Department 2013
** White goods were collected, coast clean up Oct, garbage was also collected from Sandy Bay in Feb.
There is a continuous increase in the volume of garbage collected over the years.
More householders have been responding to the collection. There is the problem
of the improper disposal of waste and the citizens have expressed their concerns.
CBO’s are frequently mobilized and conduct clean up campaigns along the
riverbanks and along the shoreline.](https://image.slidesharecdn.com/9b18e00d-38ae-431b-aa4b-71aadf1822c3-150211205838-conversion-gate02/85/Main-Document-30-11-2013-44-320.jpg)