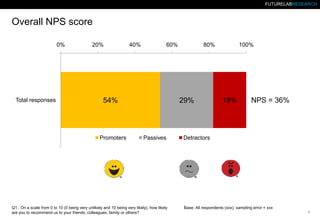
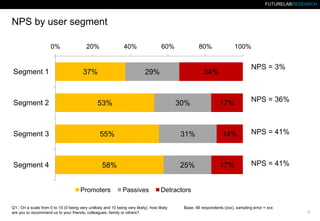
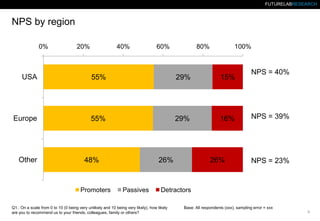
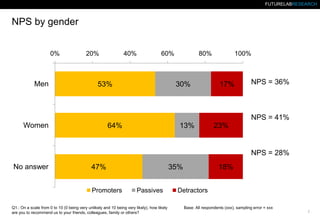
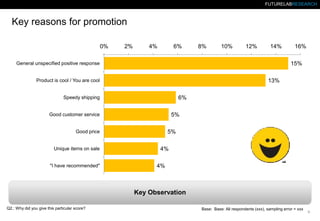
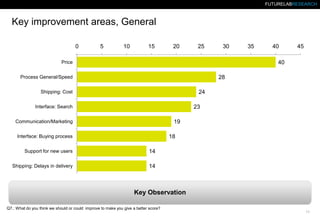
FUTURELABRESEARCH

Magenta NPS study report
For illustration purposes only. Examples are taken from different presentations.
Actual report may contain different / more data, depending on the needs of the client.
FUTURELABRESEARCH

Great Quotes by Promoters


You make dreams come true easily



Ordering was easy, delivery was fast, and if anything went wrong, your customer service team was always
there to help.

2.
FUTURELABRESEARCH

Response rates by segment
Sent

Responses

Response rate

2,500

25%

2,000

21%

2,000

1,500

20%

15%

14%
12%

1,000

1,000

1,000

1,000

500

10%
6%

5%

231

143

60

207

-

0%

Segment 1

Segment 2

Segment 3

Segment 4

Key Observation
3.
FUTURELABRESEARCH

Overall NPS score
0%

Total responses

20%

40%

60%

54%

Promoters

80%

29%

Passives

Q1.: On a scale from 0 to 10 (0 being very unlikely and 10 being very likely), how likely
are you to recommend us to your friends, colleagues, family or others?

100%

18%

NPS = 36%

Detractors

Base: All respondents (xxx), sampling error = xxx
4.
FUTURELABRESEARCH

NPS by user segment
0%

Segment 1

Segment 2

Segment 3

Segment 4

20%

40%

37%

60%

80%

29%

30%

55%

31%

58%

25%
Passives

NPS = 3%

34%

53%

Promoters

100%

17%

14%

17%

NPS = 36%

NPS = 41%

NPS = 41%

Detractors

Q1.: On a scale from 0 to 10 (0 being very unlikely and 10 being very likely), how likely
are you to recommend us to your friends, colleagues, family or others?

Base: All respondents (xxx), sampling error = xxx
5.
FUTURELABRESEARCH

NPS by region
0%

20%

40%

60%

80%

100%

USA

55%

29%

15%

Europe

55%

29%

16%

Other

48%

Promoters

26%

Passives

26%

NPS = 40%

NPS = 39%

NPS = 23%

Detractors

Q1.: On a scale from 0 to 10 (0 being very unlikely and 10 being very likely), how likely
are you to recommend us to your friends, colleagues, family or others?

Base: All respondents (xxx), sampling error = xxx
6.
FUTURELABRESEARCH

NPS by gender
0%

Men

20%

40%

60%

53%

80%

30%

100%

17%

NPS = 36%

NPS = 41%
Women

64%

13%

23%

NPS = 28%
No answer

47%
Promoters

35%
Passives

Q1.: On a scale from 0 to 10 (0 being very unlikely and 10 being very likely), how likely
are you to recommend us to your friends, colleagues, family or others?

18%

Detractors
Base: All respondents (xxx), sampling error = xxx
7.
FUTURELABRESEARCH

NPS by age
0%

12 to 18

20%

40%

60%

50%

80%

31%

100%

19%

NPS = 31%

18 to 25

55%

30%

16%

NPS = 39%

26 to 35

55%

31%

14%

NPS = 41%

36 to 45

55%

46+
Prefer not to tell

23%

57%

37%
Passives

Q1.: On a scale from 0 to 10 (0 being very unlikely and 10 being very likely), how likely
are you to recommend us to your friends, colleagues, family or others?

NPS = 33%

18%

NPS = 40%

20%

25%

43%
Promoters

22%

NPS = 23%

Detractors
Base: All respondents (xxx), sampling error = xxx
8.
FUTURELABRESEARCH

Key reasons for promotion
0%

2%

4%

6%

8%

10%

12%

14%

15%

General unspecified positive response

13%

Product is cool / You are cool

6%

Speedy shipping

5%

Good customer service

5%

Good price

Unique items on sale

"I have recommended"

16%

4%
4%

Key Observation
Q2.: Why did you give this particular score?

Base: Base: All respondents (xxx), sampling error = xxx

9.
FUTURELABRESEARCH

Key reasons for detraction
0%

2%

4%

6%

8%

10%

12%

14%

12%

General unspecified negative response

7%

Low quality

Slow shipping

6%

Bad customer service

6%
5%

Bad pricing

Website is not friendly

3%

Key Observation
Q2.: Why did you give this particular score?

Base: Base: All respondents (xxx), sampling error = xxx

10.
FUTURELABRESEARCH

Key improvement areas, General
0

5

10

15

20

25

30

35

40

45

40

Price

28

Process General/Speed

24

Shipping: Cost

23

Interface: Search

19

Communication/Marketing

18

Interface: Buying process
Support for new users

14

Shipping: Delays in delivery

14

Key Observation
Q7.: What do you think we should or could improve to make you give a better score?
11.
FUTURELABRESEARCH

Portrait of a promoter vs. detractor
Parameter 1

Parameter 2

Parameter 3

100%
80%
58%

56%

51%

60%
40%
16%
20%

12%

11%

32%

38%

26%

Promoter

Passive

Detractor

0%

Key Observation
12.
FUTURELABRESEARCH

Average Purchase Amount by Customer Type
Promoters

Passives

Detractors

500
425
400

468

457
425

416

398
355

368

404

387

451

445

387

359
299

300

200

100

-

All respondents

Segment 1

Segment 2

Segment 3

Segment 4

Key Observation
13.
FUTURELABRESEARCH



What is really good



What’s not so good

14.
FUTURELABRESEARCH

Top Fixes & Suggestions


Fixes



Suggestions

15

Magenta NPS report template

  • 1.
    FUTURELABRESEARCH Magenta NPS studyreport For illustration purposes only. Examples are taken from different presentations. Actual report may contain different / more data, depending on the needs of the client.
  • 2.
    FUTURELABRESEARCH Great Quotes byPromoters  You make dreams come true easily  Ordering was easy, delivery was fast, and if anything went wrong, your customer service team was always there to help. 2.
  • 3.
    FUTURELABRESEARCH Response rates bysegment Sent Responses Response rate 2,500 25% 2,000 21% 2,000 1,500 20% 15% 14% 12% 1,000 1,000 1,000 1,000 500 10% 6% 5% 231 143 60 207 - 0% Segment 1 Segment 2 Segment 3 Segment 4 Key Observation 3.
  • 4.
    FUTURELABRESEARCH Overall NPS score 0% Totalresponses 20% 40% 60% 54% Promoters 80% 29% Passives Q1.: On a scale from 0 to 10 (0 being very unlikely and 10 being very likely), how likely are you to recommend us to your friends, colleagues, family or others? 100% 18% NPS = 36% Detractors Base: All respondents (xxx), sampling error = xxx 4.
  • 5.
    FUTURELABRESEARCH NPS by usersegment 0% Segment 1 Segment 2 Segment 3 Segment 4 20% 40% 37% 60% 80% 29% 30% 55% 31% 58% 25% Passives NPS = 3% 34% 53% Promoters 100% 17% 14% 17% NPS = 36% NPS = 41% NPS = 41% Detractors Q1.: On a scale from 0 to 10 (0 being very unlikely and 10 being very likely), how likely are you to recommend us to your friends, colleagues, family or others? Base: All respondents (xxx), sampling error = xxx 5.
  • 6.
    FUTURELABRESEARCH NPS by region 0% 20% 40% 60% 80% 100% USA 55% 29% 15% Europe 55% 29% 16% Other 48% Promoters 26% Passives 26% NPS= 40% NPS = 39% NPS = 23% Detractors Q1.: On a scale from 0 to 10 (0 being very unlikely and 10 being very likely), how likely are you to recommend us to your friends, colleagues, family or others? Base: All respondents (xxx), sampling error = xxx 6.
  • 7.
    FUTURELABRESEARCH NPS by gender 0% Men 20% 40% 60% 53% 80% 30% 100% 17% NPS= 36% NPS = 41% Women 64% 13% 23% NPS = 28% No answer 47% Promoters 35% Passives Q1.: On a scale from 0 to 10 (0 being very unlikely and 10 being very likely), how likely are you to recommend us to your friends, colleagues, family or others? 18% Detractors Base: All respondents (xxx), sampling error = xxx 7.
  • 8.
    FUTURELABRESEARCH NPS by age 0% 12to 18 20% 40% 60% 50% 80% 31% 100% 19% NPS = 31% 18 to 25 55% 30% 16% NPS = 39% 26 to 35 55% 31% 14% NPS = 41% 36 to 45 55% 46+ Prefer not to tell 23% 57% 37% Passives Q1.: On a scale from 0 to 10 (0 being very unlikely and 10 being very likely), how likely are you to recommend us to your friends, colleagues, family or others? NPS = 33% 18% NPS = 40% 20% 25% 43% Promoters 22% NPS = 23% Detractors Base: All respondents (xxx), sampling error = xxx 8.
  • 9.
    FUTURELABRESEARCH Key reasons forpromotion 0% 2% 4% 6% 8% 10% 12% 14% 15% General unspecified positive response 13% Product is cool / You are cool 6% Speedy shipping 5% Good customer service 5% Good price Unique items on sale "I have recommended" 16% 4% 4% Key Observation Q2.: Why did you give this particular score? Base: Base: All respondents (xxx), sampling error = xxx 9.
  • 10.
    FUTURELABRESEARCH Key reasons fordetraction 0% 2% 4% 6% 8% 10% 12% 14% 12% General unspecified negative response 7% Low quality Slow shipping 6% Bad customer service 6% 5% Bad pricing Website is not friendly 3% Key Observation Q2.: Why did you give this particular score? Base: Base: All respondents (xxx), sampling error = xxx 10.
  • 11.
    FUTURELABRESEARCH Key improvement areas,General 0 5 10 15 20 25 30 35 40 45 40 Price 28 Process General/Speed 24 Shipping: Cost 23 Interface: Search 19 Communication/Marketing 18 Interface: Buying process Support for new users 14 Shipping: Delays in delivery 14 Key Observation Q7.: What do you think we should or could improve to make you give a better score? 11.
  • 12.
    FUTURELABRESEARCH Portrait of apromoter vs. detractor Parameter 1 Parameter 2 Parameter 3 100% 80% 58% 56% 51% 60% 40% 16% 20% 12% 11% 32% 38% 26% Promoter Passive Detractor 0% Key Observation 12.
  • 13.
    FUTURELABRESEARCH Average Purchase Amountby Customer Type Promoters Passives Detractors 500 425 400 468 457 425 416 398 355 368 404 387 451 445 387 359 299 300 200 100 - All respondents Segment 1 Segment 2 Segment 3 Segment 4 Key Observation 13.
  • 14.
    FUTURELABRESEARCH  What is reallygood  What’s not so good 14.
  • 15.
    FUTURELABRESEARCH Top Fixes &Suggestions  Fixes  Suggestions 15