Download to read offline


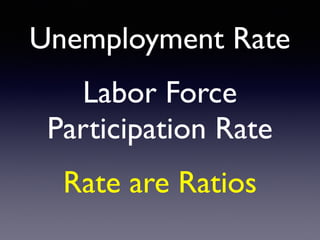
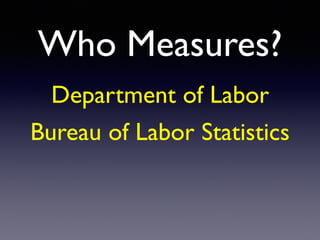


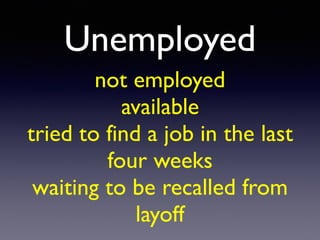
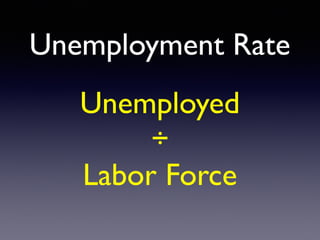


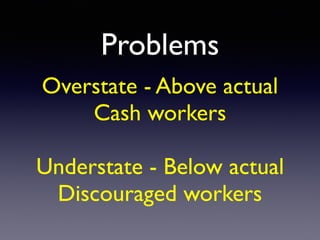

This document discusses macroeconomics, finance, unemployment, and labor force statistics. It defines key terms like the Dow Jones Industrial Average, future value, present value, unemployment rate, labor force participation rate. It explains that the unemployment rate is calculated by dividing the number of unemployed by the labor force. The Bureau of Labor Statistics measures unemployment through surveys to track employment, unemployment, and those not in the labor force.


