Recommended
PDF
Artificial Intelligence, Data and Competition – SCHREPEL – June 2024 OECD dis...
PDF
How to Leverage AI to Boost Employee Wellness - Lydia Di Francesco - SocialHR...
PDF
Storytelling For The Web: Integrate Storytelling in your Design Process
PDF
2024 State of Marketing Report – by Hubspot
PDF
2024 Trend Updates: What Really Works In SEO & Content Marketing
PDF
Everything You Need To Know About ChatGPT
PDF
Product Design Trends in 2024 | Teenage Engineerings
PDF
How Race, Age and Gender Shape Attitudes Towards Mental Health
PPTX
WOWVerse Workshop: Agentic AI & LLM Workshop
PDF
EDIH TRAINING AI FOR COMPANIES: MODULE 4
PPTX
Lubrication Neglect Causes More Downtime Than AI Ever Will Why Maintenance Fu...
PDF
JVM in the Age of AI: 2026 Edition - Deep Dive
PDF
CME397 SURFACE ENGINEERING UNIT 1 FULL NOTES
PDF
10 Tips for Successfully Purchasing Twitter Accounts.pdf
PDF
Brillouin zone analysis using Kronig-Penny model
PDF
A Newbie’s Journey: Hidden MySQL Pain Points That Vitess Quietly Solves
PPTX
SketchUp Pro 2026 – Advanced 3D Modeling Software
PDF
Chris Elwell Woburn - An Experienced IT Executive
PDF
Feedback and Network Architectures - Dynamics and Memory
PPTX
We-Optimized-Everything-Except-Decision-Quality-Maintenance-MaintWiz.pptx
PPTX
NANOMATERIAL in Construction presentation.pptx
PPTX
AI-Agents-Concepts-Applications-and-Types.pptx
PDF
Decision-Support-Systems-and-Decision-Making-Processes.pdf
PPTX
Integrating Azure Event Services_ Event Grid, Event Hubs, and Service Bus.pptx
PPTX
Distresses in Road Flexible pavement.pptx
PPTX
The Most Controversial TPM Debate in Maintenance Today Checklist TPM vs Outco...
PDF
AI-Driven Multi-Agent System for QOS Optimization in 6g Industrial Networks
PPTX
UNIT 2 - Electronics Device - EC25C01 - PN Junction Diodes
PDF
AI Trends in Creative Operations 2024 by Artwork Flow.pdf
PDF
More Related Content
PDF
Artificial Intelligence, Data and Competition – SCHREPEL – June 2024 OECD dis...
PDF
How to Leverage AI to Boost Employee Wellness - Lydia Di Francesco - SocialHR...
PDF
Storytelling For The Web: Integrate Storytelling in your Design Process
PDF
2024 State of Marketing Report – by Hubspot
PDF
2024 Trend Updates: What Really Works In SEO & Content Marketing
PDF
Everything You Need To Know About ChatGPT
PDF
Product Design Trends in 2024 | Teenage Engineerings
PDF
How Race, Age and Gender Shape Attitudes Towards Mental Health
Recently uploaded
PPTX
WOWVerse Workshop: Agentic AI & LLM Workshop
PDF
EDIH TRAINING AI FOR COMPANIES: MODULE 4
PPTX
Lubrication Neglect Causes More Downtime Than AI Ever Will Why Maintenance Fu...
PDF
JVM in the Age of AI: 2026 Edition - Deep Dive
PDF
CME397 SURFACE ENGINEERING UNIT 1 FULL NOTES
PDF
10 Tips for Successfully Purchasing Twitter Accounts.pdf
PDF
Brillouin zone analysis using Kronig-Penny model
PDF
A Newbie’s Journey: Hidden MySQL Pain Points That Vitess Quietly Solves
PPTX
SketchUp Pro 2026 – Advanced 3D Modeling Software
PDF
Chris Elwell Woburn - An Experienced IT Executive
PDF
Feedback and Network Architectures - Dynamics and Memory
PPTX
We-Optimized-Everything-Except-Decision-Quality-Maintenance-MaintWiz.pptx
PPTX
NANOMATERIAL in Construction presentation.pptx
PPTX
AI-Agents-Concepts-Applications-and-Types.pptx
PDF
Decision-Support-Systems-and-Decision-Making-Processes.pdf
PPTX
Integrating Azure Event Services_ Event Grid, Event Hubs, and Service Bus.pptx
PPTX
Distresses in Road Flexible pavement.pptx
PPTX
The Most Controversial TPM Debate in Maintenance Today Checklist TPM vs Outco...
PDF
AI-Driven Multi-Agent System for QOS Optimization in 6g Industrial Networks
PPTX
UNIT 2 - Electronics Device - EC25C01 - PN Junction Diodes
Featured
PDF
AI Trends in Creative Operations 2024 by Artwork Flow.pdf
PDF
PDF
PEPSICO Presentation to CAGNY Conference Feb 2024
PDF
Content Methodology: A Best Practices Report (Webinar)
PPTX
How to Prepare For a Successful Job Search for 2024
PDF
Social Media Marketing Trends 2024 // The Global Indie Insights
PDF
Trends In Paid Search: Navigating The Digital Landscape In 2024
PDF
5 Public speaking tips from TED - Visualized summary
PDF
ChatGPT and the Future of Work - Clark Boyd
PDF
Getting into the tech field. what next
PDF
Google's Just Not That Into You: Understanding Core Updates & Search Intent
PDF
How to have difficult conversations
PDF
Introduction to Data Science
PDF
Time Management & Productivity - Best Practices
PDF
The six step guide to practical project management
PDF
Beginners Guide to TikTok for Search - Rachel Pearson - We are Tilt __ Bright...
PDF
Unlocking the Power of ChatGPT and AI in Testing - A Real-World Look, present...
PDF
12 Ways to Increase Your Influence at Work
PDF
PDF
More than Just Lines on a Map: Best Practices for U.S Bike Routes
machine learning .multivariate........... 1. EX NO 11:
MULTIVARIATE ANALYSIS
AIM:
To implement a multivariate tree using python.
ALGORITHM:
1. Import pandas and scikit package.
2. Load the iris dataset.
3. Check datatype.
4. Examine the keys present in the dataset.
5. Collect all the independent and store it as datainddata.
6. Convert the object into a pandas dataframe.
7. Display the features names in the dataset.
8. Create a list with all the column names.
9. Split the datas into training and test dataset.
10. Instantiate the decision tree model.
11. Obtain the Predictions for the model.
12. Visualize the decision tree.
PROGRAM :
# Import libraries
import pandas as pd
import numpy as np
import matplotlib.pyplot as plt
import seaborn as sns
# Import the dataset
df = sns.load_dataset('iris')
df.shape
(150, 5)
df.head(100)
43
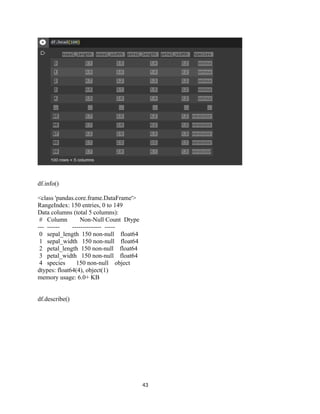
2. df.info()
<class 'pandas.core.frame.DataFrame'>
RangeIndex: 150 entries, 0 to 149
Data columns (total 5 columns):
# Column Non-Null Count Dtype
--- ------ -------------- -----
0 sepal_length 150 non-null float64
1 sepal_width 150 non-null float64
2 petal_length 150 non-null float64
3 petal_width 150 non-null float64
4 species 150 non-null object
dtypes: float64(4), object(1)
memory usage: 6.0+ KB
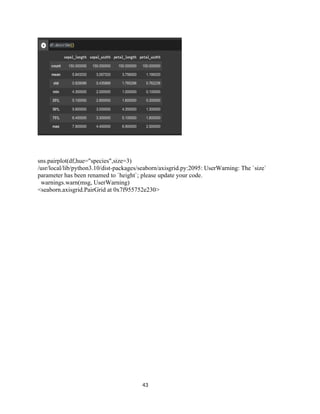
df.describe()
43
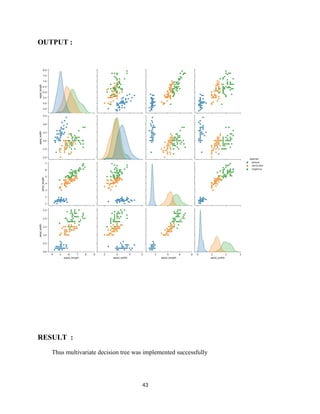
3. 4.