Download free for 30 days
Sign in
Upload
Language (EN)
Support
Business
Mobile
Social Media
Marketing
Technology
Art & Photos
Career
Design
Education
Presentations & Public Speaking
Government & Nonprofit
Healthcare
Internet
Law
Leadership & Management
Automotive
Engineering
Software
Recruiting & HR
Retail
Sales
Services
Science
Small Business & Entrepreneurship
Food
Environment
Economy & Finance
Data & Analytics
Investor Relations
Sports
Spiritual
News & Politics
Travel
Self Improvement
Real Estate
Entertainment & Humor
Health & Medicine
Devices & Hardware
Lifestyle
Change Language
Language
English
Español
Português
Français
Deutsche
Cancel
Save
Submit search
EN
Uploaded by
sajaeidali
PPT, PDF
0 views
M15_you can Gordon8014701_12_MacroC15.ppt
How are you doing today dear hope
Education
◦
Read more
0
Save
Share
Embed
Embed presentation
Download
Download to read offline
1
/ 28
2
/ 28
3
/ 28
4
/ 28
5
/ 28
6
/ 28
7
/ 28
8
/ 28
9
/ 28
10
/ 28
11
/ 28
12
/ 28
13
/ 28
14
/ 28
15
/ 28
16
/ 28
17
/ 28
18
/ 28
19
/ 28
20
/ 28
21
/ 28
22
/ 28
23
/ 28
24
/ 28
25
/ 28
26
/ 28
27
/ 28
28
/ 28
More Related Content
PDF
شابتر ١٥ you can come to my lizard friend .pdf
by
sajaeidali
PPT
Chap01.pptaaaaaaaaaaaaaaaaaaaaaaaaaaaaaaaaaaa
by
Dan Lhery Gregorious
PPT
Chapaaaaaaaaaaaaaaaaaaaaaaaaaaaaaaaaaaa01.ppt
by
Dan Lhery Gregorious
PPT
Chaaaaaaaaaaaaaaaaaaaaaaaaaaaaaaaaaaaaaaaaaaaaaaap01.ppt
by
Dan Lhery Gregorious
PPTX
Theory of consumption
by
Murugan Kaliappani
PPTX
Permanent and Life Cycle Income Hypothesis
by
JosephAsafo1
PDF
Consumption hypotheses
by
Prasoon Agarwal
PPT
Chap01.ppt, income and substitution effect
by
SHIBABAWZEWDU
شابتر ١٥ you can come to my lizard friend .pdf
by
sajaeidali
Chap01.pptaaaaaaaaaaaaaaaaaaaaaaaaaaaaaaaaaaa
by
Dan Lhery Gregorious
Chapaaaaaaaaaaaaaaaaaaaaaaaaaaaaaaaaaaa01.ppt
by
Dan Lhery Gregorious
Chaaaaaaaaaaaaaaaaaaaaaaaaaaaaaaaaaaaaaaaaaaaaaaap01.ppt
by
Dan Lhery Gregorious
Theory of consumption
by
Murugan Kaliappani
Permanent and Life Cycle Income Hypothesis
by
JosephAsafo1
Consumption hypotheses
by
Prasoon Agarwal
Chap01.ppt, income and substitution effect
by
SHIBABAWZEWDU
Similar to M15_you can Gordon8014701_12_MacroC15.ppt
PPT
Chapter 12 Powerpoint
by
Malcolm Harrison
PPT
The Household-Consumption Sector
by
sadraus
PPT
Chapter 12 Powerpoint
by
Malcolm Harrison
PDF
determinanananadfawe'ga[prkba[o[okbao[mbaoosmfolmm
by
darrabrianarishan
PPT
Chap01.ppt, consumption, saving and investment
by
SHIBABAWZEWDU
DOCX
Permanent Income Hypothesis, a two period application MBA 6.docx
by
karlhennesey
PPT
Chap01.ppt
by
Sabrina377028
PDF
Consumption theories.pdf
by
Ayushi Thakur
PPTX
Consumption Theory - advanced Macroeconomics
by
Kamelu1
PPTX
Consumption Theory - in Advanced Macroeconomics
by
Kamelu1
PPTX
Theories of Consumption.pptx
by
Soumya850048
PDF
Modigliani lch
by
N/A - Unemployed
PPT
MACROECONOMICS-CH16
by
kkjjkevin03
PPT
Class4 mff[1]
by
tonyslam
PPTX
Ma II.pptx
by
CaalaaZawudee
DOCX
Case StudiesCase StudiesAGGREGATE EXPENDITURECase Study .docx
by
tidwellveronique
PPT
Chap01.ppt
by
MjMj96
PPT
Chap01.ppt
by
GetachewGurmu
PDF
Factors of permanent income and effects over consumption in pakistan (1973 2013)
by
Alexander Decker
PPT
An Essay on Consumption Hypotheses by Mr. Khalid Khan, Lasbela University of ...
by
International Food Policy Research Institute
Chapter 12 Powerpoint
by
Malcolm Harrison
The Household-Consumption Sector
by
sadraus
Chapter 12 Powerpoint
by
Malcolm Harrison
determinanananadfawe'ga[prkba[o[okbao[mbaoosmfolmm
by
darrabrianarishan
Chap01.ppt, consumption, saving and investment
by
SHIBABAWZEWDU
Permanent Income Hypothesis, a two period application MBA 6.docx
by
karlhennesey
Chap01.ppt
by
Sabrina377028
Consumption theories.pdf
by
Ayushi Thakur
Consumption Theory - advanced Macroeconomics
by
Kamelu1
Consumption Theory - in Advanced Macroeconomics
by
Kamelu1
Theories of Consumption.pptx
by
Soumya850048
Modigliani lch
by
N/A - Unemployed
MACROECONOMICS-CH16
by
kkjjkevin03
Class4 mff[1]
by
tonyslam
Ma II.pptx
by
CaalaaZawudee
Case StudiesCase StudiesAGGREGATE EXPENDITURECase Study .docx
by
tidwellveronique
Chap01.ppt
by
MjMj96
Chap01.ppt
by
GetachewGurmu
Factors of permanent income and effects over consumption in pakistan (1973 2013)
by
Alexander Decker
An Essay on Consumption Hypotheses by Mr. Khalid Khan, Lasbela University of ...
by
International Food Policy Research Institute
Recently uploaded
PDF
Chaplin's Visual Critique of Modernism: Modern Times and The Great Dictator
by
krutivyas2005
PDF
BỘ TEST KIỂM TRA CUỐI HỌC KÌ 1 - TIẾNG ANH 6-7-8-9 GLOBAL SUCCESS - PHIÊN BẢN...
by
Nguyen Thanh Tu Collection
PDF
The Tale of Melon City poem ppt by Sahasra
by
bitrasahasra
PDF
Prescription Writing- Elements, Parts, and Exercises
by
Dr. Ishita Agarwal
PDF
Nutrients & Role in Horticulture.pdf, Dr. Sharad Bisen Horticulture
by
bisensharad
PPTX
Limpitlaw "Licensing: From Mindset to Milestones"
by
National Information Standards Organization (NISO)
PPTX
The Art Pastor's Guide to the Liturgical Calendar
by
Steve Thomason
PDF
The Pity of War: Form, Fragment, and the Artificial Echo | Understanding War ...
by
Nidhi Pandya
PDF
Principles and Practices of GST 2.0 Study material
by
Sri Ramakrishna College of Arts and science
PPTX
Hypothesis. its definition and typrs pptx
by
Makarand Joshi
PPTX
CLASS -9 POLITICAL SCIENCE PPT CHAPTER -5 DEMOCRATIC RIGHTS.pptx
by
dushyantchavhan
PDF
Types of Vegetable Gardens, College of Agriculture Balaghat.pdf
by
bisensharad
PDF
Orchard Floor Managment.pdf Orchard Floor Management
by
bisensharad
DOCX
Mobile applications Devlopment ReTest year 2025-2026
by
Dr. Mazin Mohamed alkathiri
PPTX
Vitamins and mineral deficiency , signs and symptoms associated with exercise
by
virupa chandrika reddy
PDF
DHA OPTOMETRY MCQ Question /HAAD/MOH.pdf
by
Anmol Singh
PPTX
Unit I — General Physiology: Basic Concepts
by
RAKESH SAJJAN
PPTX
ICH Harmonization A Global Pathway to Unified Drug Regulation.pptx
by
Dr. Smita Kumbhar
PDF
All Students Workshop 25 Yoga Wellness by LDMMIA
by
©LDMMIA, ©Reiki Yoga
PPTX
Pain. definition, causes, factor influencing pain & pain assessment.pptx
by
Pompi Begum
Chaplin's Visual Critique of Modernism: Modern Times and The Great Dictator
by
krutivyas2005
BỘ TEST KIỂM TRA CUỐI HỌC KÌ 1 - TIẾNG ANH 6-7-8-9 GLOBAL SUCCESS - PHIÊN BẢN...
by
Nguyen Thanh Tu Collection
The Tale of Melon City poem ppt by Sahasra
by
bitrasahasra
Prescription Writing- Elements, Parts, and Exercises
by
Dr. Ishita Agarwal
Nutrients & Role in Horticulture.pdf, Dr. Sharad Bisen Horticulture
by
bisensharad
Limpitlaw "Licensing: From Mindset to Milestones"
by
National Information Standards Organization (NISO)
The Art Pastor's Guide to the Liturgical Calendar
by
Steve Thomason
The Pity of War: Form, Fragment, and the Artificial Echo | Understanding War ...
by
Nidhi Pandya
Principles and Practices of GST 2.0 Study material
by
Sri Ramakrishna College of Arts and science
Hypothesis. its definition and typrs pptx
by
Makarand Joshi
CLASS -9 POLITICAL SCIENCE PPT CHAPTER -5 DEMOCRATIC RIGHTS.pptx
by
dushyantchavhan
Types of Vegetable Gardens, College of Agriculture Balaghat.pdf
by
bisensharad
Orchard Floor Managment.pdf Orchard Floor Management
by
bisensharad
Mobile applications Devlopment ReTest year 2025-2026
by
Dr. Mazin Mohamed alkathiri
Vitamins and mineral deficiency , signs and symptoms associated with exercise
by
virupa chandrika reddy
DHA OPTOMETRY MCQ Question /HAAD/MOH.pdf
by
Anmol Singh
Unit I — General Physiology: Basic Concepts
by
RAKESH SAJJAN
ICH Harmonization A Global Pathway to Unified Drug Regulation.pptx
by
Dr. Smita Kumbhar
All Students Workshop 25 Yoga Wellness by LDMMIA
by
©LDMMIA, ©Reiki Yoga
Pain. definition, causes, factor influencing pain & pain assessment.pptx
by
Pompi Begum
M15_you can Gordon8014701_12_MacroC15.ppt
1.
Copyright © 2012
Pearson Addison-Wesley. All rights reserved. Chapter 15 The Economics of Consumption Behavior
2.
Copyright © 2012
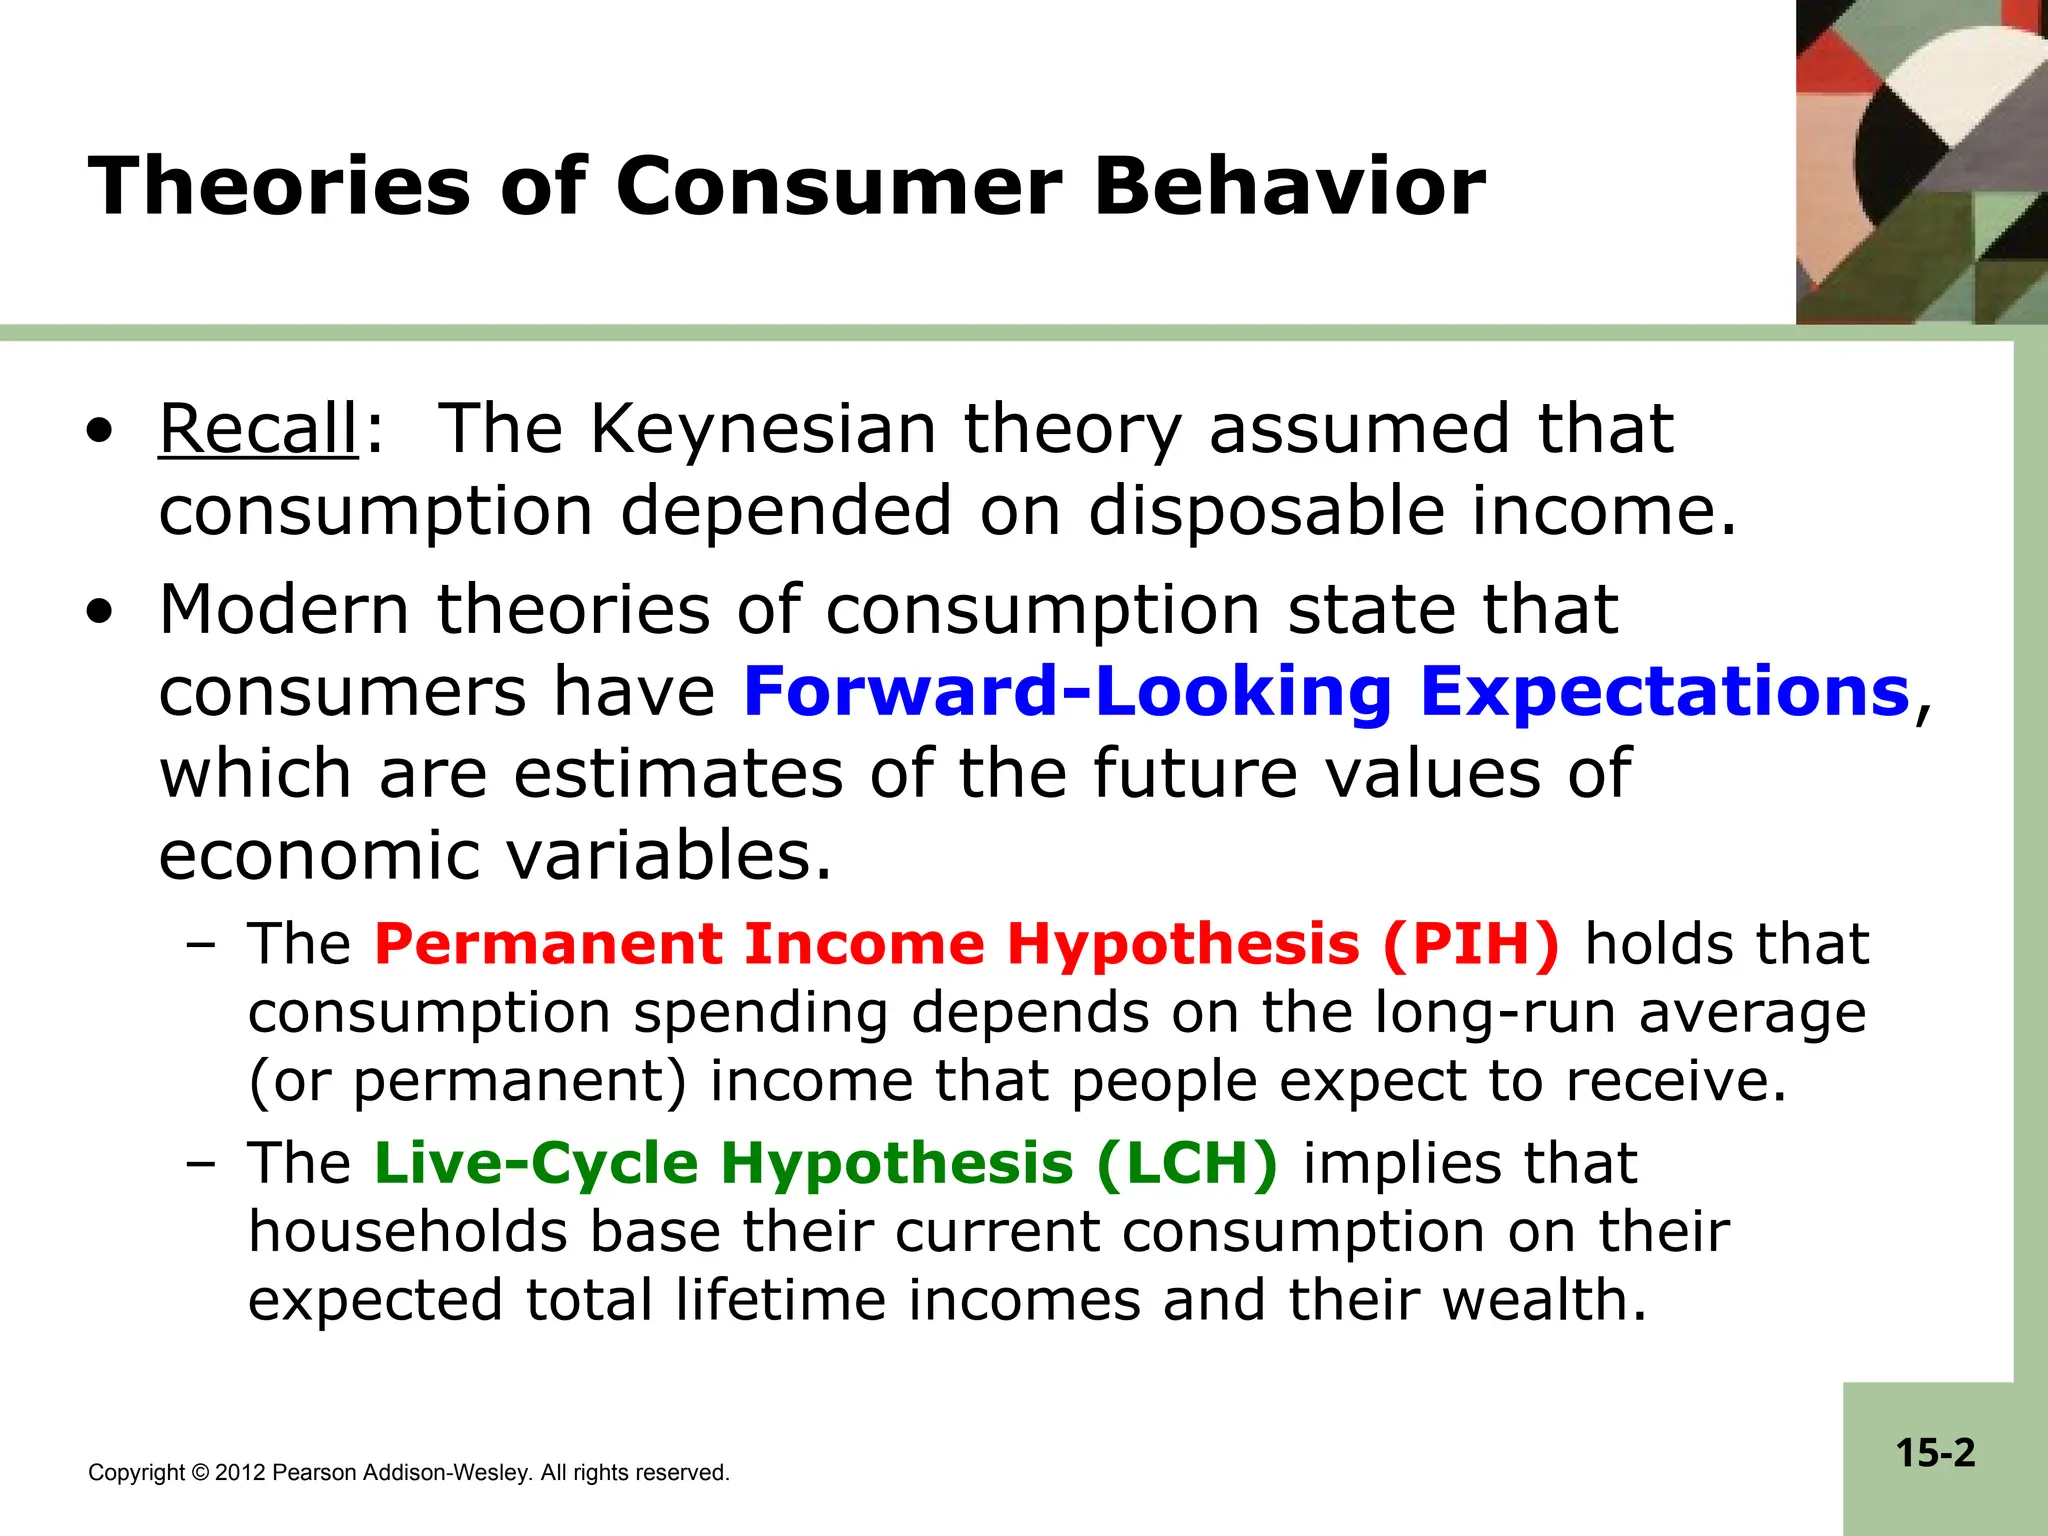
Pearson Addison-Wesley. All rights reserved. 15-2 Theories of Consumer Behavior • Recall: The Keynesian theory assumed that consumption depended on disposable income. • Modern theories of consumption state that consumers have Forward-Looking Expectations, which are estimates of the future values of economic variables. – The Permanent Income Hypothesis (PIH) holds that consumption spending depends on the long-run average (or permanent) income that people expect to receive. – The Live-Cycle Hypothesis (LCH) implies that households base their current consumption on their expected total lifetime incomes and their wealth.
3.
Copyright © 2012
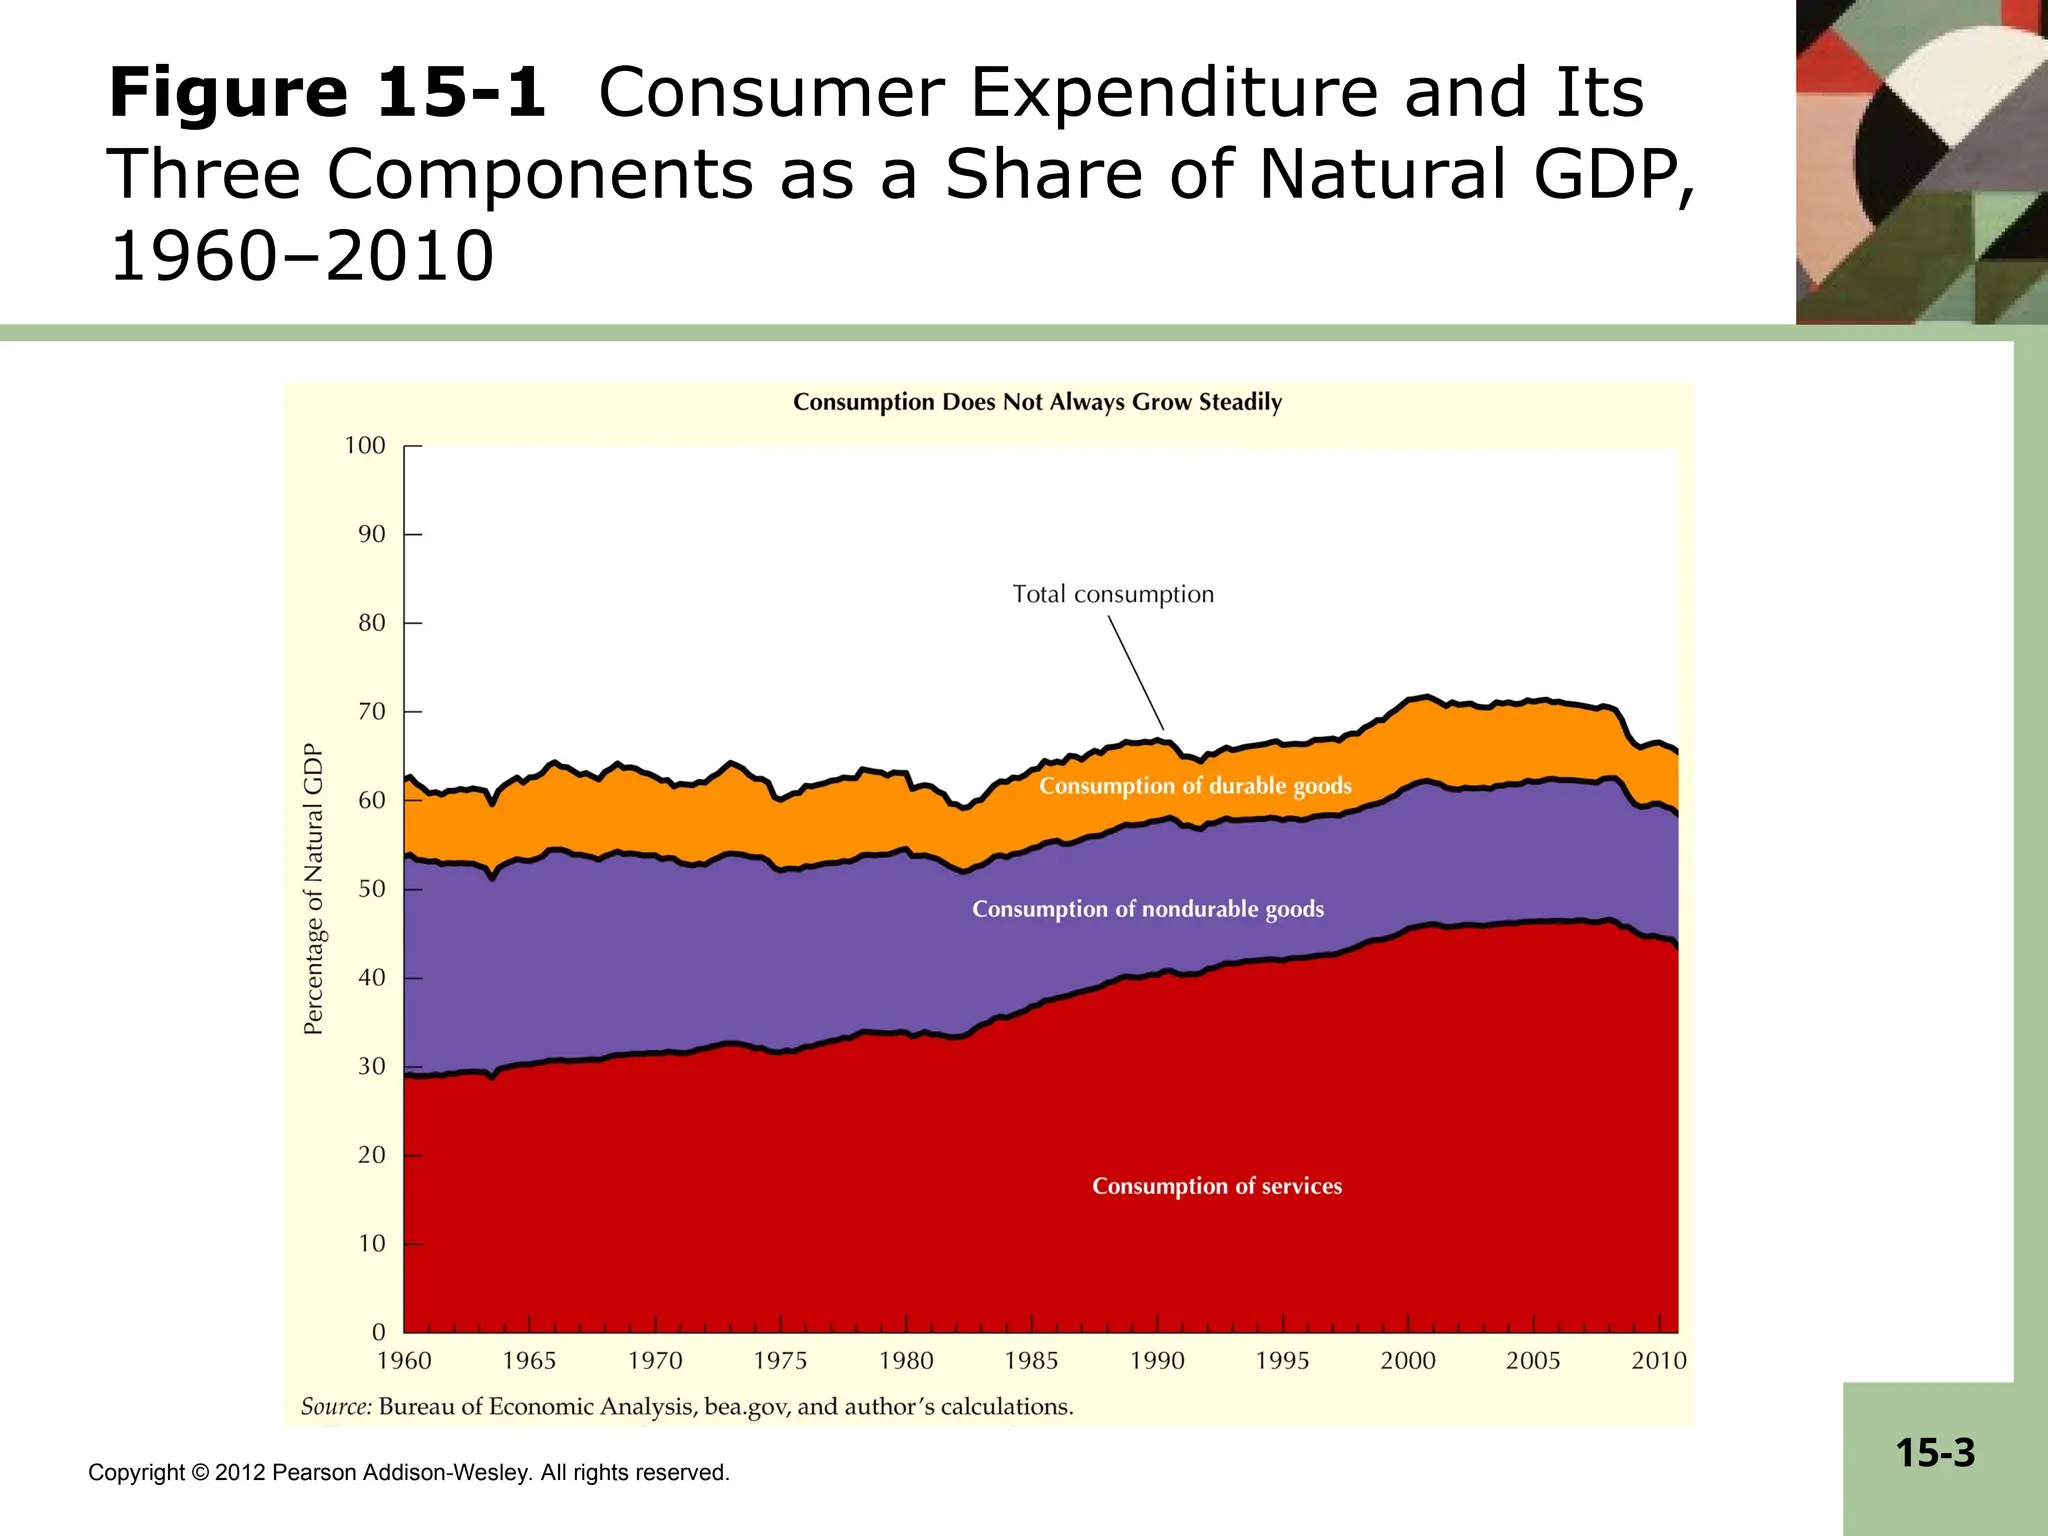
Pearson Addison-Wesley. All rights reserved. 15-3 Figure 15-1 Consumer Expenditure and Its Three Components as a Share of Natural GDP, 1960–2010
4.
Copyright © 2012
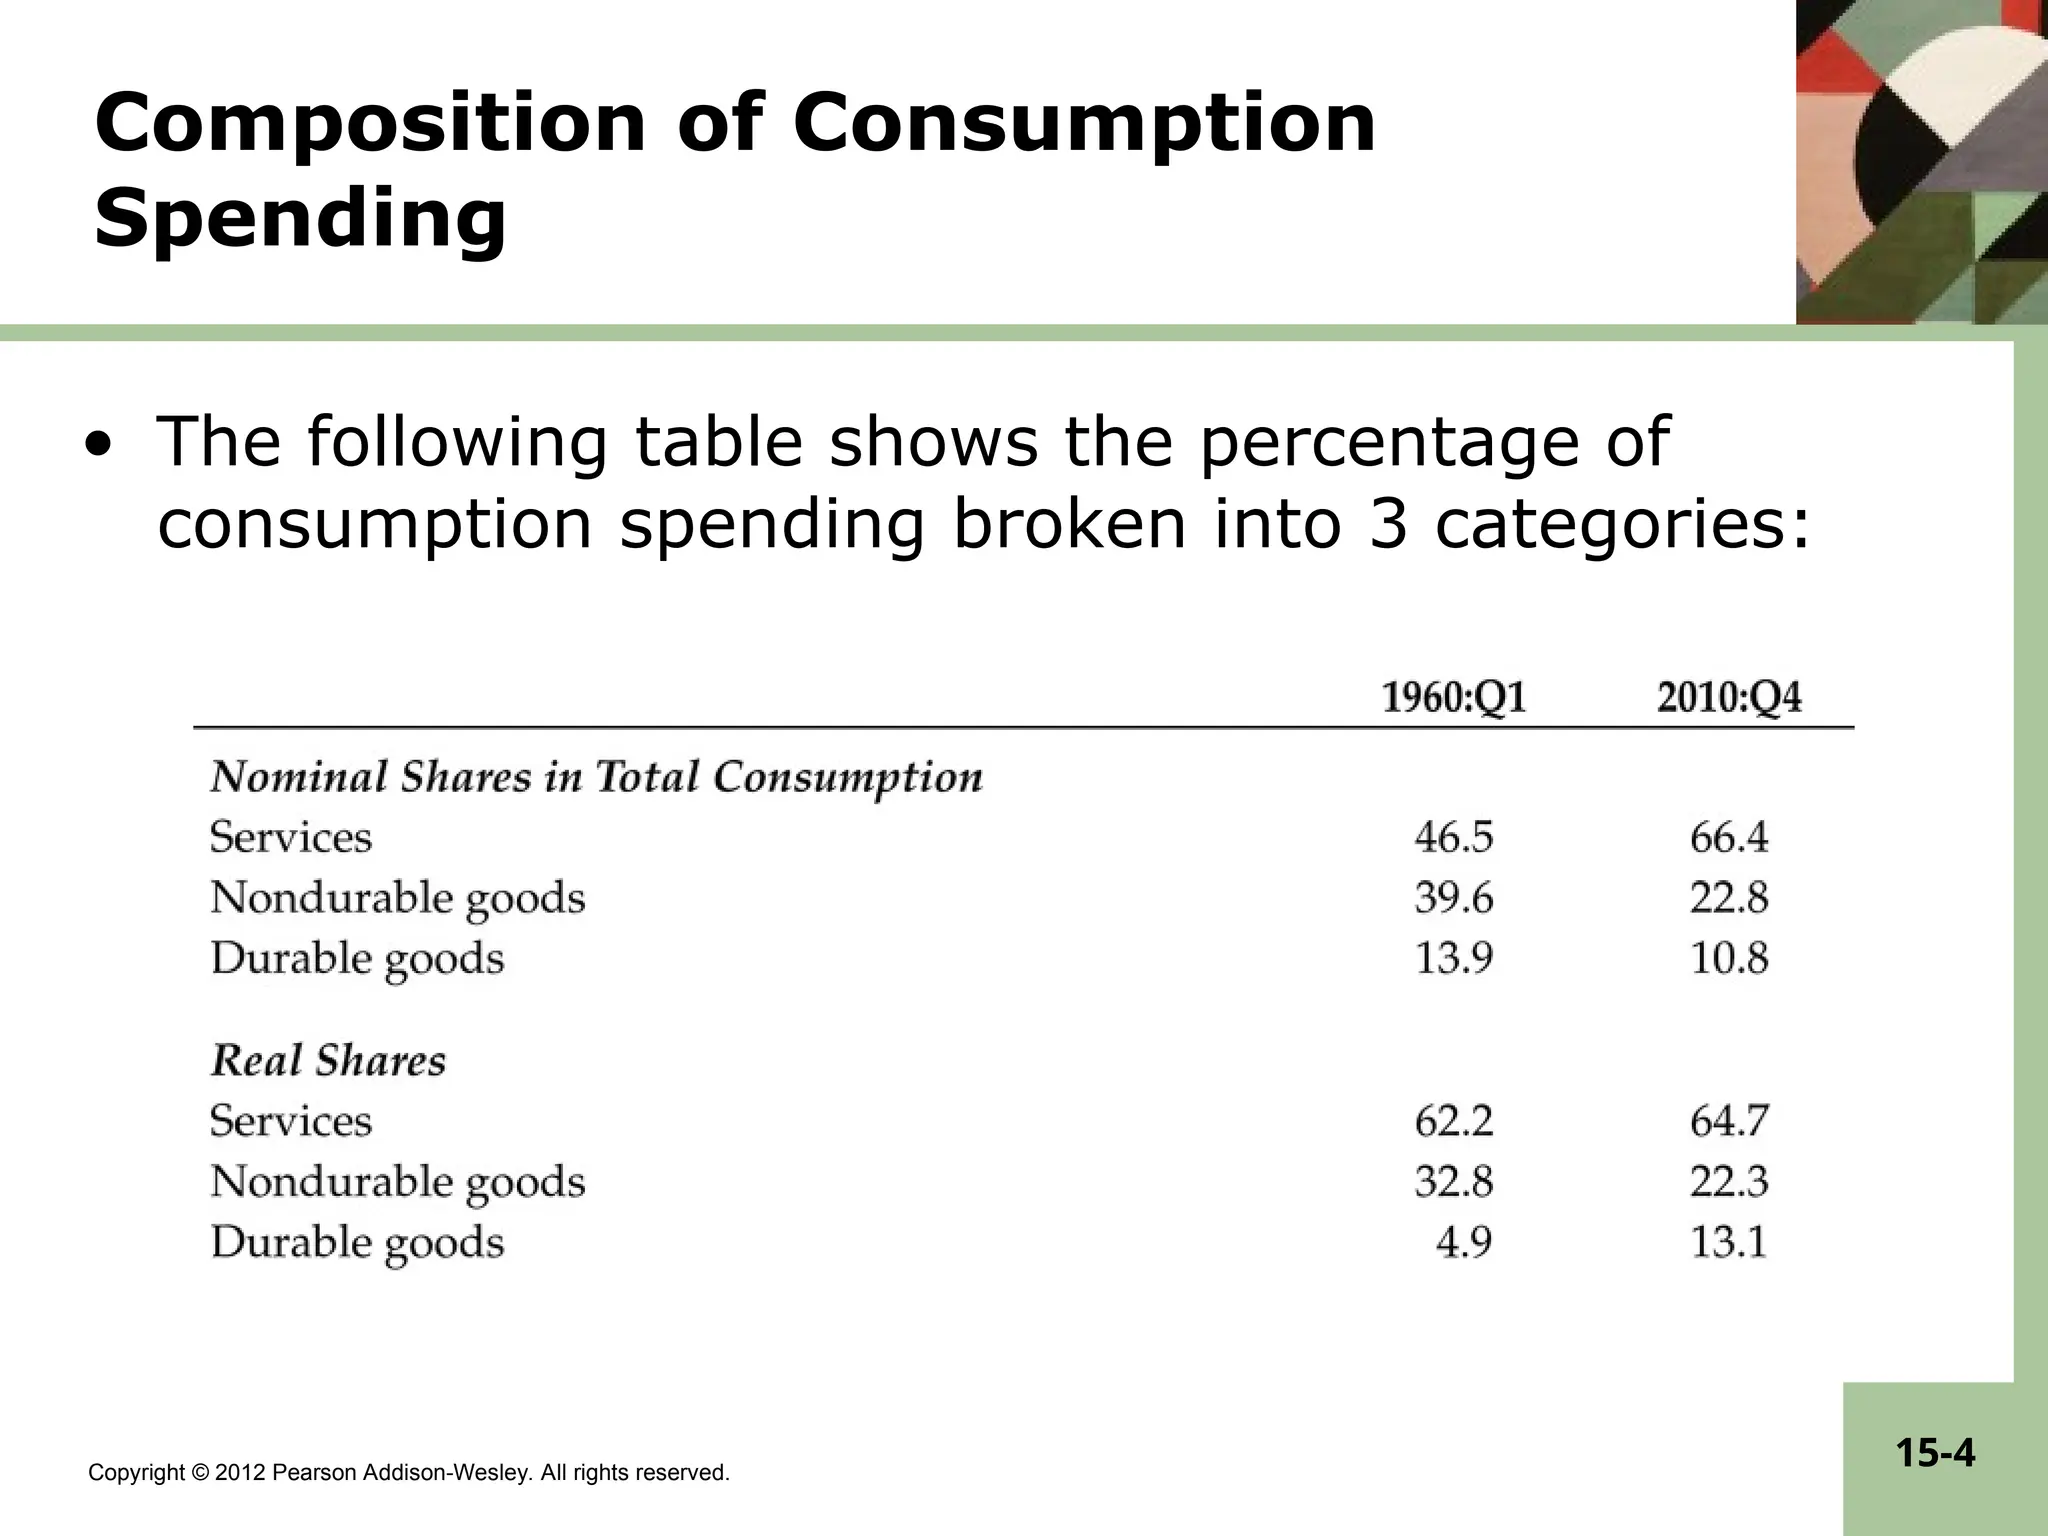
Pearson Addison-Wesley. All rights reserved. 15-4 Composition of Consumption Spending • The following table shows the percentage of consumption spending broken into 3 categories:
5.
Copyright © 2012
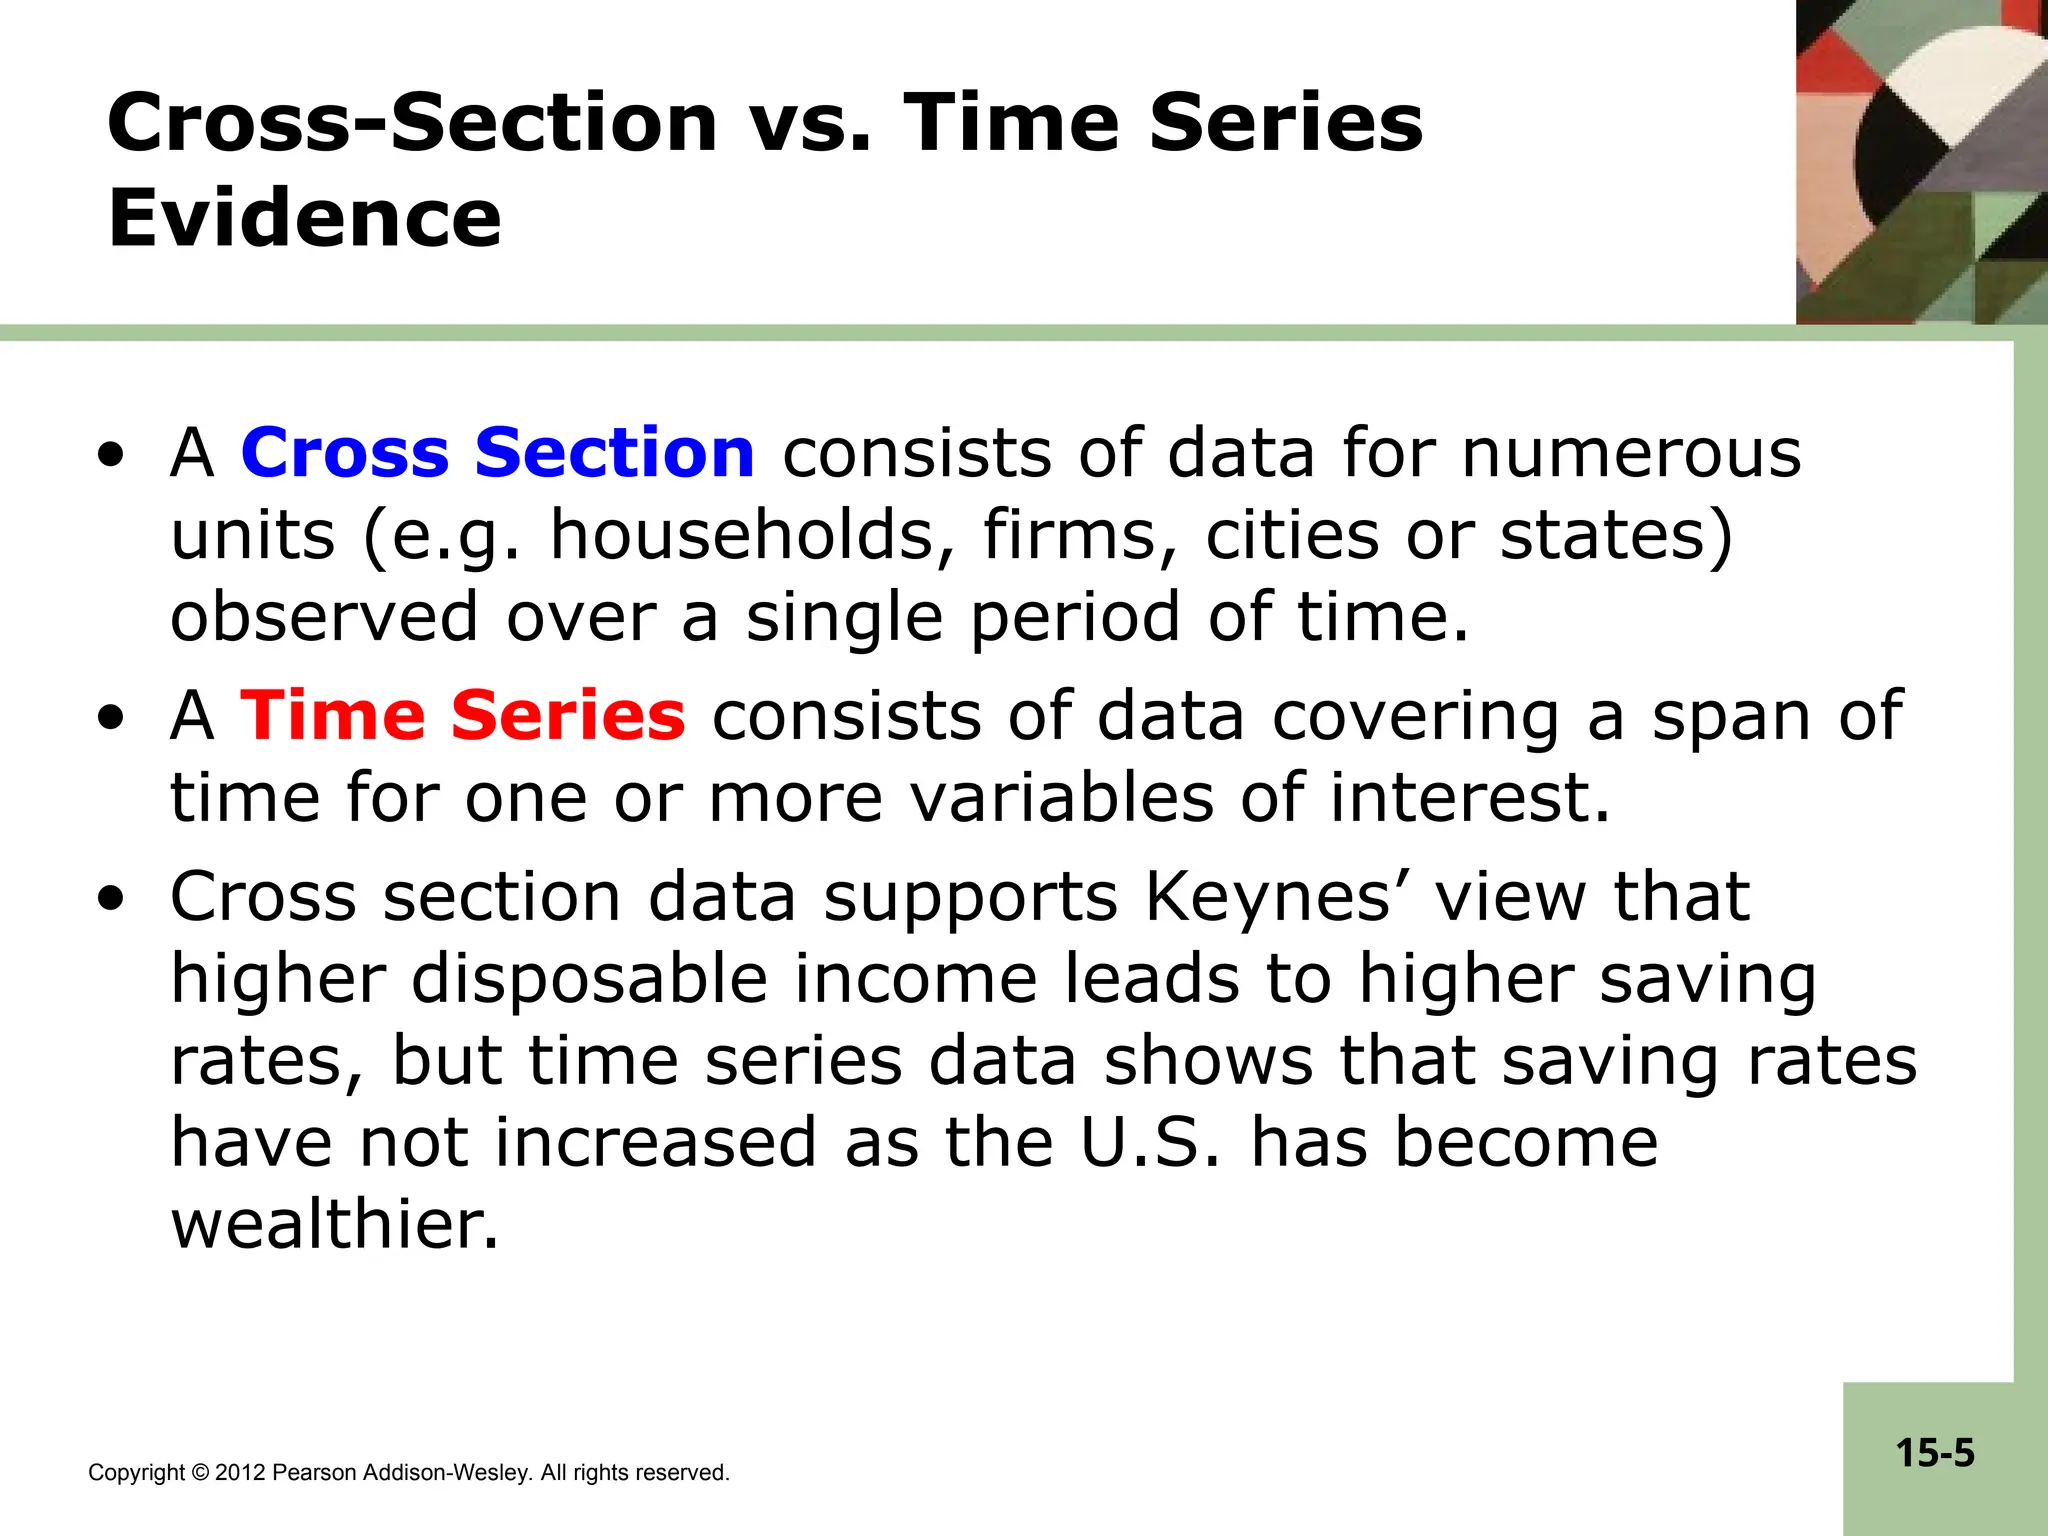
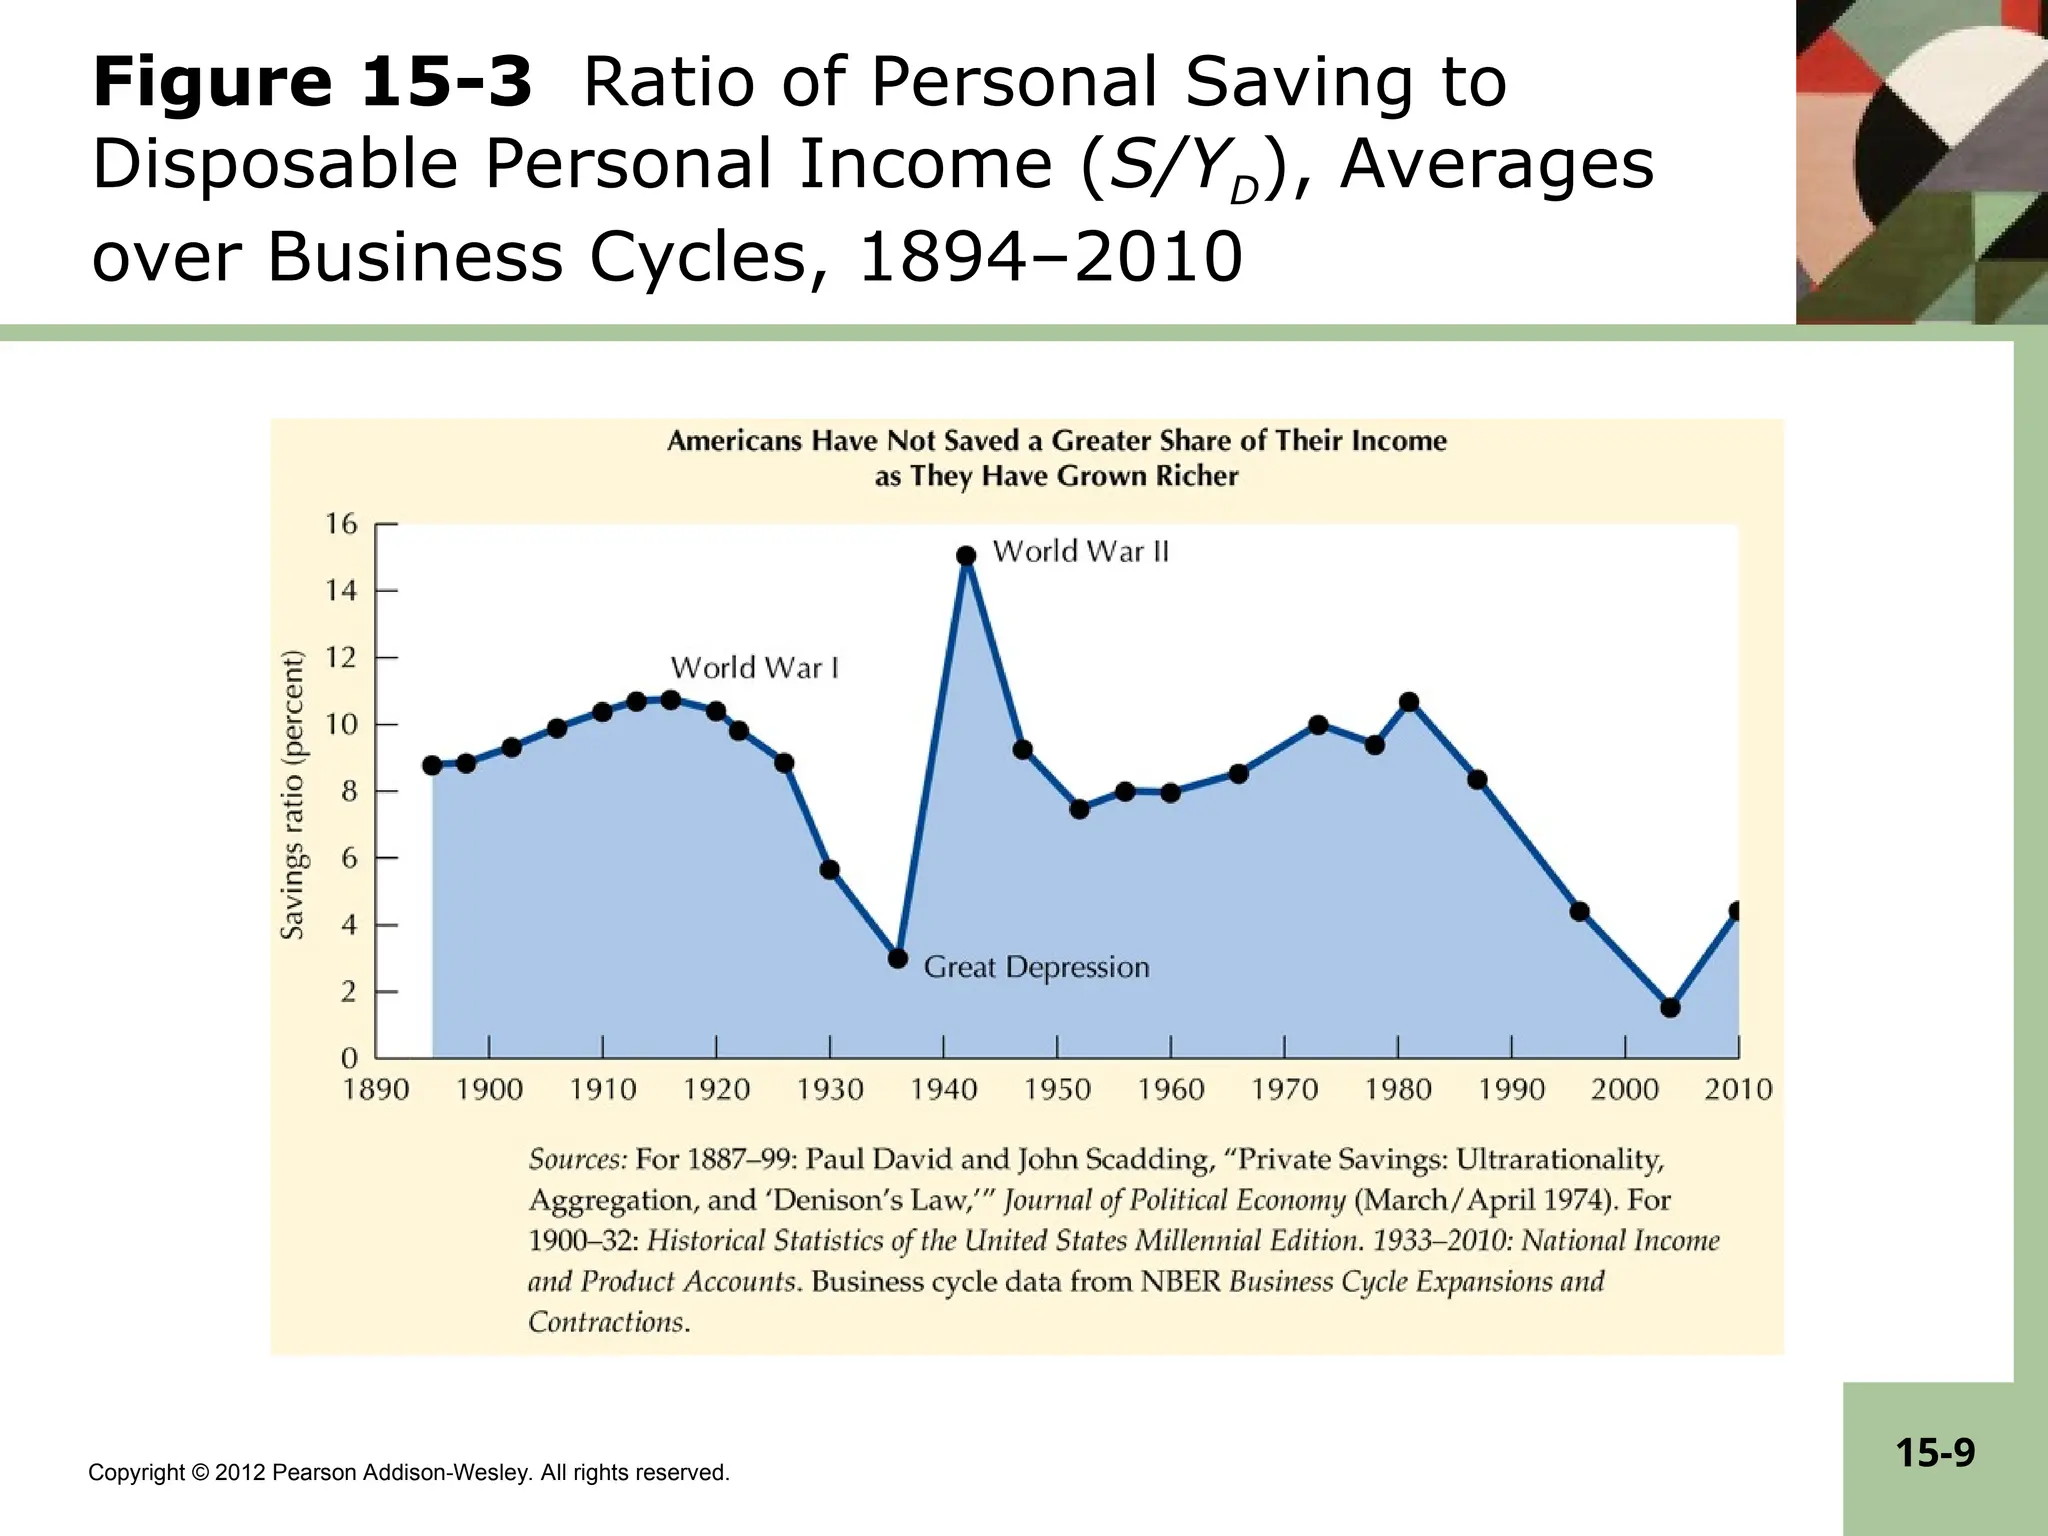
Pearson Addison-Wesley. All rights reserved. 15-5 Cross-Section vs. Time Series Evidence • A Cross Section consists of data for numerous units (e.g. households, firms, cities or states) observed over a single period of time. • A Time Series consists of data covering a span of time for one or more variables of interest. • Cross section data supports Keynes’ view that higher disposable income leads to higher saving rates, but time series data shows that saving rates have not increased as the U.S. has become wealthier.
6.
Copyright © 2012
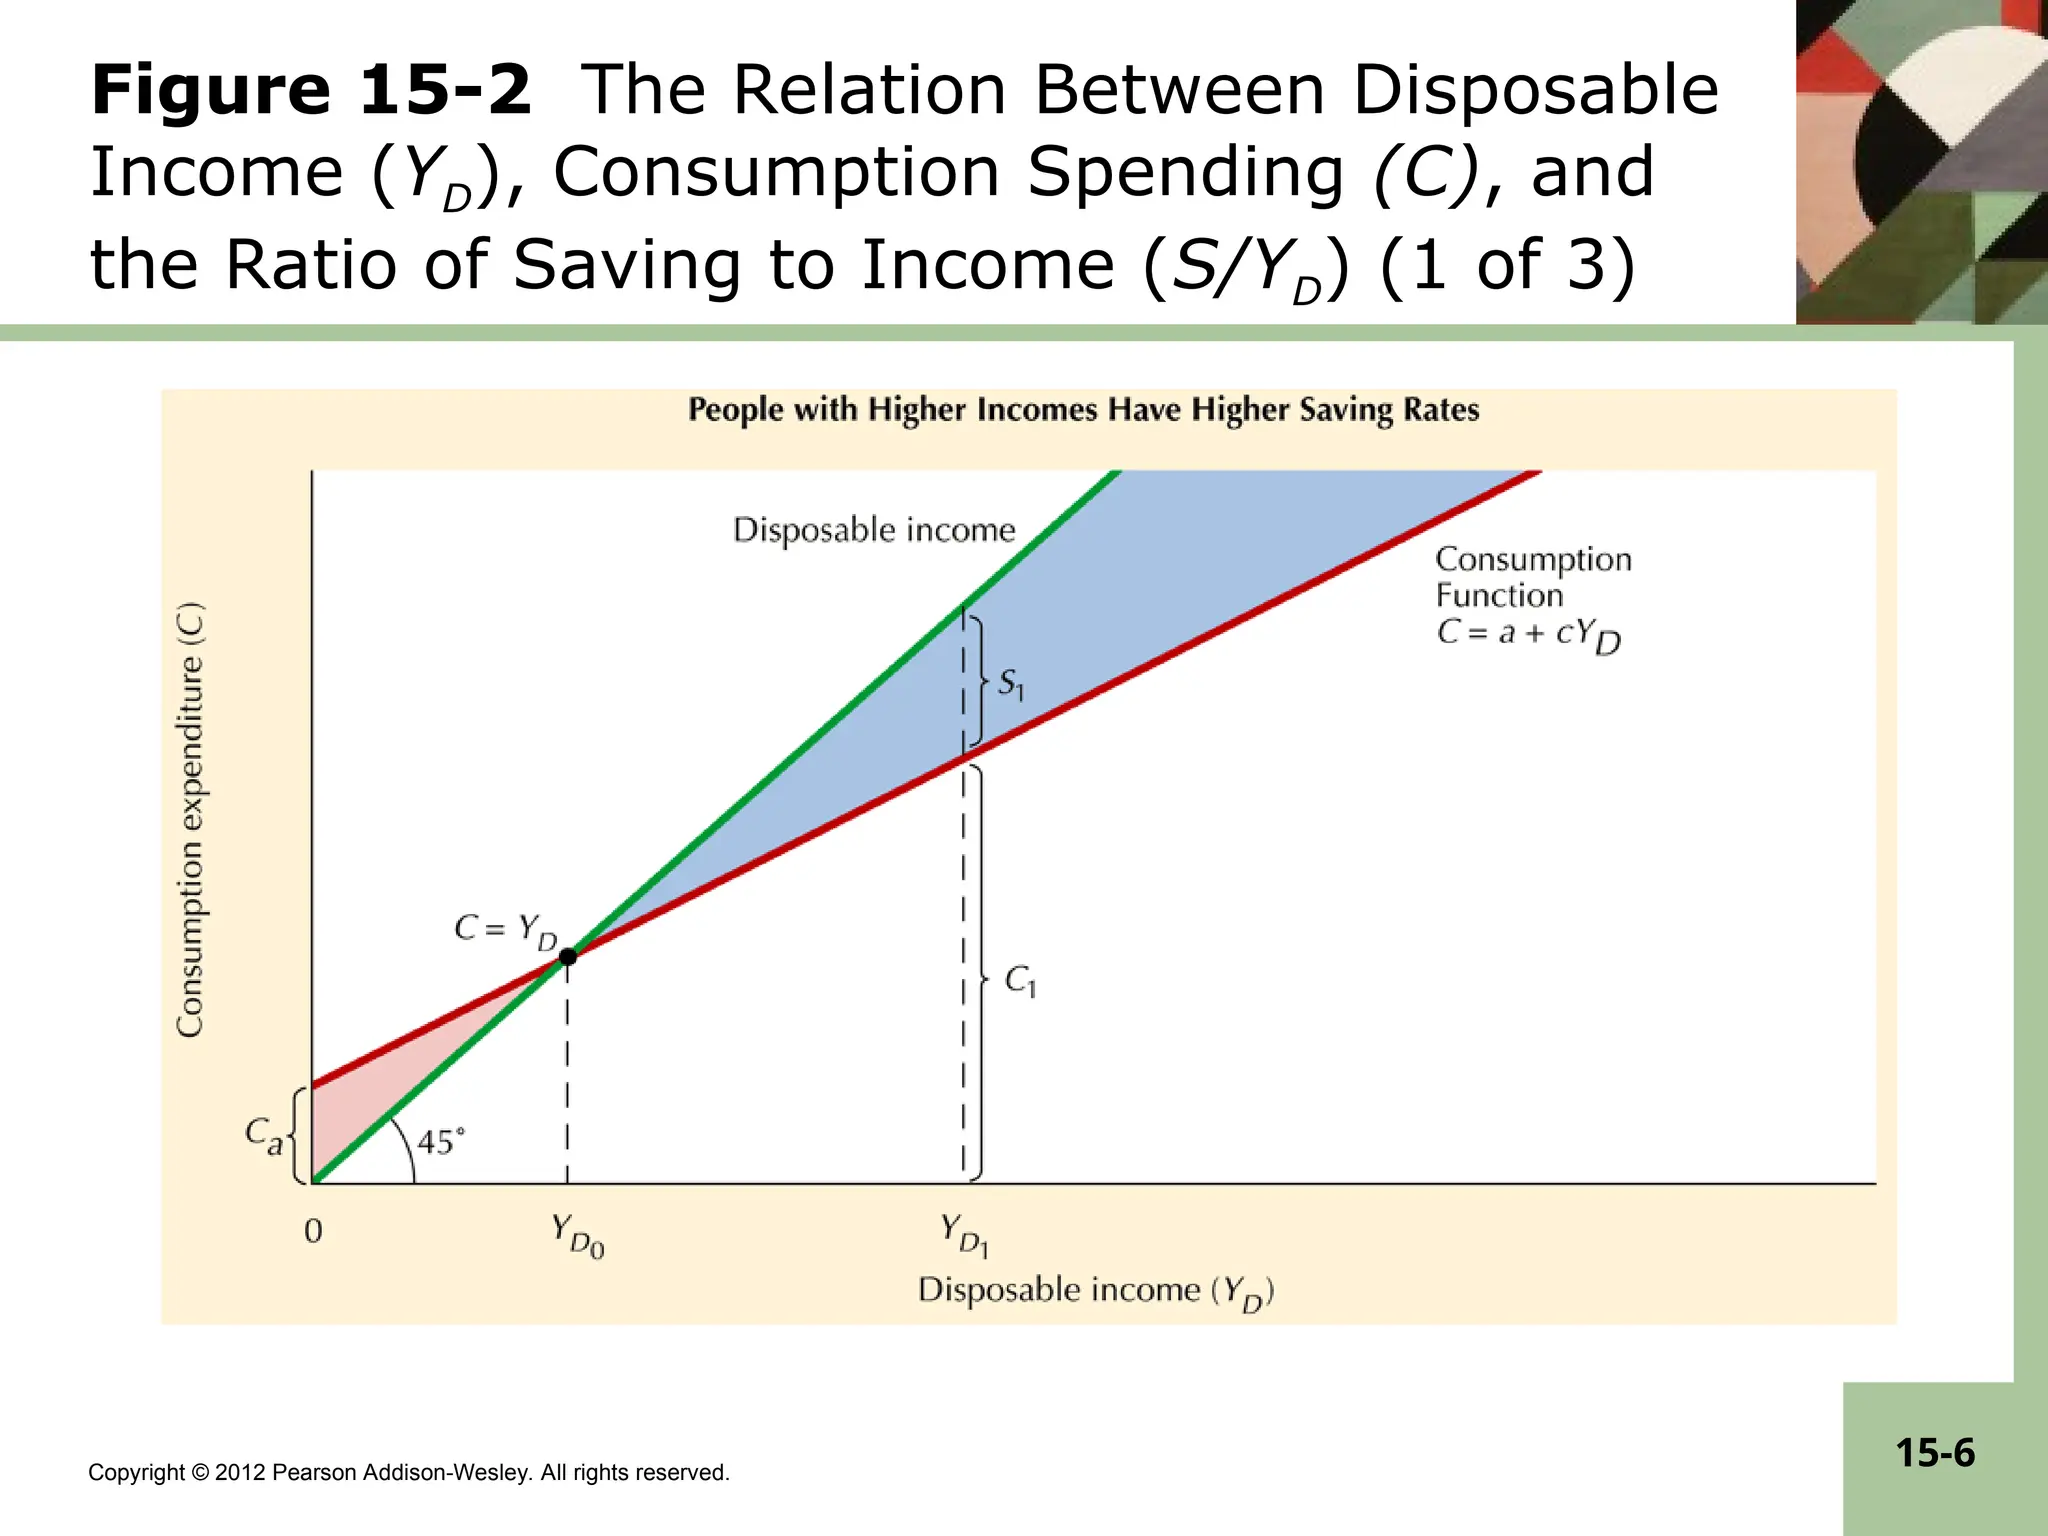
Pearson Addison-Wesley. All rights reserved. 15-6 Figure 15-2 The Relation Between Disposable Income (YD), Consumption Spending (C), and the Ratio of Saving to Income (S/YD) (1 of 3)
7.
Copyright © 2012
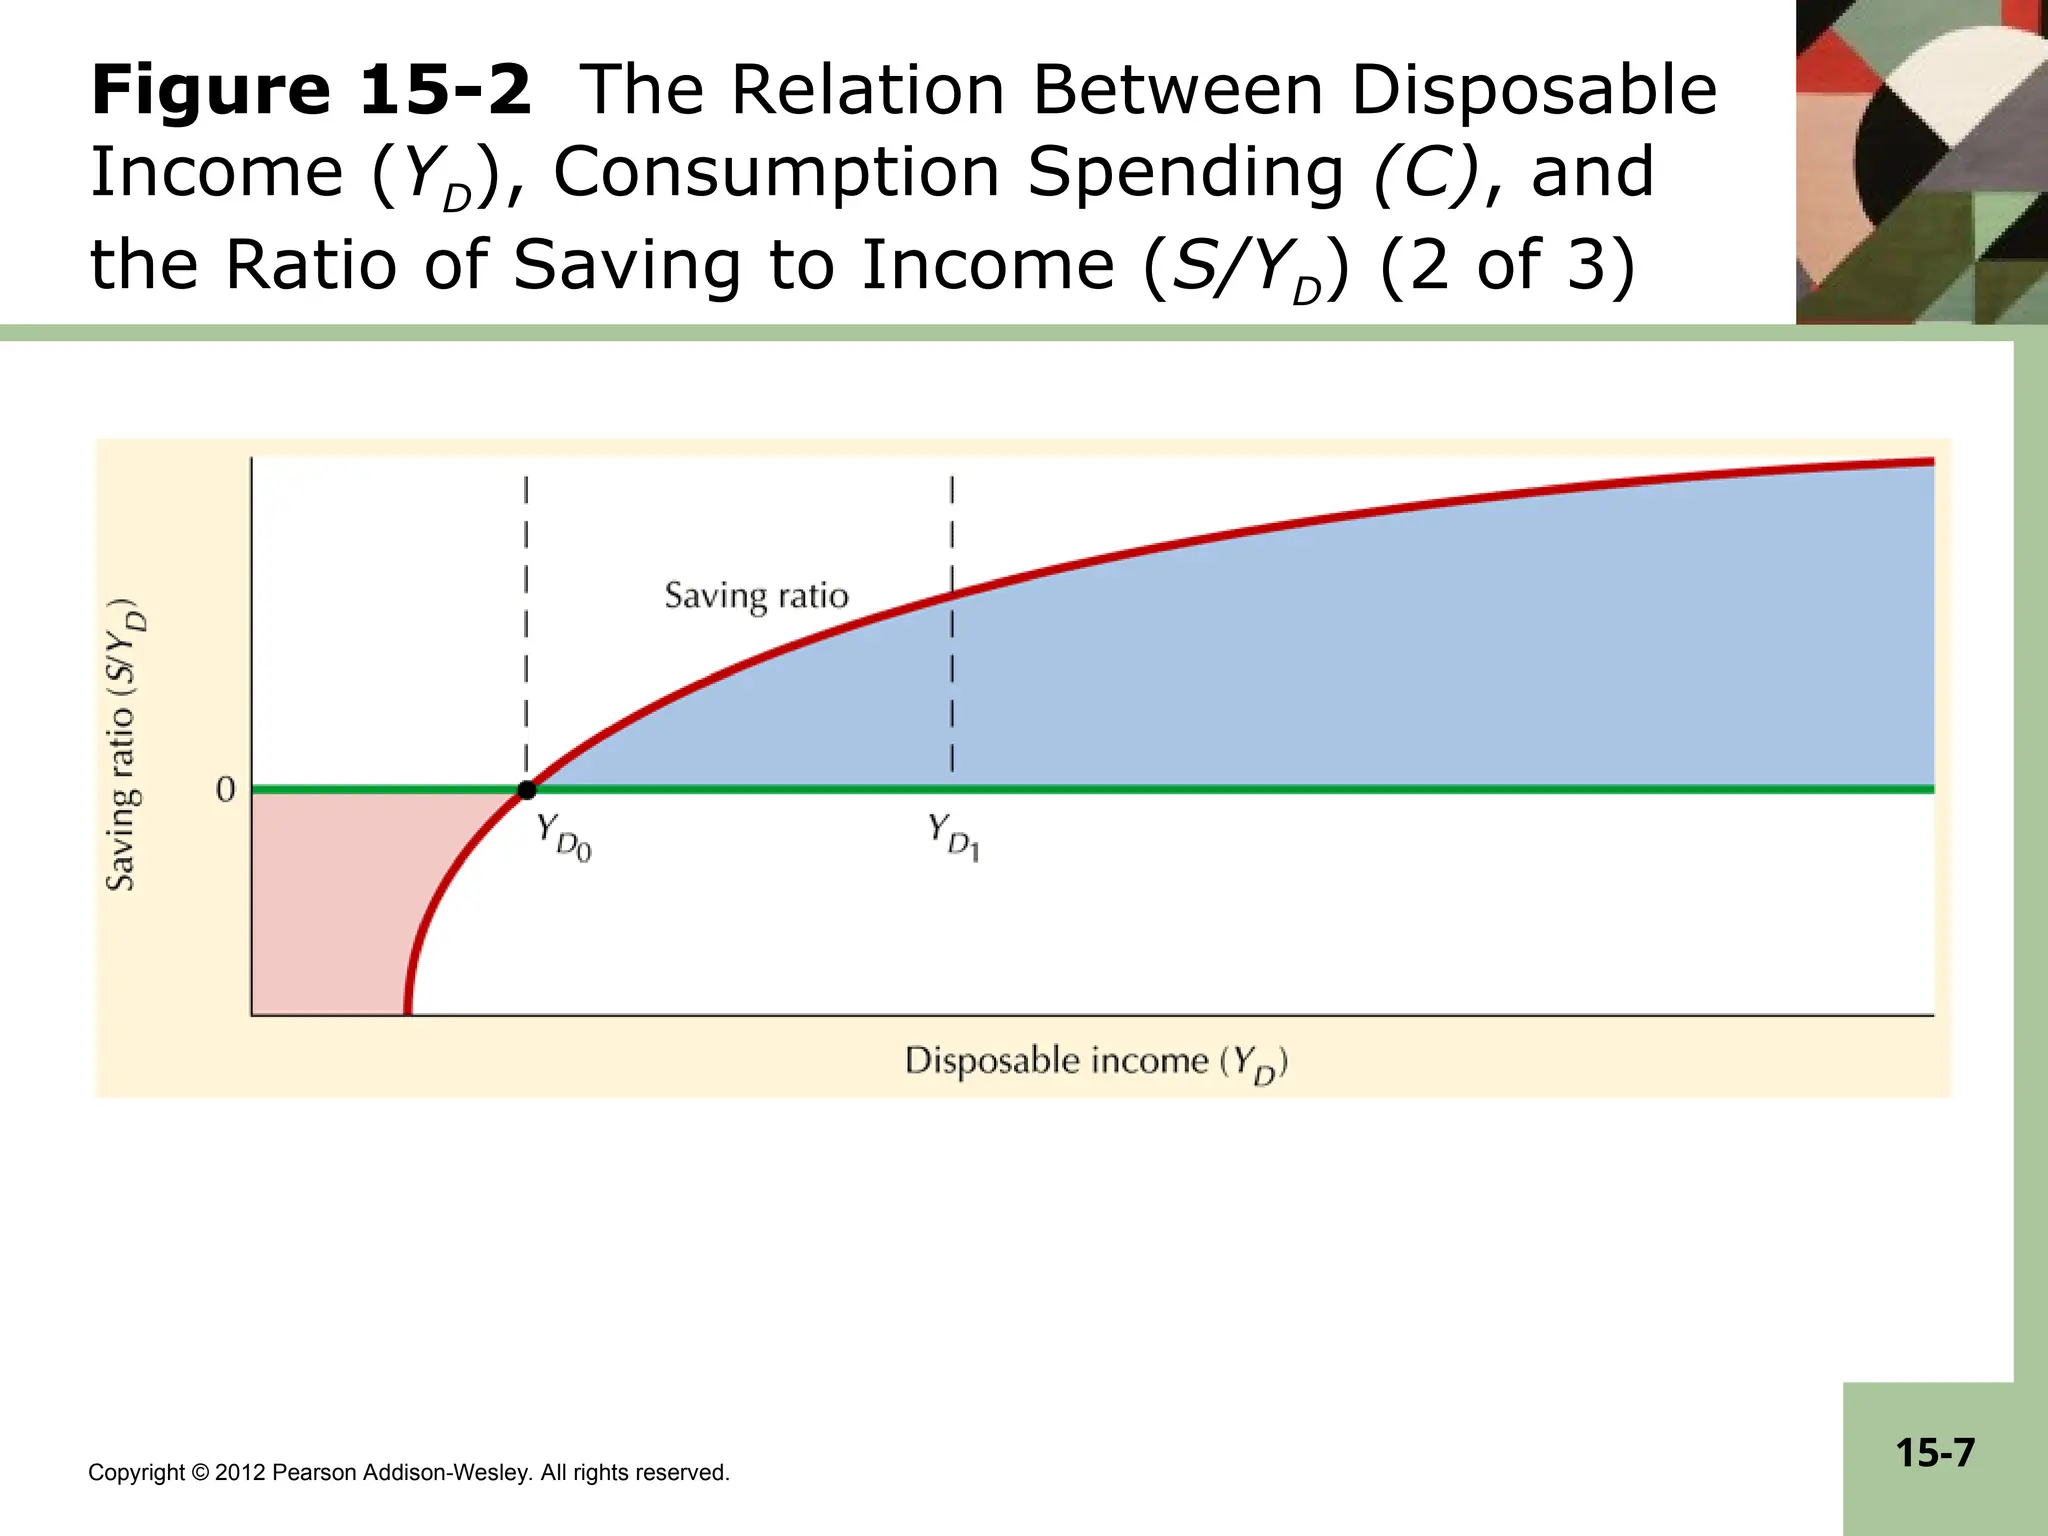
Pearson Addison-Wesley. All rights reserved. 15-7 Figure 15-2 The Relation Between Disposable Income (YD), Consumption Spending (C), and the Ratio of Saving to Income (S/YD) (2 of 3)
8.
Copyright © 2012
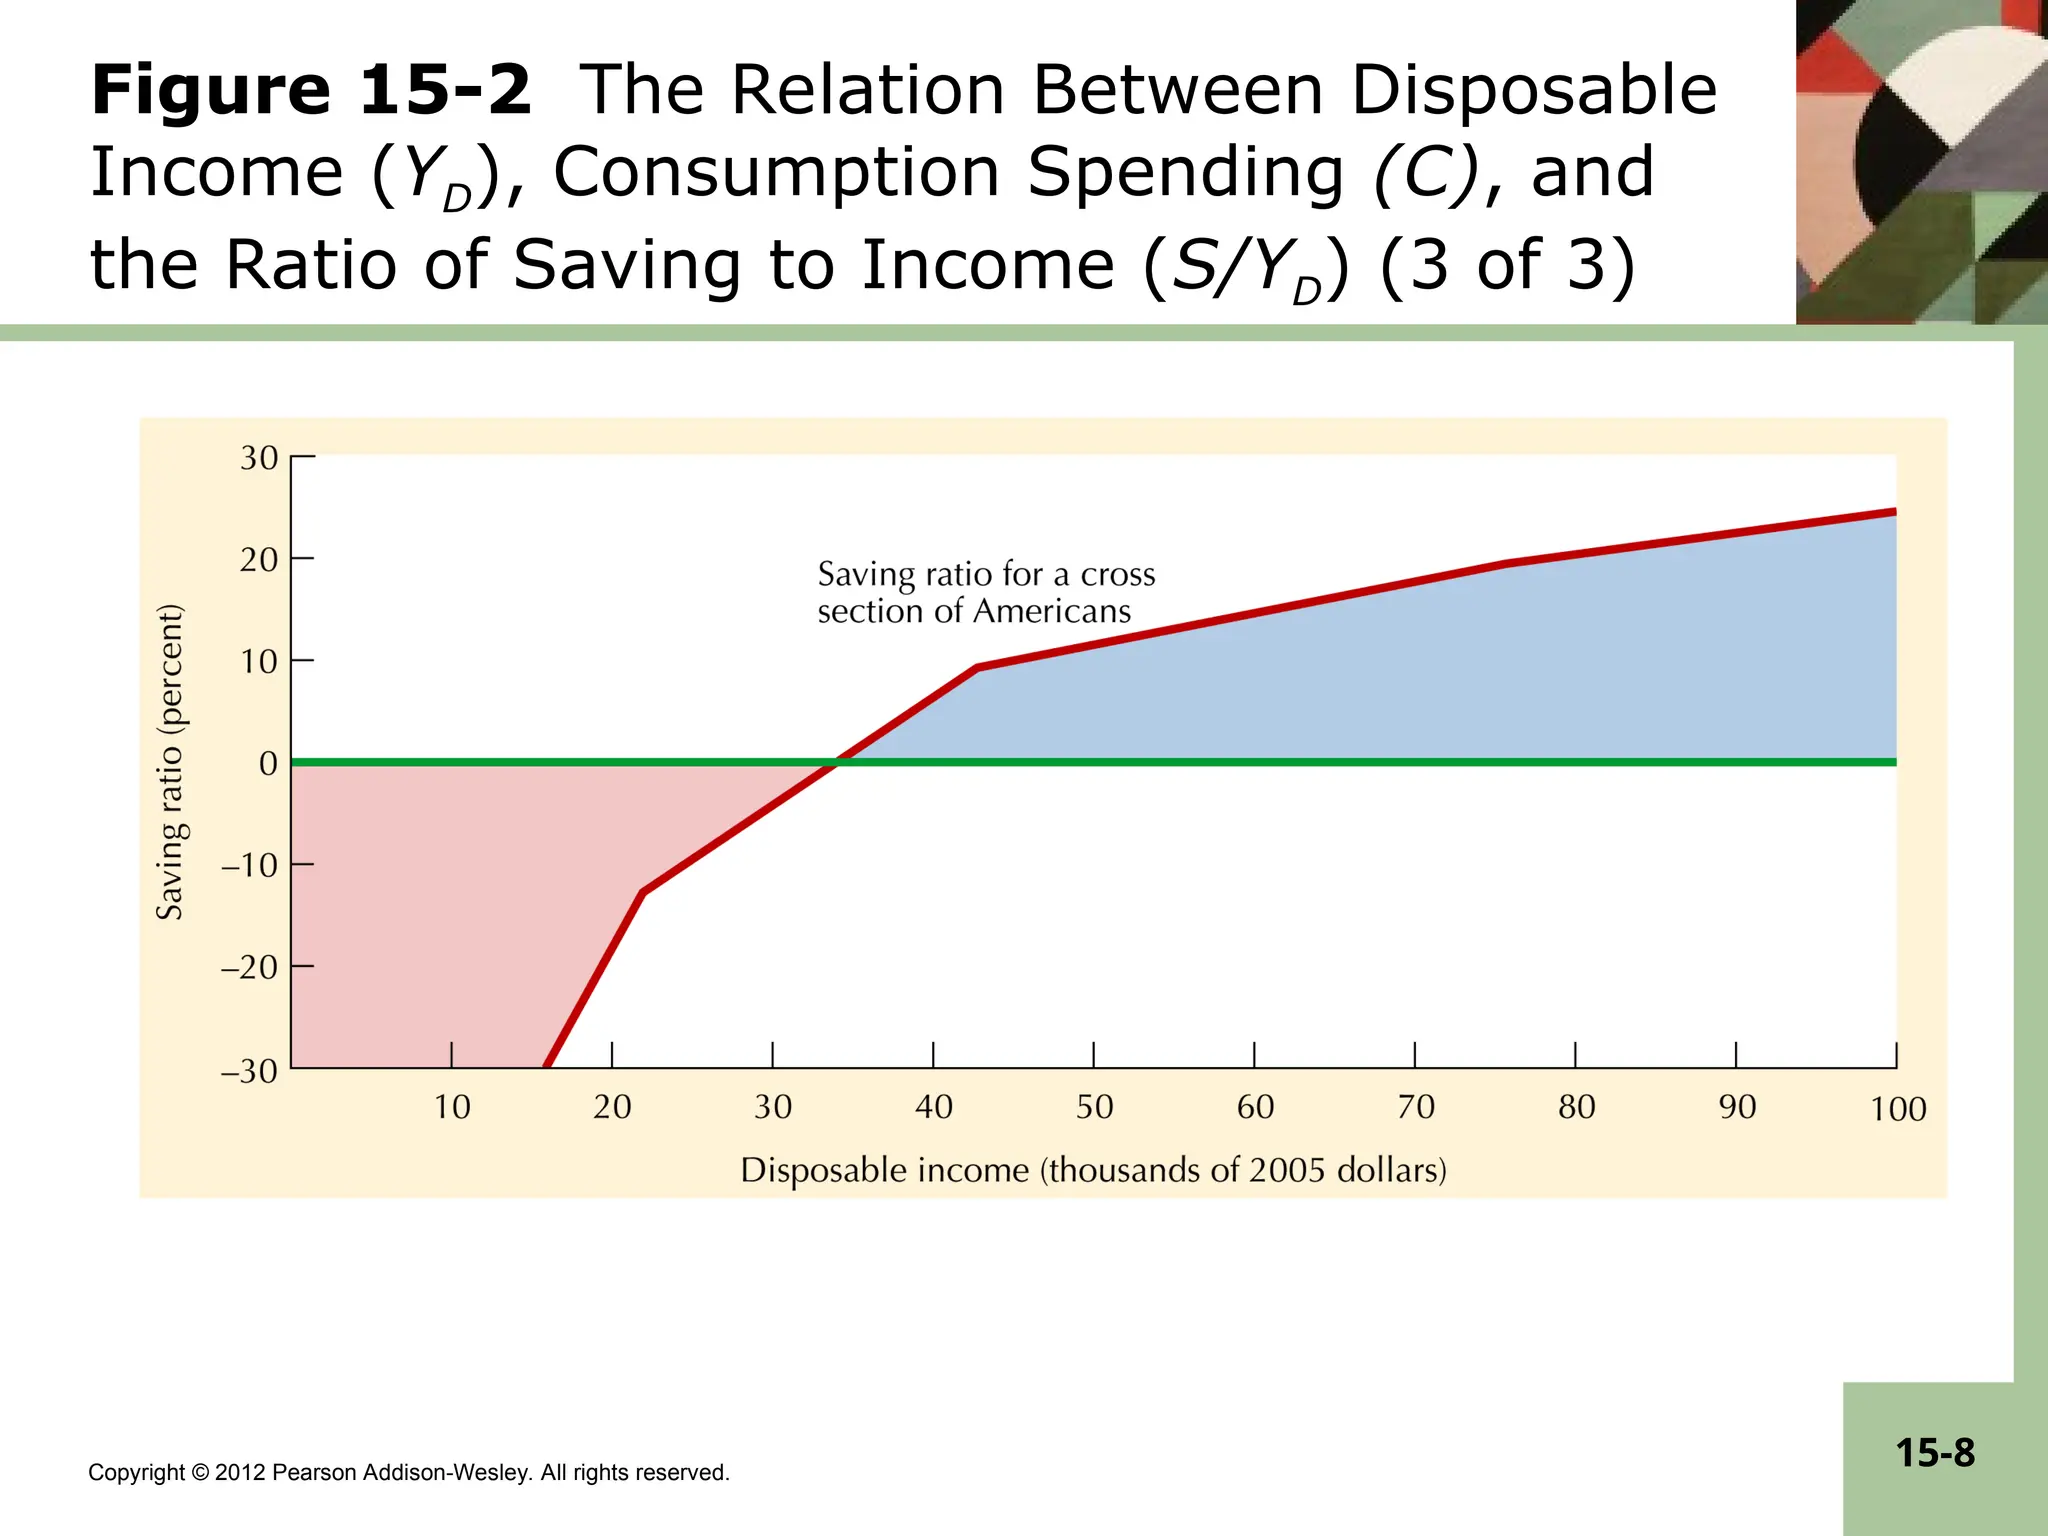
Pearson Addison-Wesley. All rights reserved. 15-8 Figure 15-2 The Relation Between Disposable Income (YD), Consumption Spending (C), and the Ratio of Saving to Income (S/YD) (3 of 3)
9.
Copyright © 2012
Pearson Addison-Wesley. All rights reserved. 15-9 Figure 15-3 Ratio of Personal Saving to Disposable Personal Income (S/YD), Averages over Business Cycles, 1894–2010
10.
Copyright © 2012
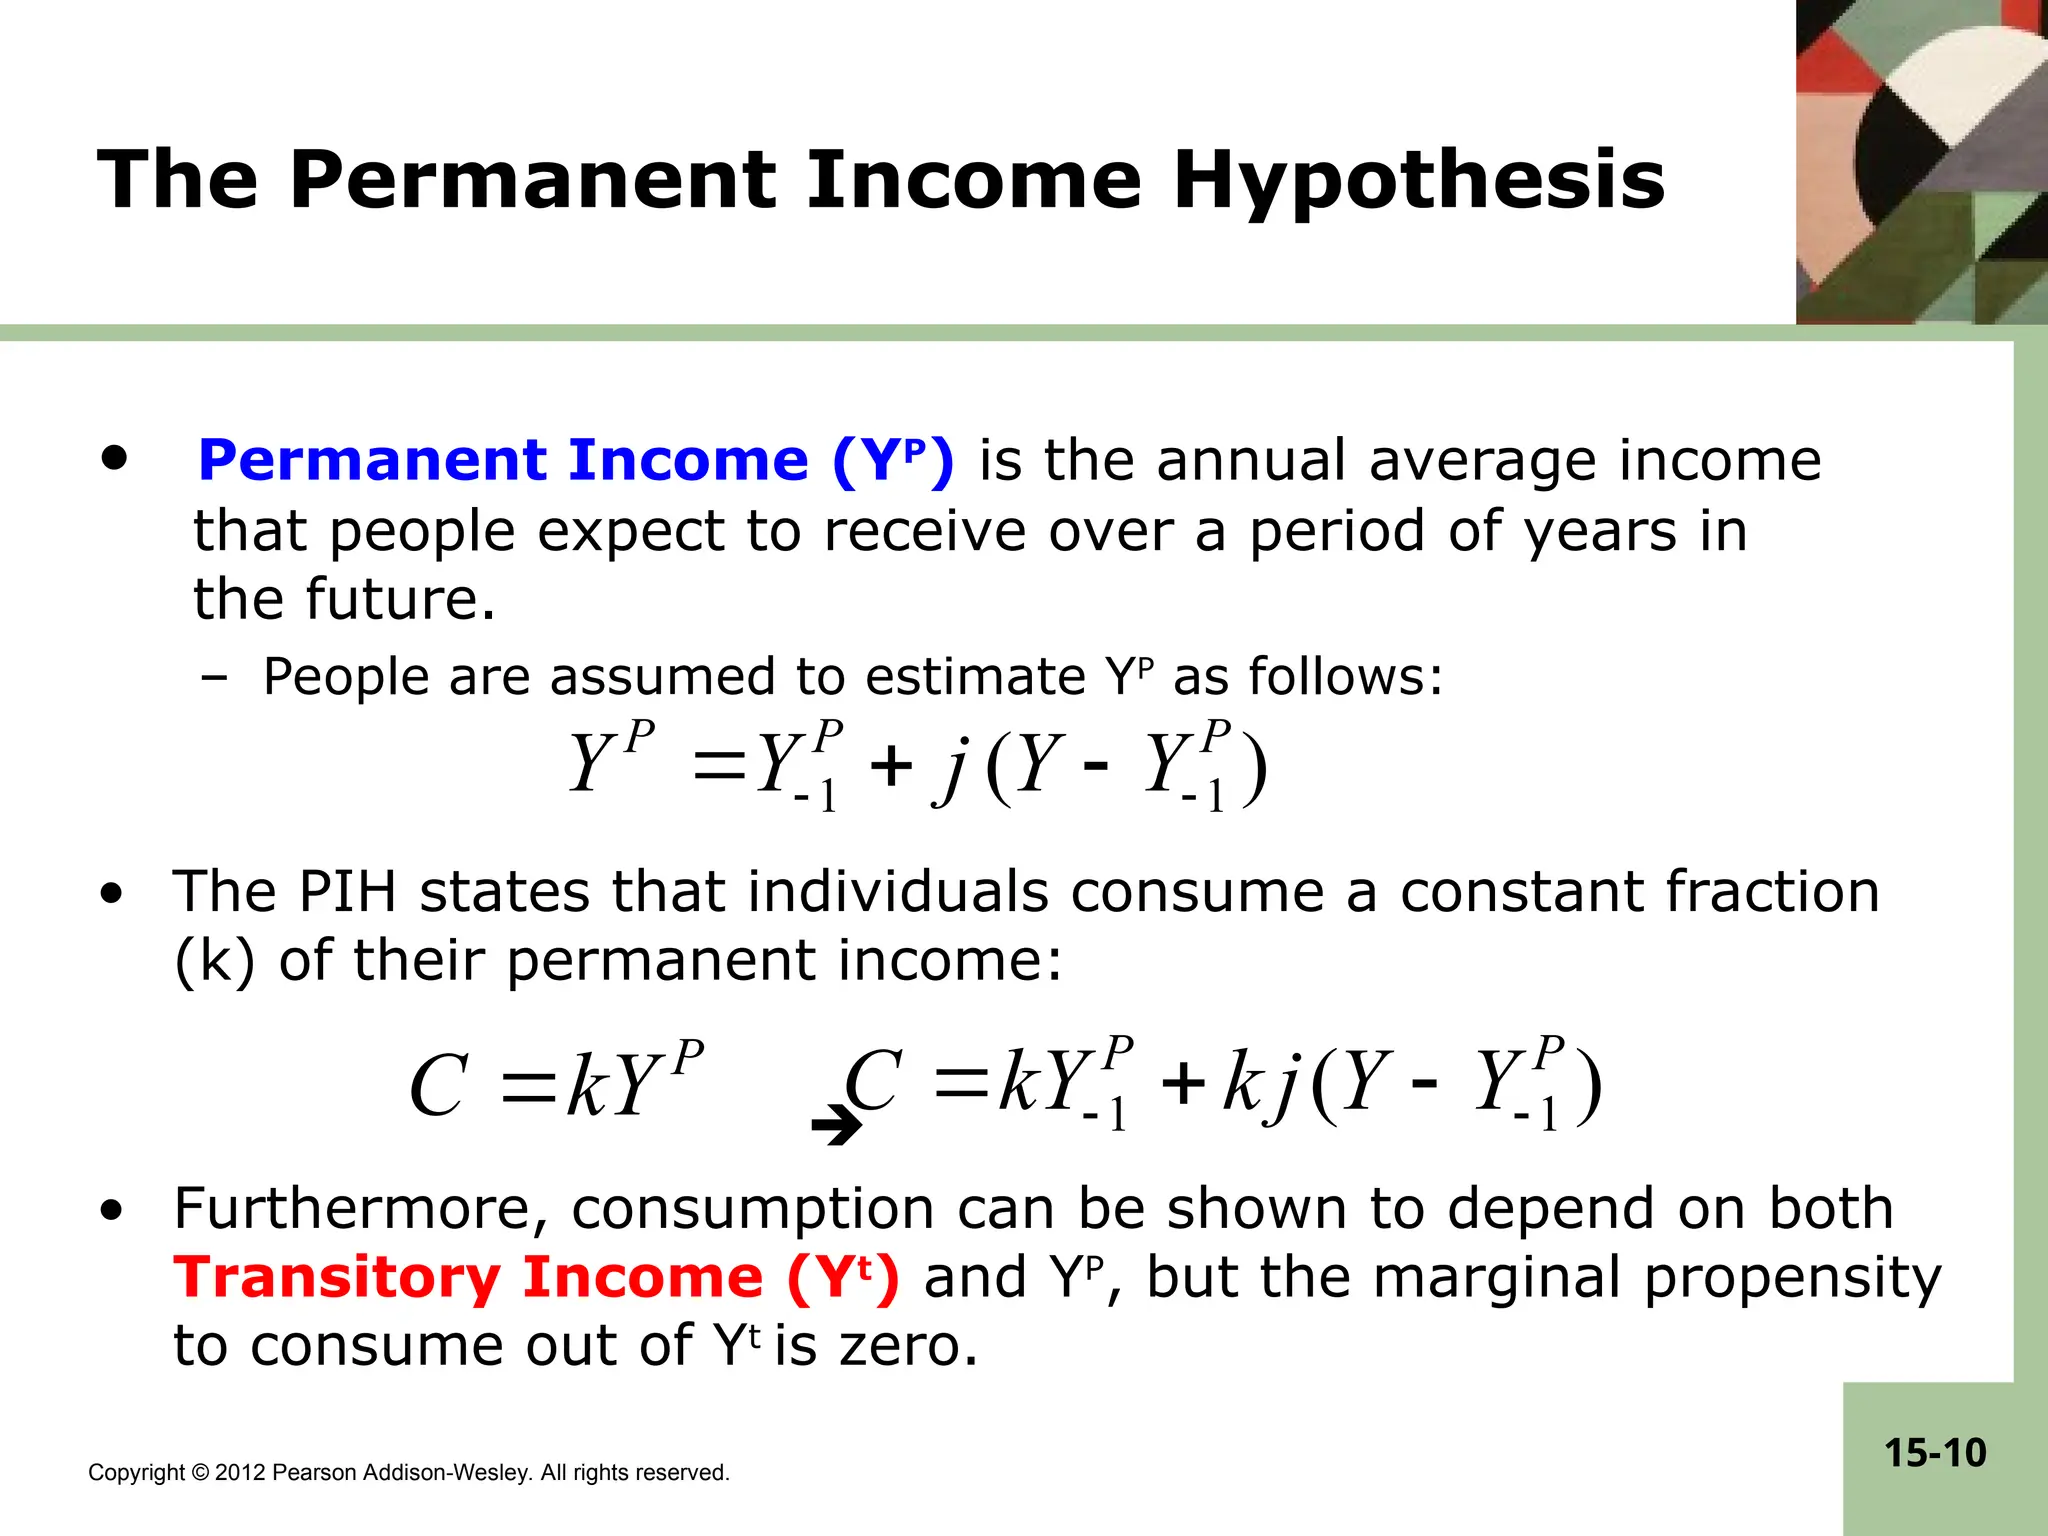
Pearson Addison-Wesley. All rights reserved. 15-10 The Permanent Income Hypothesis • Permanent Income (YP ) is the annual average income that people expect to receive over a period of years in the future. – People are assumed to estimate YP as follows: • The PIH states that individuals consume a constant fraction (k) of their permanent income: • Furthermore, consumption can be shown to depend on both Transitory Income (Yt ) and YP , but the marginal propensity to consume out of Yt is zero. ) ( 1 1 P P Y Y j k kY C P kY C ) ( 1 1 P P P Y Y j Y Y
11.
Copyright © 2012
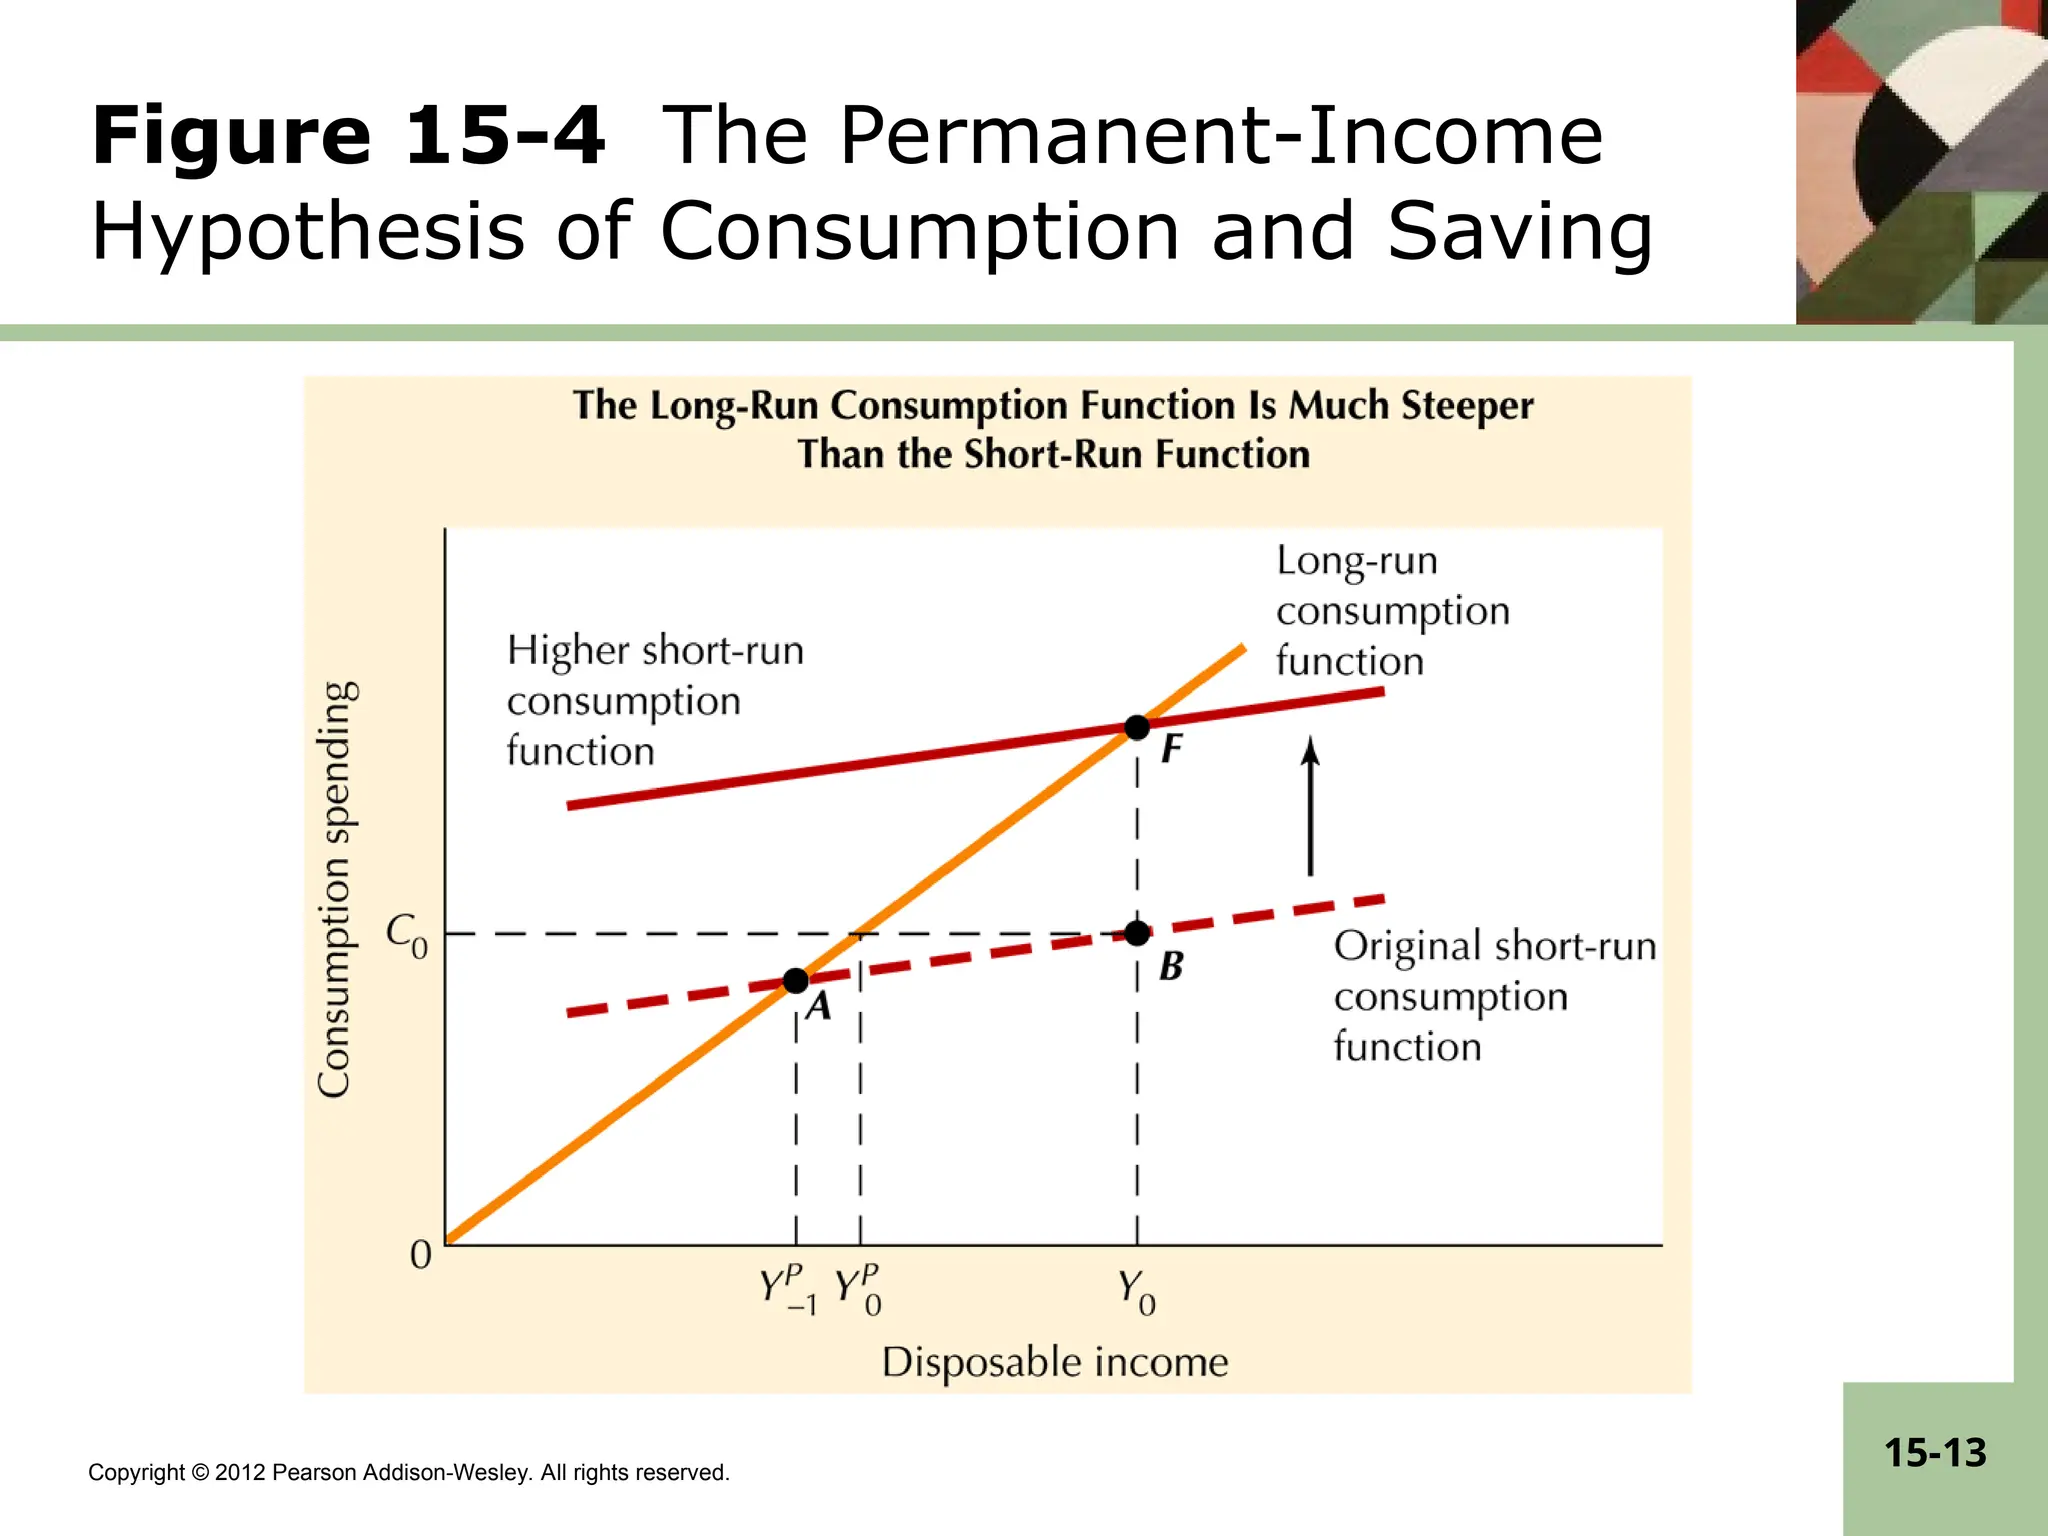
Pearson Addison-Wesley. All rights reserved. 15-11 The consumption function predicted by the PIH depends on last period’s permanent income and the deviation of this period’s actual income from last period’s permanent income and where k is the marginal propensity to consume out of permanent income and kj is the expectations adjustment coefficient. Emphasize the distinction between the long-run MPC given by k and the short-run MPC given by kj and their corresponding short-run and long-run consumption functions.
12.
Copyright © 2012
Pearson Addison-Wesley. All rights reserved. 15-12 Implications of the PIH • The motivation for the PIH was the conflict between cross-section data and time series data related to saving. • The PIH contends that the high saving ratios of high-income people are due to their having atypically large, positive, Yt . – Similarly, low-income people dissave because they are more likely than the average person to have actual incomes that are temporarily below their YP . • The long-run near-constancy of the saving ratio is due to the stability of YP .
13.
Copyright © 2012
Pearson Addison-Wesley. All rights reserved. 15-13 Figure 15-4 The Permanent-Income Hypothesis of Consumption and Saving
14.
Copyright © 2012
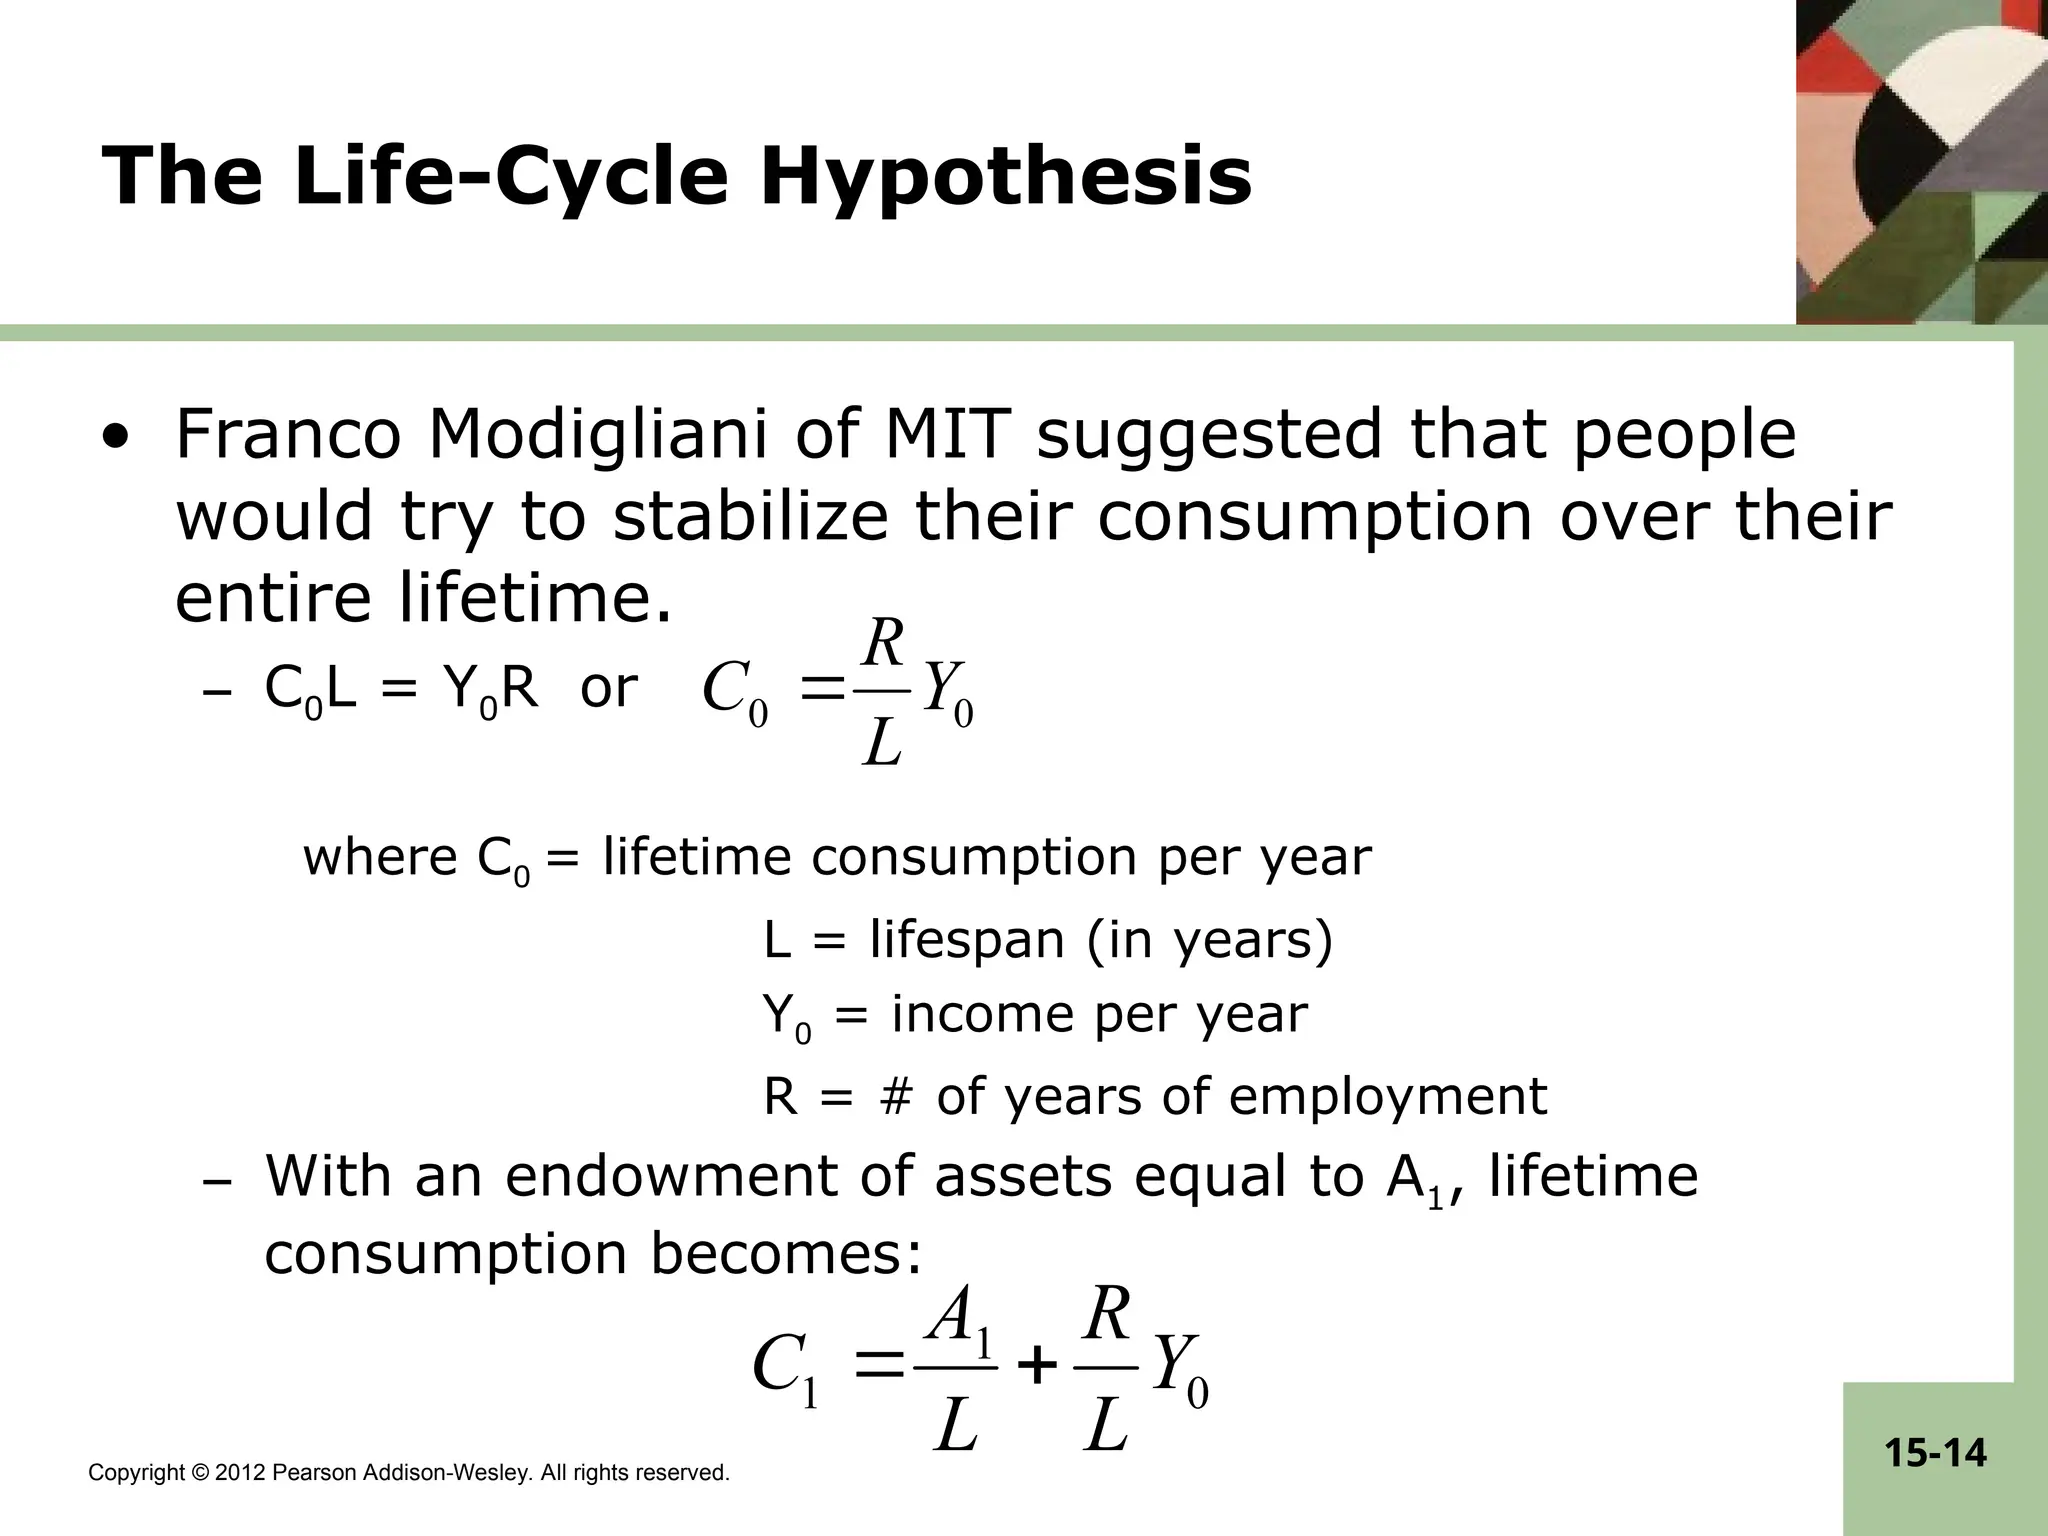
Pearson Addison-Wesley. All rights reserved. 15-14 The Life-Cycle Hypothesis • Franco Modigliani of MIT suggested that people would try to stabilize their consumption over their entire lifetime. – C0L = Y0R or where C0 = lifetime consumption per year L = lifespan (in years) Y0 = income per year R = # of years of employment – With an endowment of assets equal to A1, lifetime consumption becomes: 0 0 Y L R C 0 1 1 Y L R L A C
15.
Copyright © 2012
Pearson Addison-Wesley. All rights reserved. 15-15 Implications of the LCH • The life-cycle hypothesis can explain the positive association of saving and income, since the upward trend in per capita real GDP raises both the saving and income of those of working age relative to those who are retired. • A temporary increase in income in boom years will be consumed over one’s entire life leading to higher saving in boom years. • During the Global Economic Crisis, lower household net wealth caused consumption to fall.
16.
Copyright © 2012
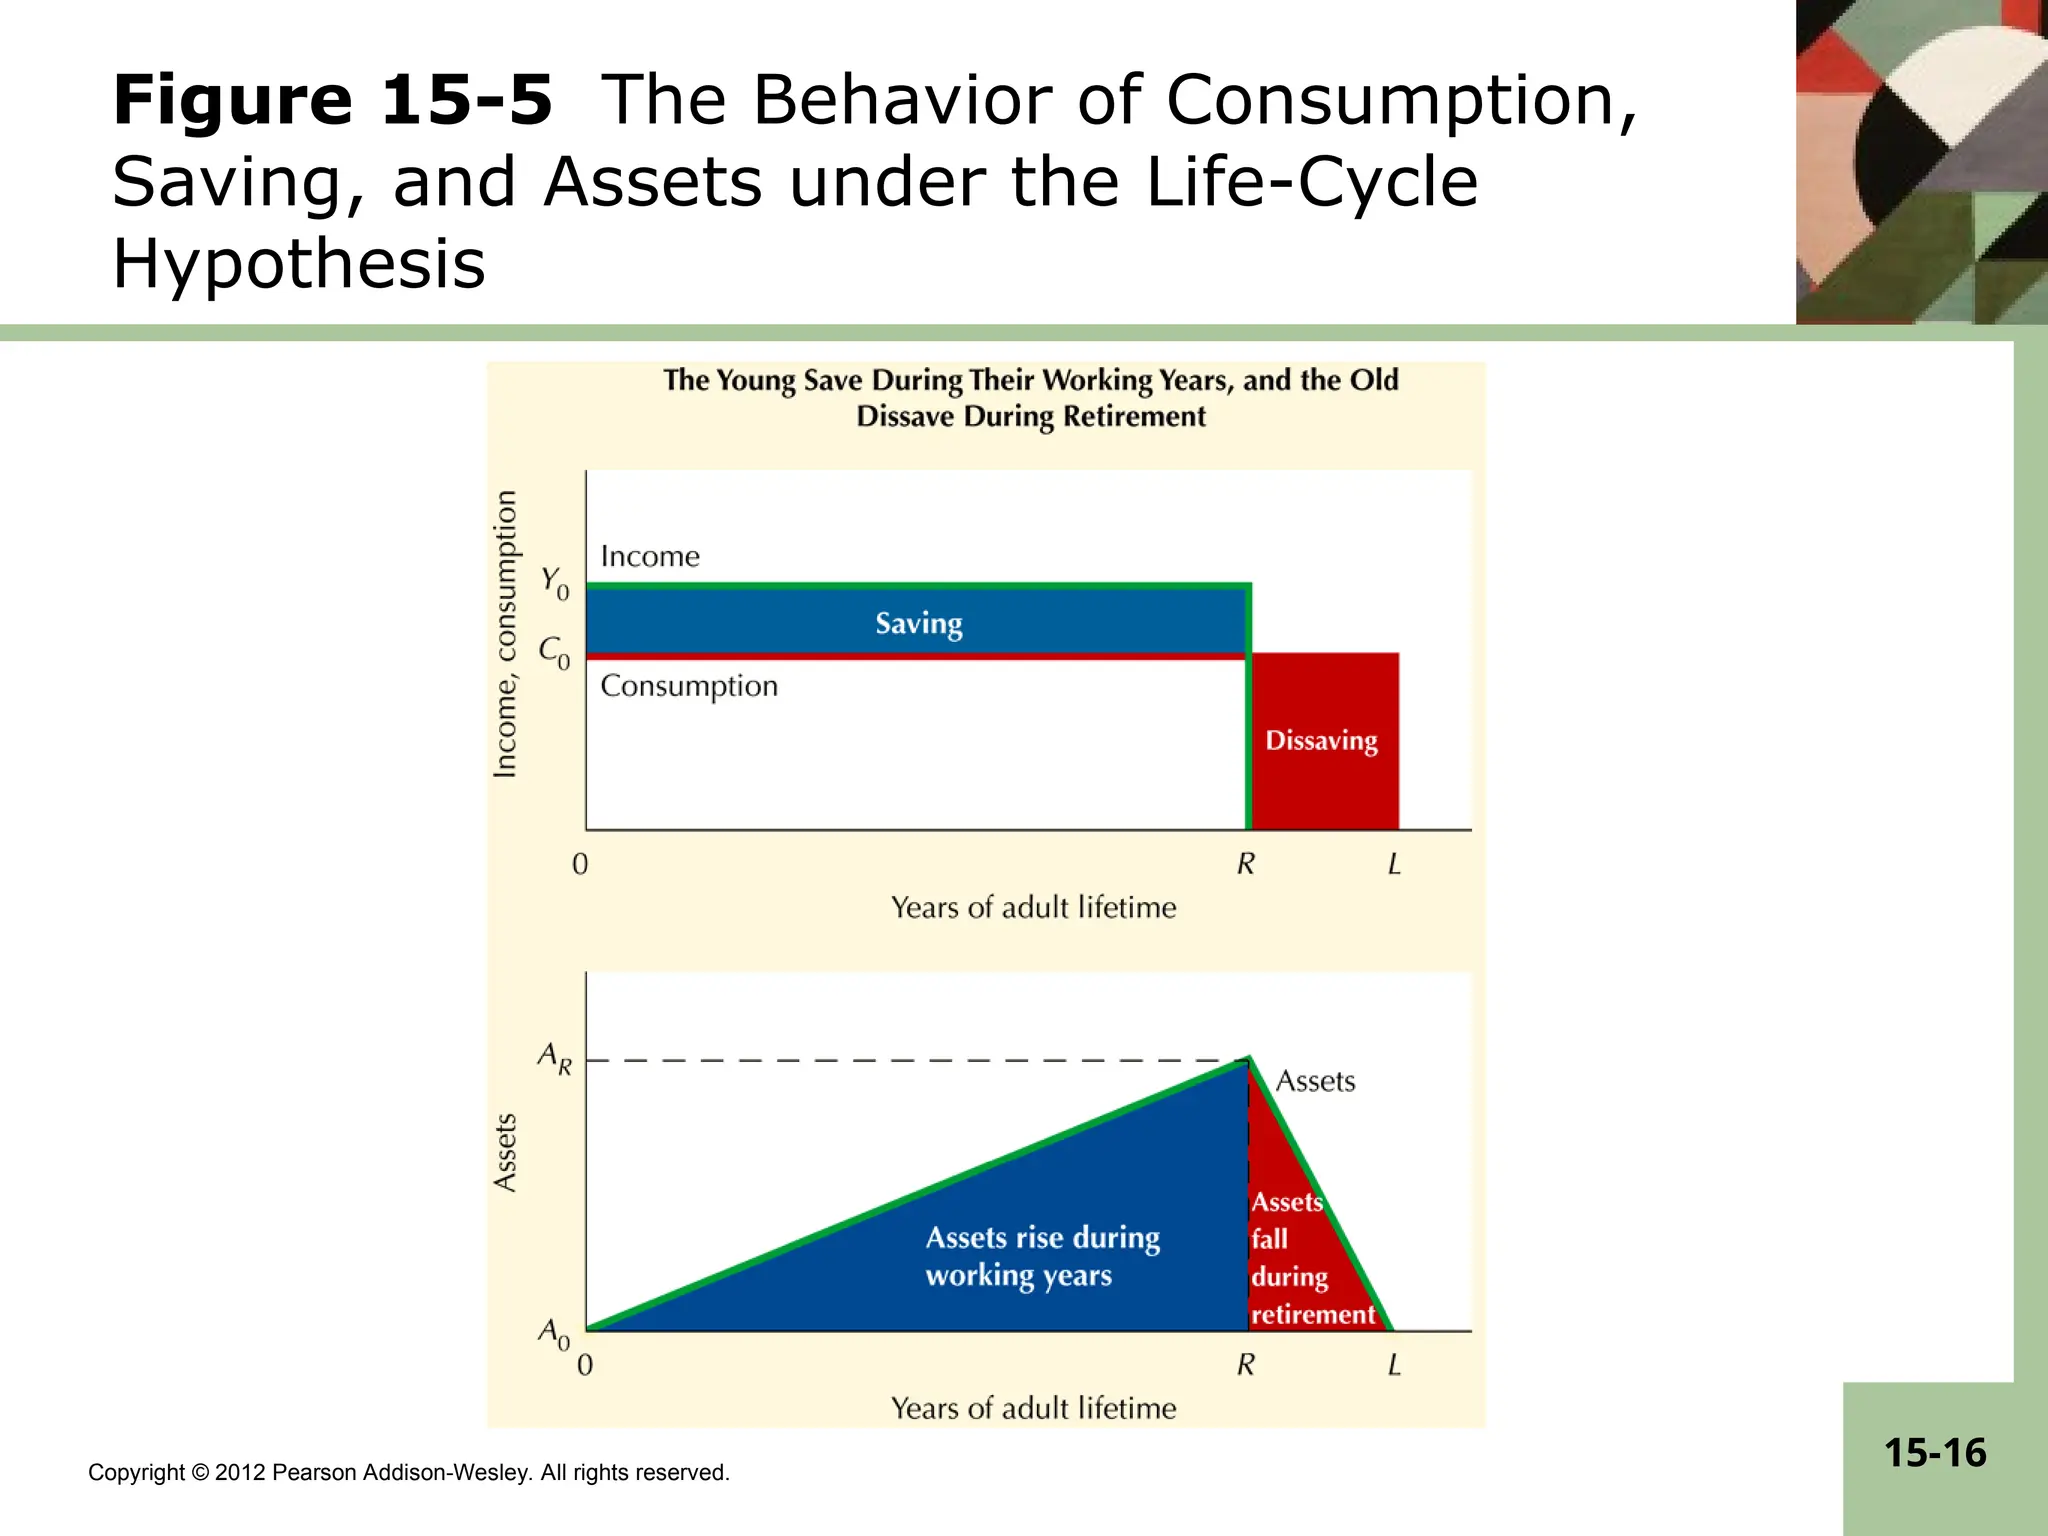
Pearson Addison-Wesley. All rights reserved. 15-16 Figure 15-5 The Behavior of Consumption, Saving, and Assets under the Life-Cycle Hypothesis
17.
Copyright © 2012
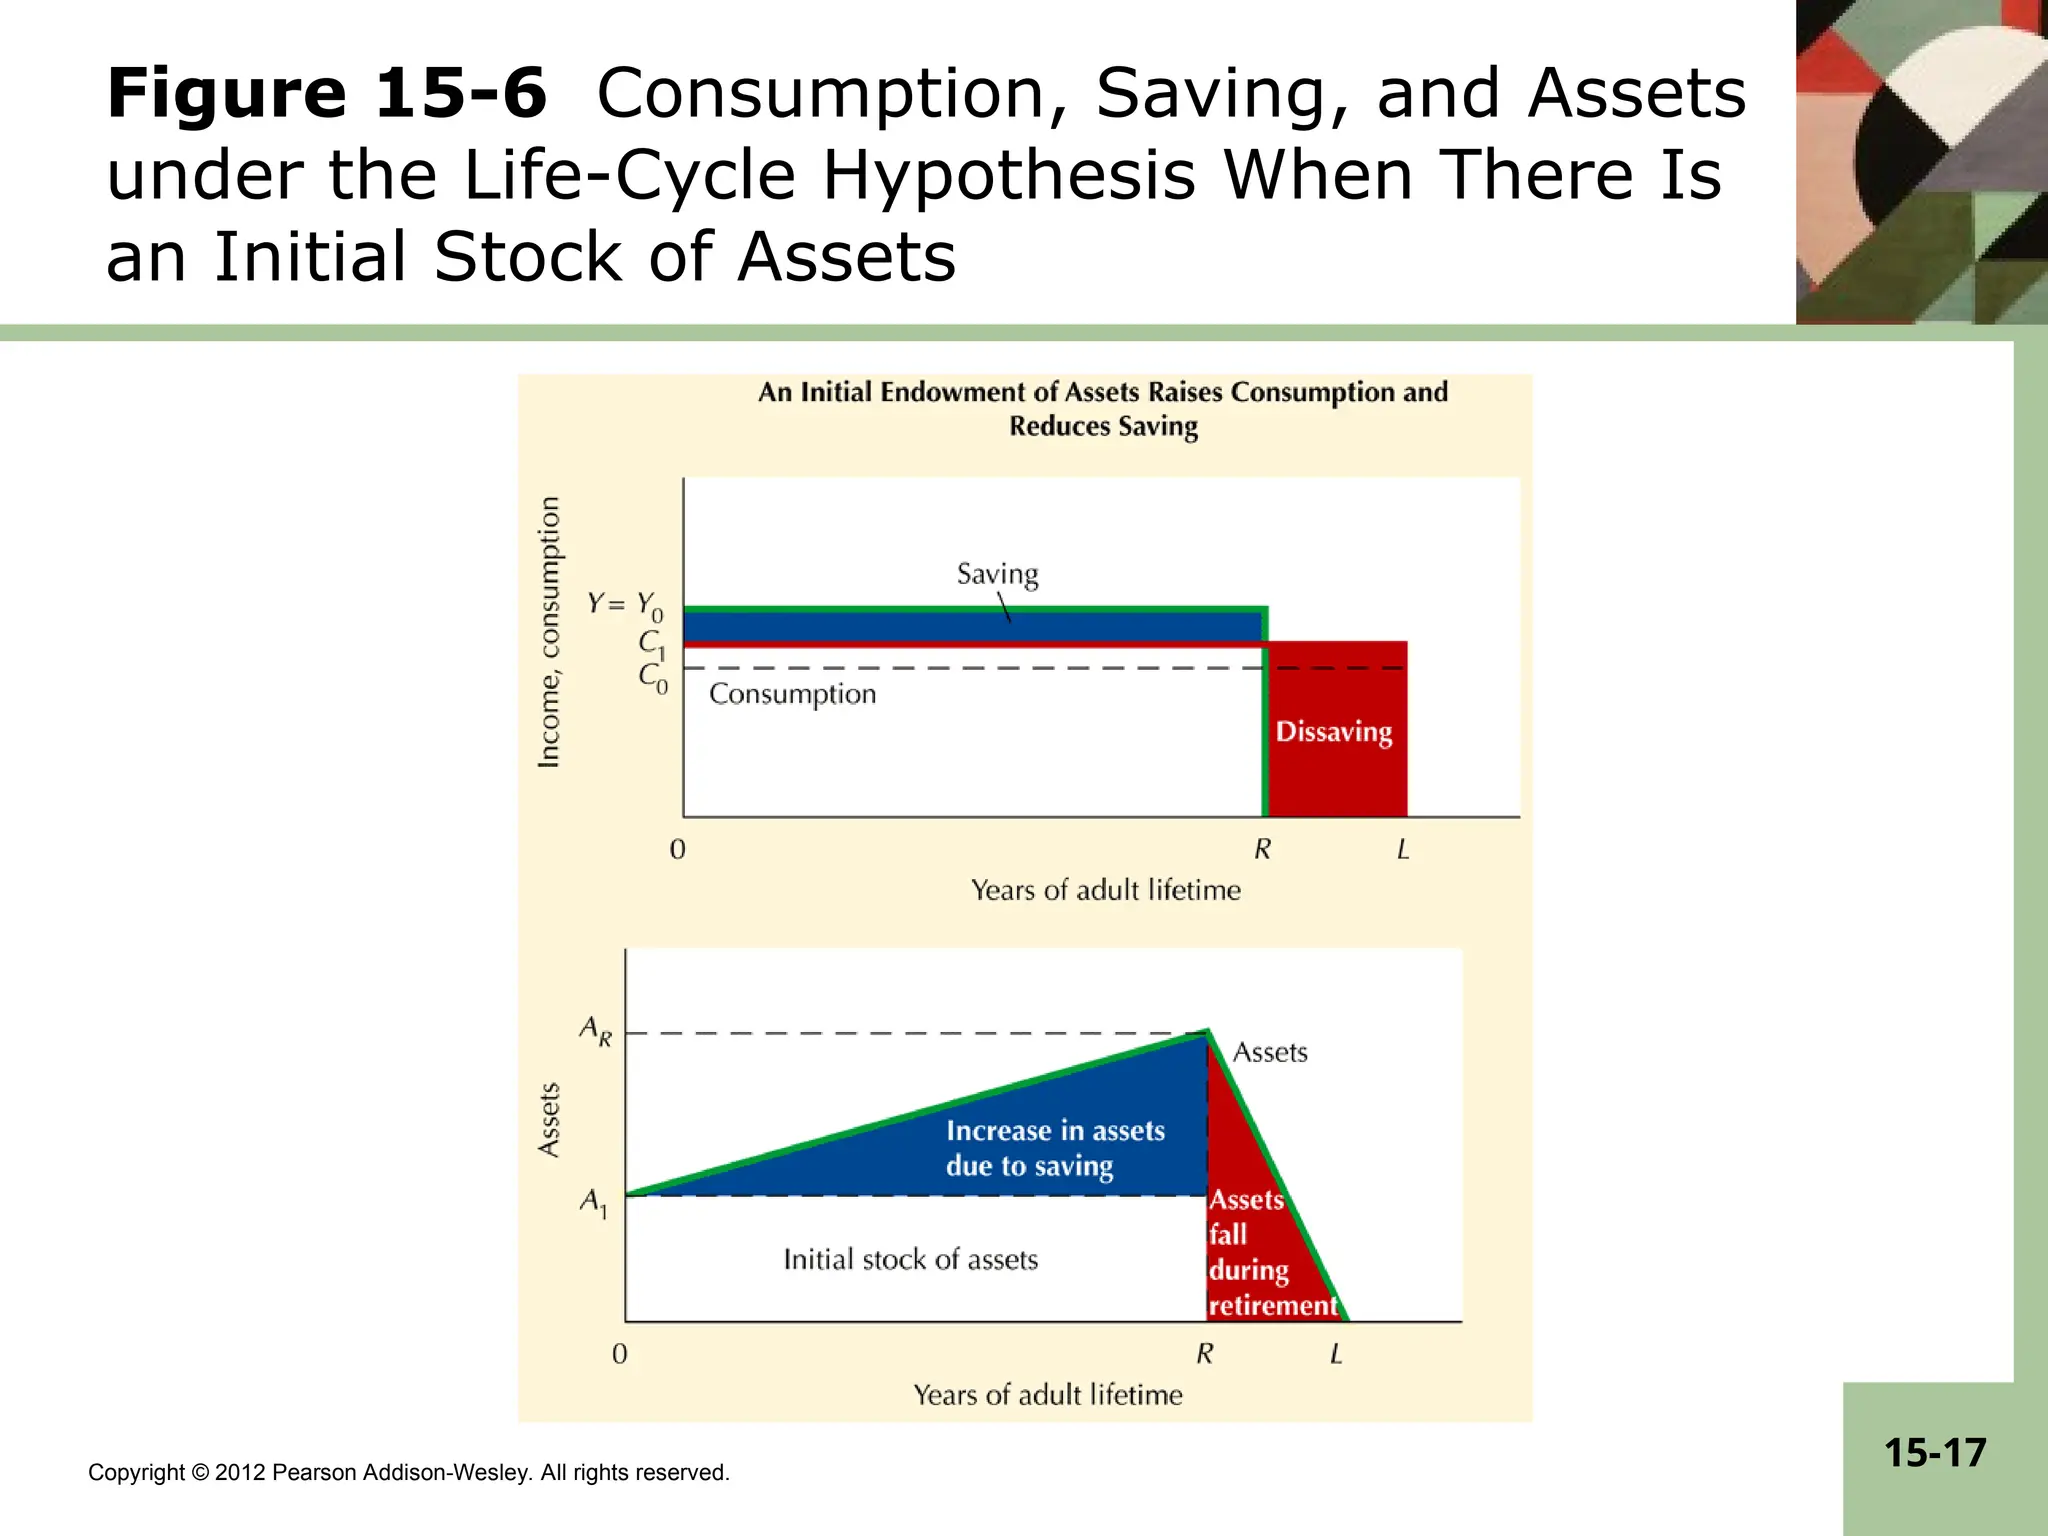
Pearson Addison-Wesley. All rights reserved. 15-17 Figure 15-6 Consumption, Saving, and Assets under the Life-Cycle Hypothesis When There Is an Initial Stock of Assets
18.
Copyright © 2012
Pearson Addison-Wesley. All rights reserved. 15-18 Rational Expectations and Consumption • The Rational Expectations hypothesis suggests that people use forecasts of future economic magnitudes based on all information currently available about the structure and past performance of the economy and future government policies. – Since all past information is taken into account in forming expectations, only new information will change estimated permanent income Consumption only changes if unanticipated events occur. – But empirically the behavior of consumption appears to be too volatile to be consistent with this theory.
19.
Copyright © 2012
Pearson Addison-Wesley. All rights reserved. 15-19 Did Households Spend or Save the 2008 Economic Stimulus Payments? • In Feb. 2008, Bush and Congress passed the Economic Stimulus Act (ESA): $100B in fiscal stimulus – 130M households received an average check of $770 • How large was the multiplier effect? The leading study… – 12-30% of ESA payments spent on nondurables and services – 50-90% of ESA payments spent on total consumption – Overall: C↑ by 1.8% in 2008:Q2 and 0.8% in 2008:Q3 • Annualized, C↑ by $65B in response to $100B in tax cuts mpc = 0.65 • Other studies found smaller effects – One survey found only 20% had spent ESA payments – Another: 30% spent stimulus, 18% saved it, 52% paid off debt
20.
Copyright © 2012
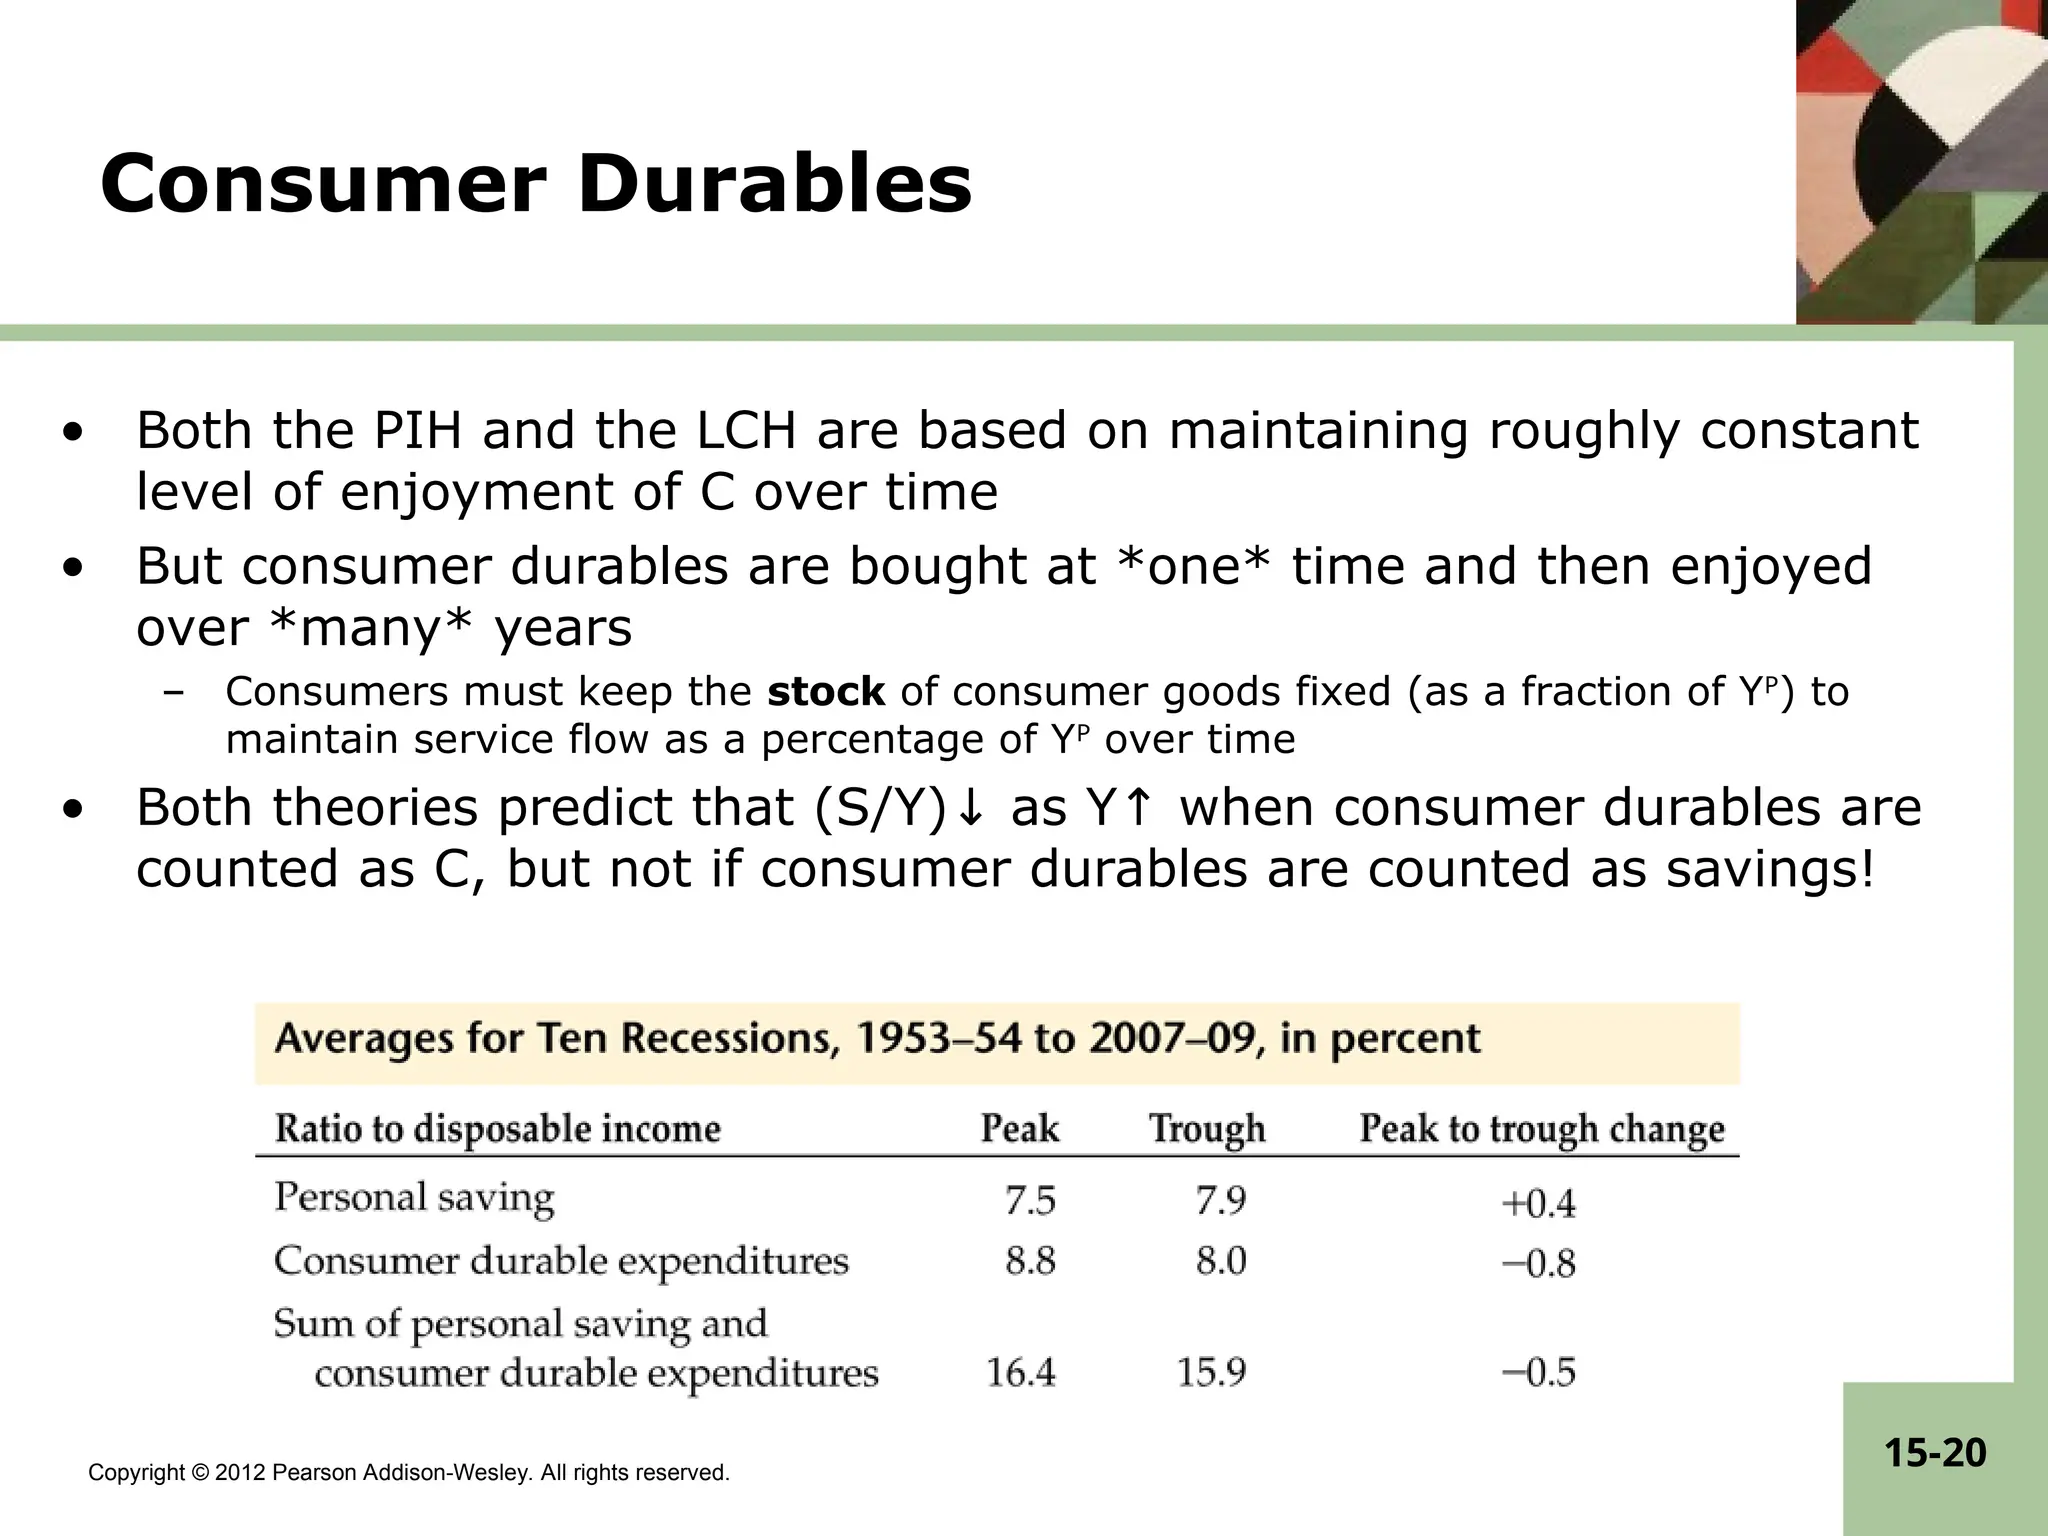
Pearson Addison-Wesley. All rights reserved. 15-20 Consumer Durables • Both the PIH and the LCH are based on maintaining roughly constant level of enjoyment of C over time • But consumer durables are bought at *one* time and then enjoyed over *many* years – Consumers must keep the stock of consumer goods fixed (as a fraction of YP ) to maintain service flow as a percentage of YP over time • Both theories predict that (S/Y)↓ as Y↑ when consumer durables are counted as C, but not if consumer durables are counted as savings!
21.
Copyright © 2012
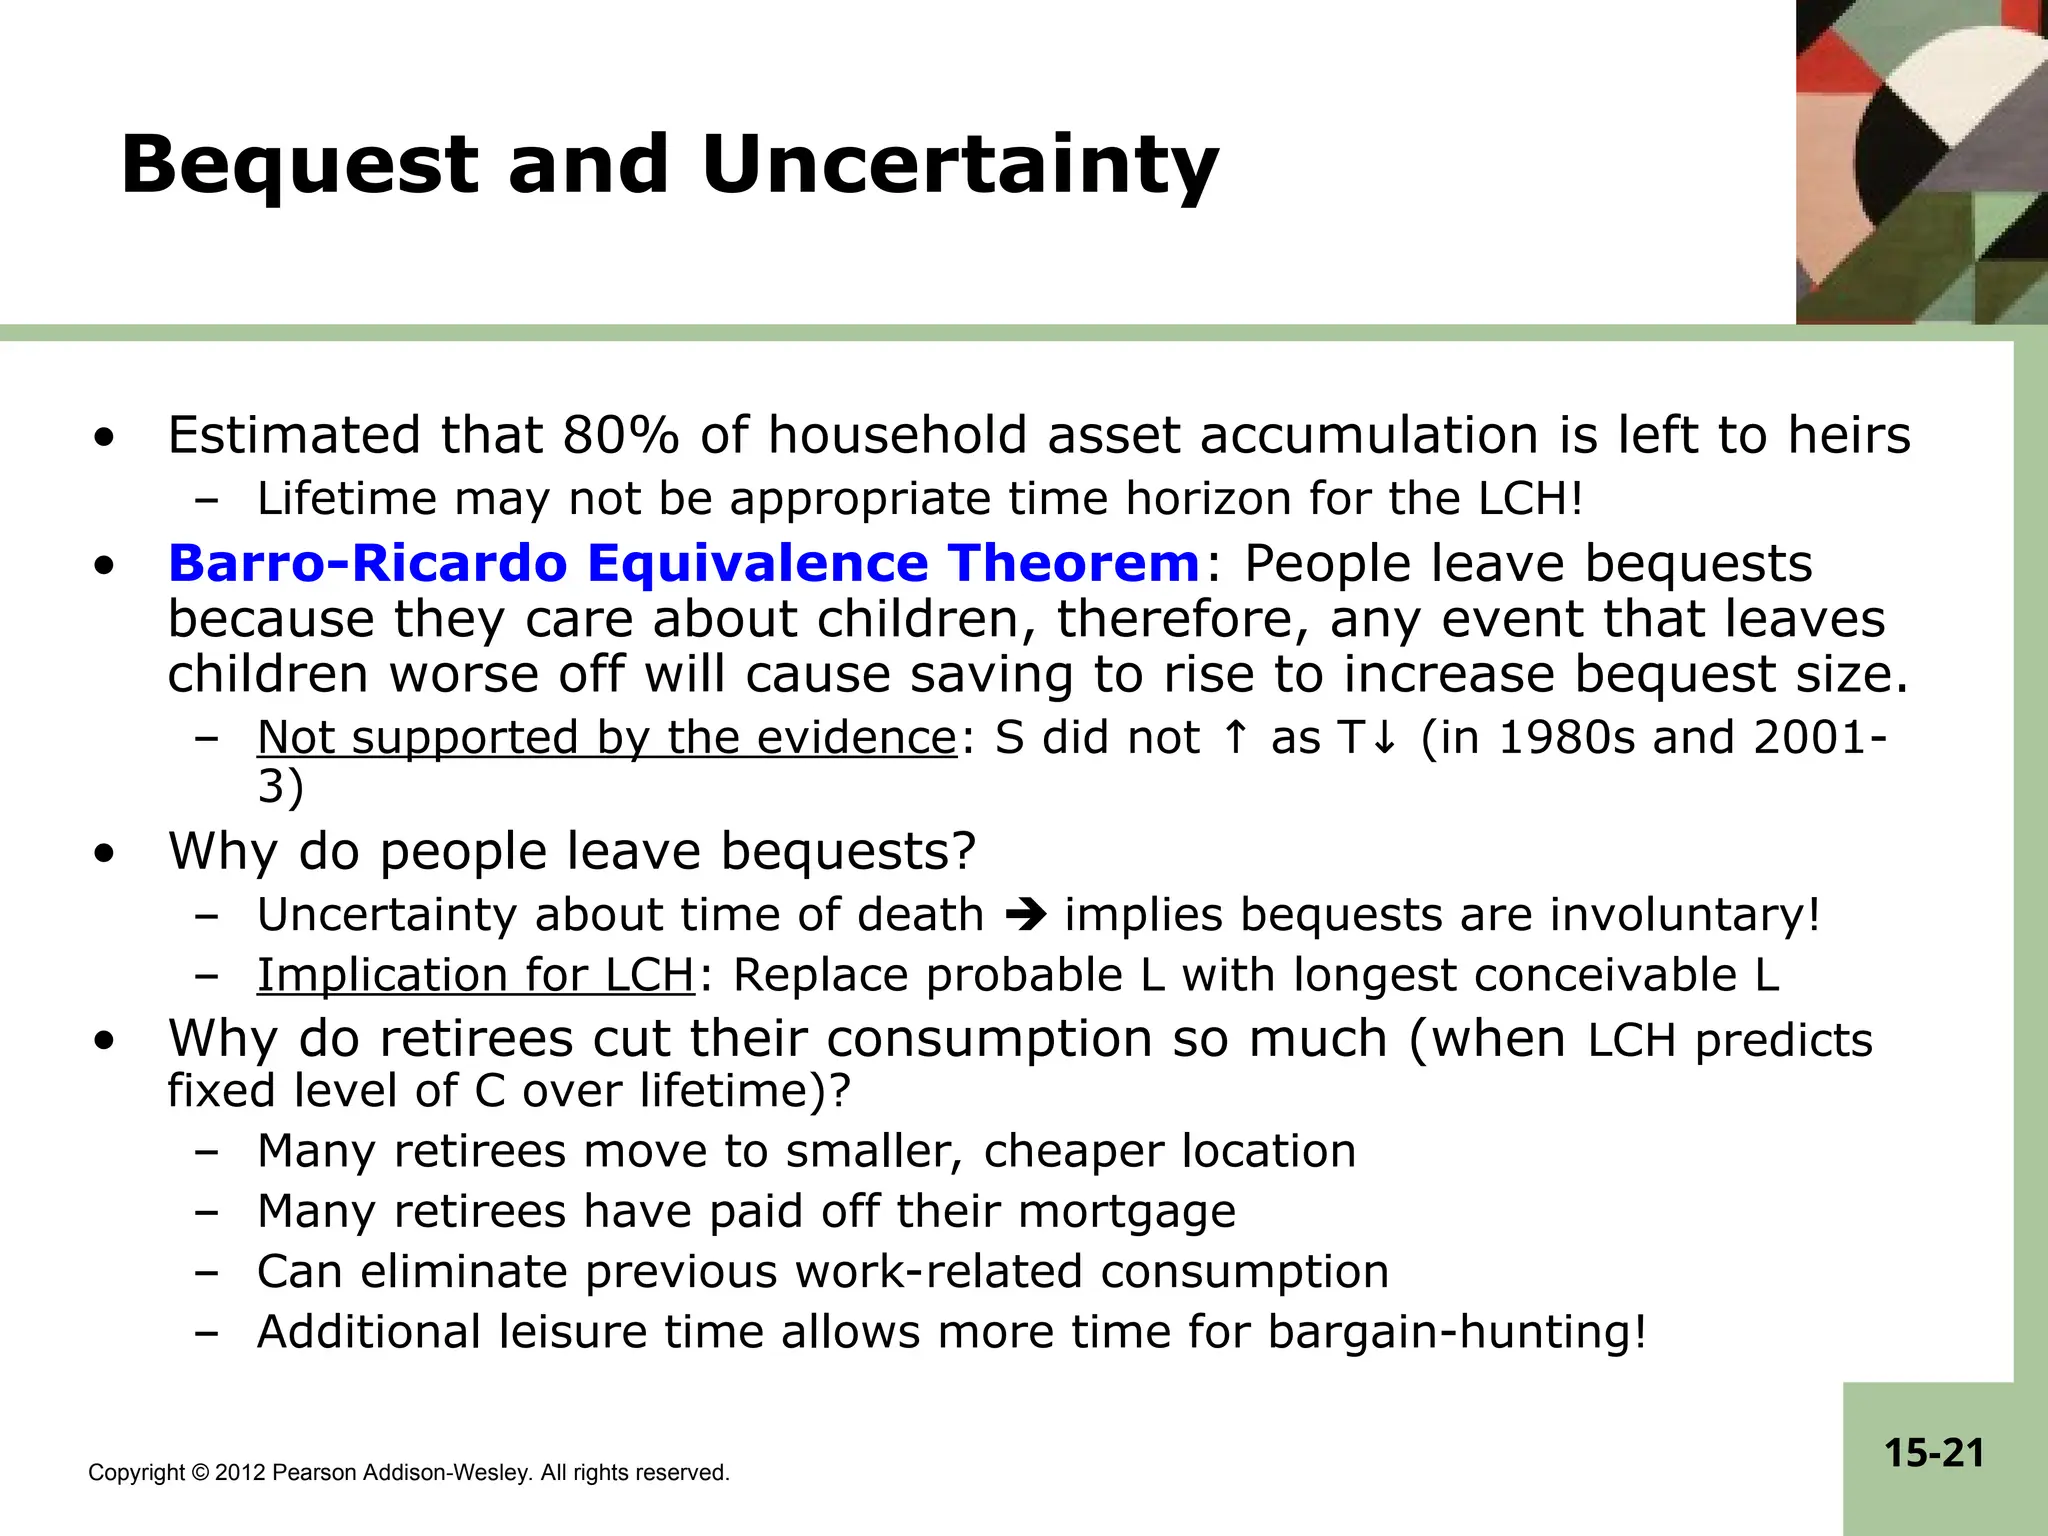
Pearson Addison-Wesley. All rights reserved. 15-21 Bequest and Uncertainty • Estimated that 80% of household asset accumulation is left to heirs – Lifetime may not be appropriate time horizon for the LCH! • Barro-Ricardo Equivalence Theorem: People leave bequests because they care about children, therefore, any event that leaves children worse off will cause saving to rise to increase bequest size. – Not supported by the evidence: S did not ↑ as T↓ (in 1980s and 2001- 3) • Why do people leave bequests? – Uncertainty about time of death implies bequests are involuntary! – Implication for LCH: Replace probable L with longest conceivable L • Why do retirees cut their consumption so much (when LCH predicts fixed level of C over lifetime)? – Many retirees move to smaller, cheaper location – Many retirees have paid off their mortgage – Can eliminate previous work-related consumption – Additional leisure time allows more time for bargain-hunting!
22.
Copyright © 2012
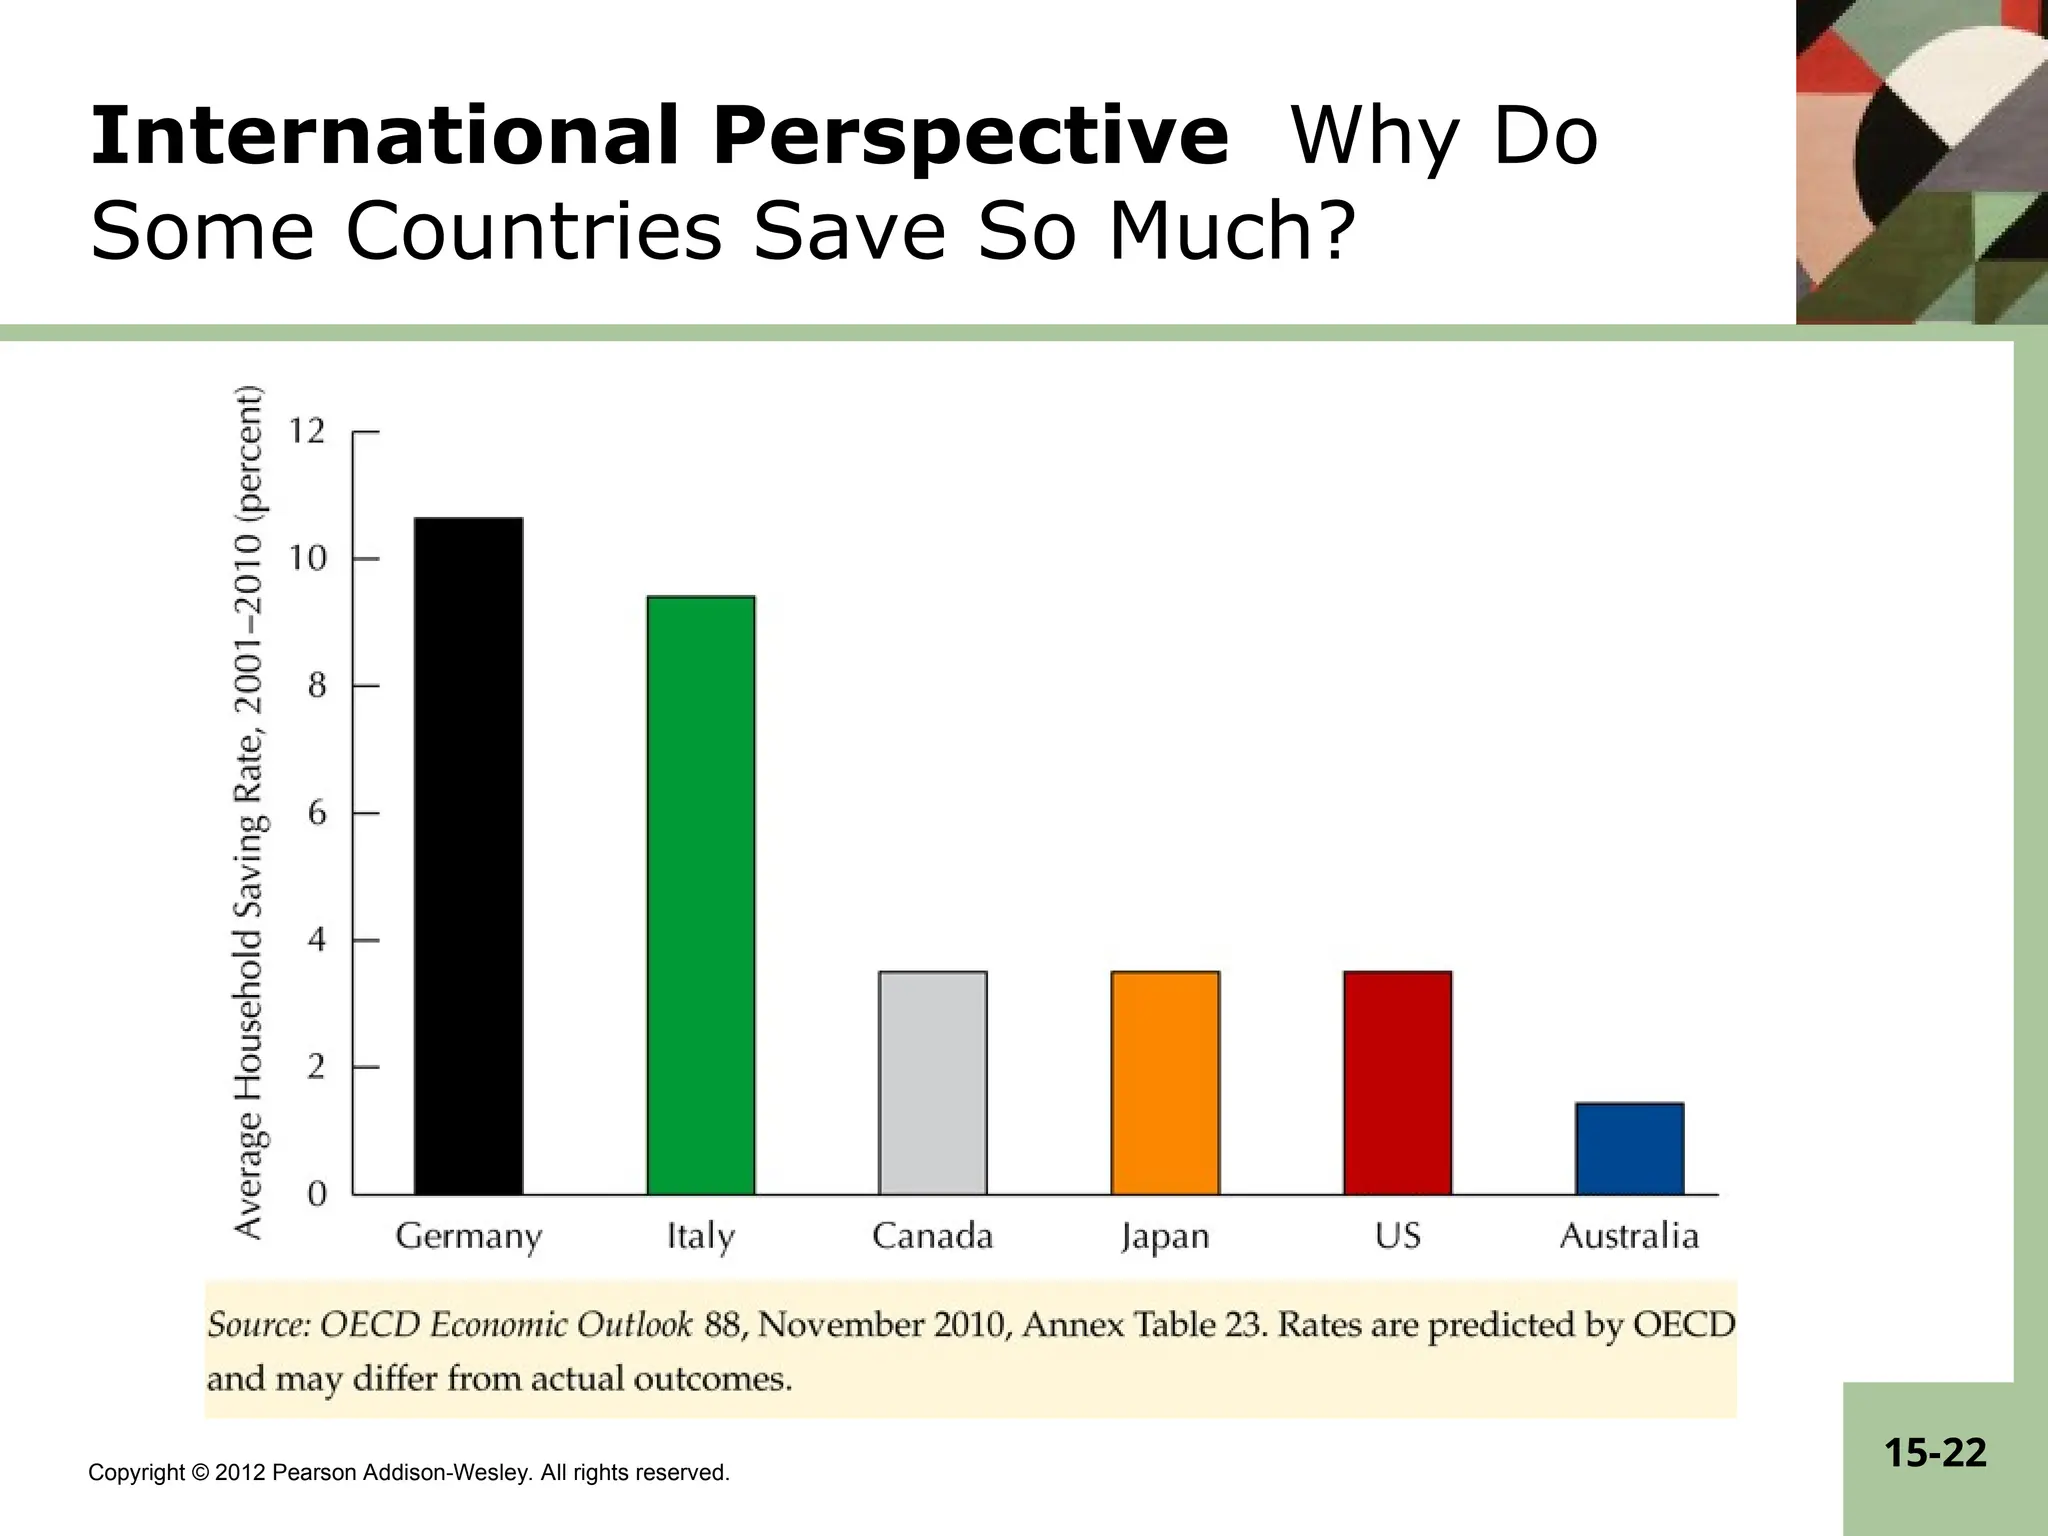
Pearson Addison-Wesley. All rights reserved. 15-22 International Perspective Why Do Some Countries Save So Much?
23.
Copyright © 2012
Pearson Addison-Wesley. All rights reserved. 15-23 Household Assets and the Fall and Rise of S • In the late 1990s, household saving as a percentage of disposable income was the lowest in the U.S. since the Great Depression. Why? • The PIH would predict that higher incomes in the 1990s would have pushed up the saving rate. • The LCH has consumption depending on lifetime income and on real assets. – The stock market boom in the late 1990s greatly increased people’s wealth C relative to income pushing down the saving rate. – Saving did not revive in the 2000s when the stock market subsequently declined. Why? • Rising value of real estate • Low interest rates After 2005: Net Worth Fell S↑
24.
Copyright © 2012
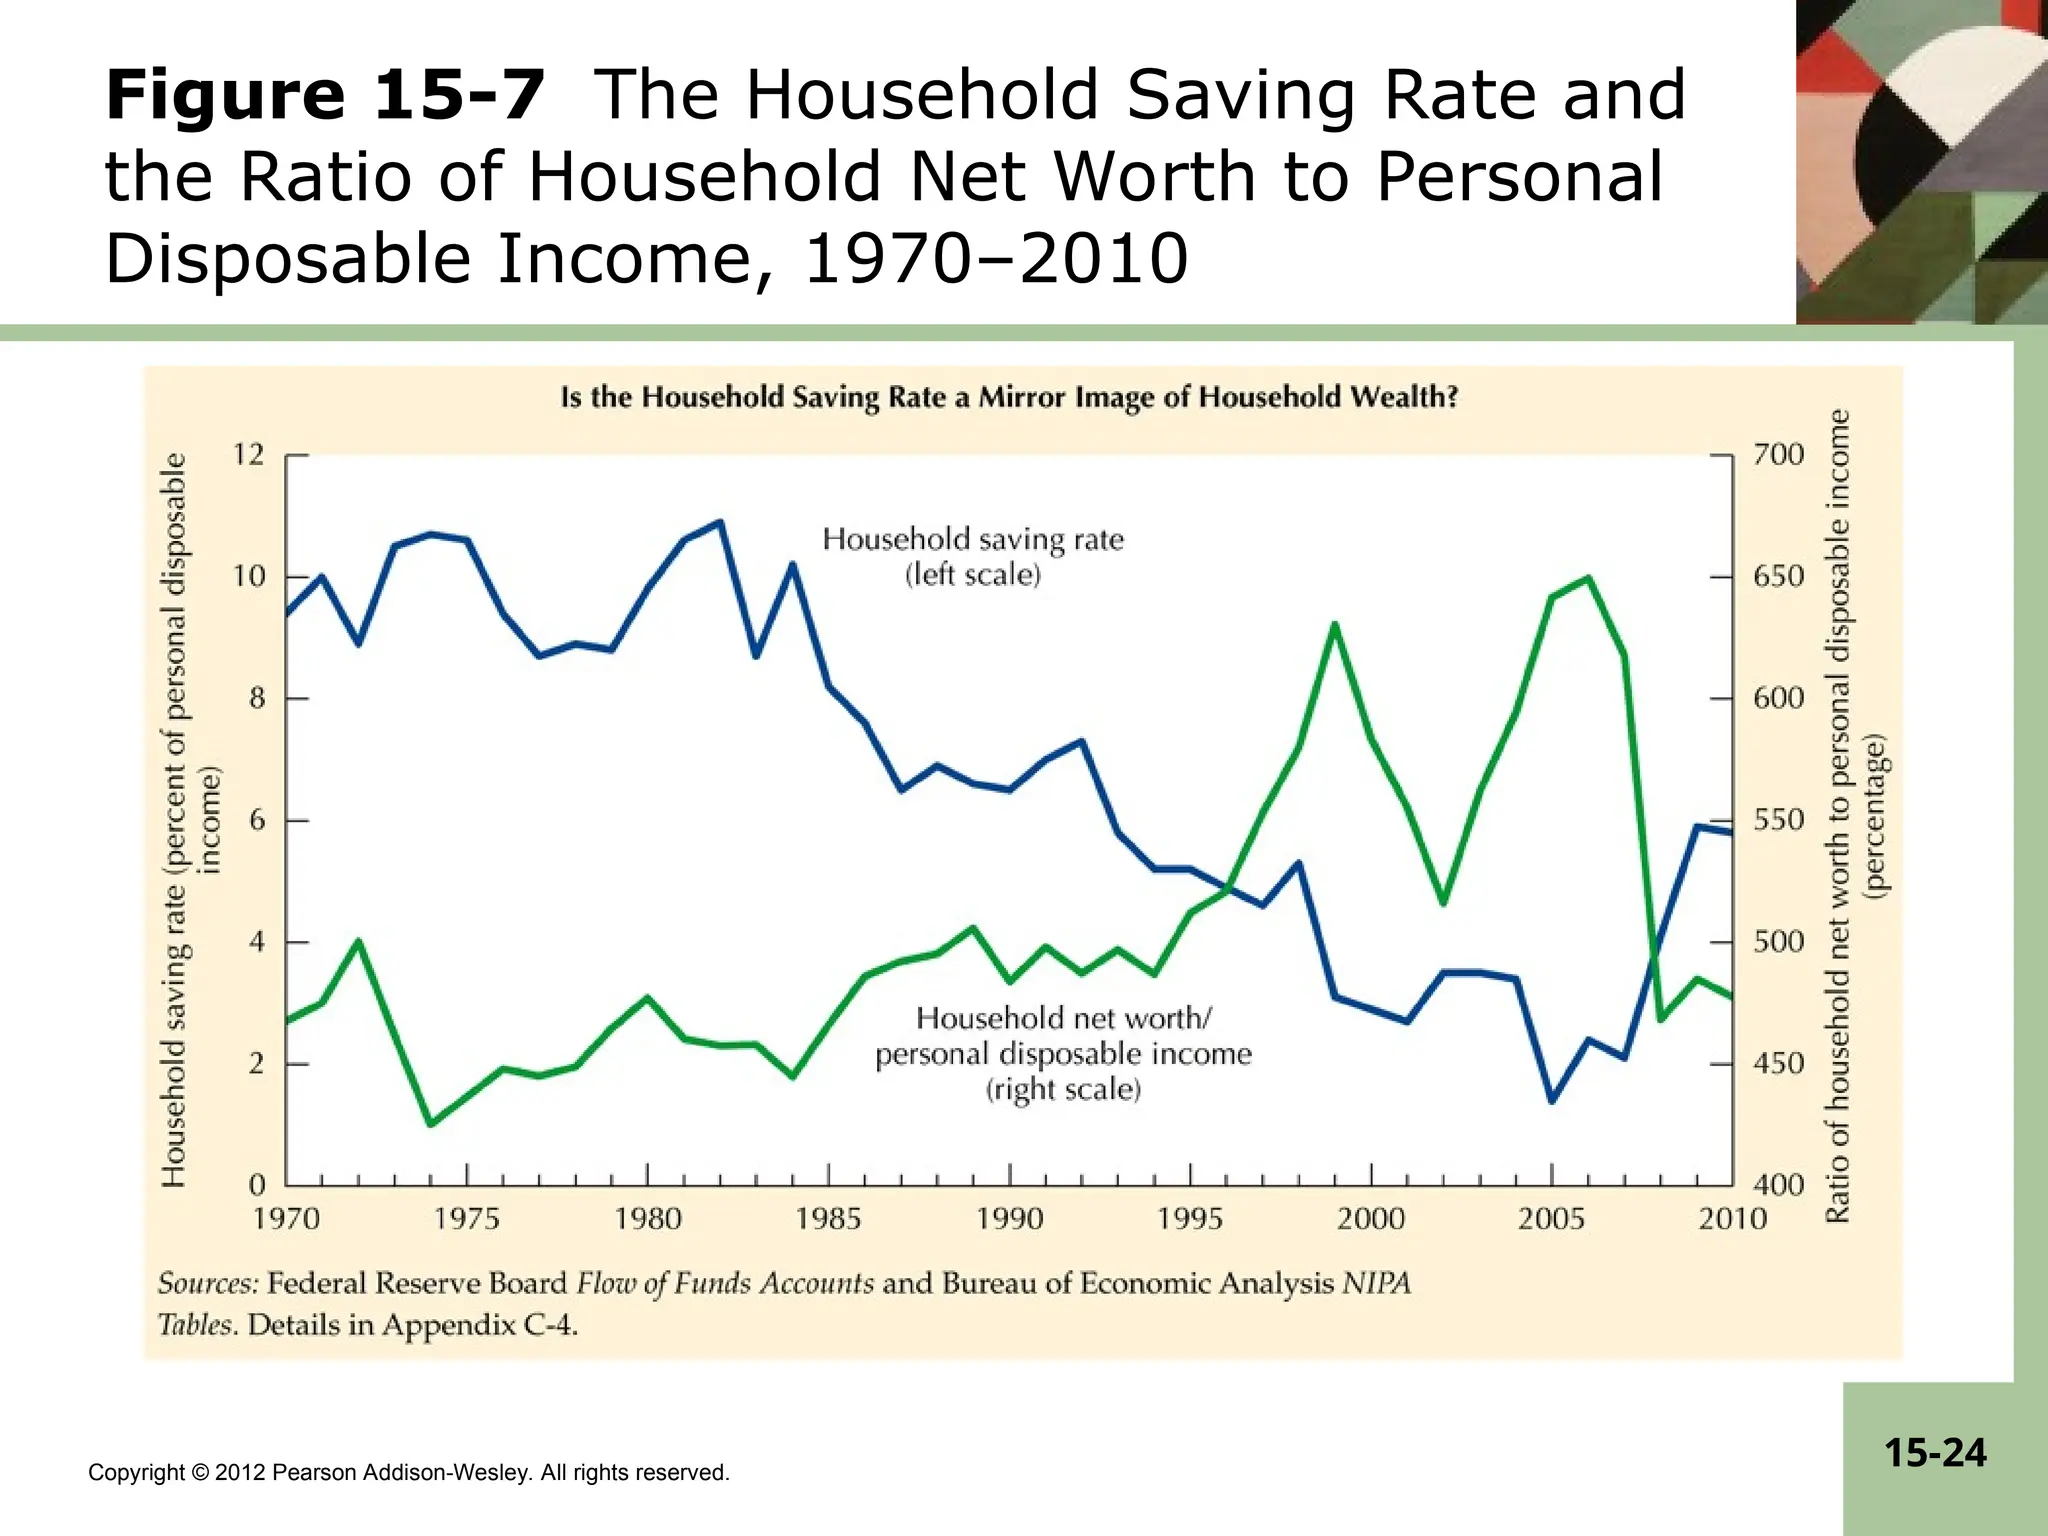
Pearson Addison-Wesley. All rights reserved. 15-24 Figure 15-7 The Household Saving Rate and the Ratio of Household Net Worth to Personal Disposable Income, 1970–2010
25.
Copyright © 2012
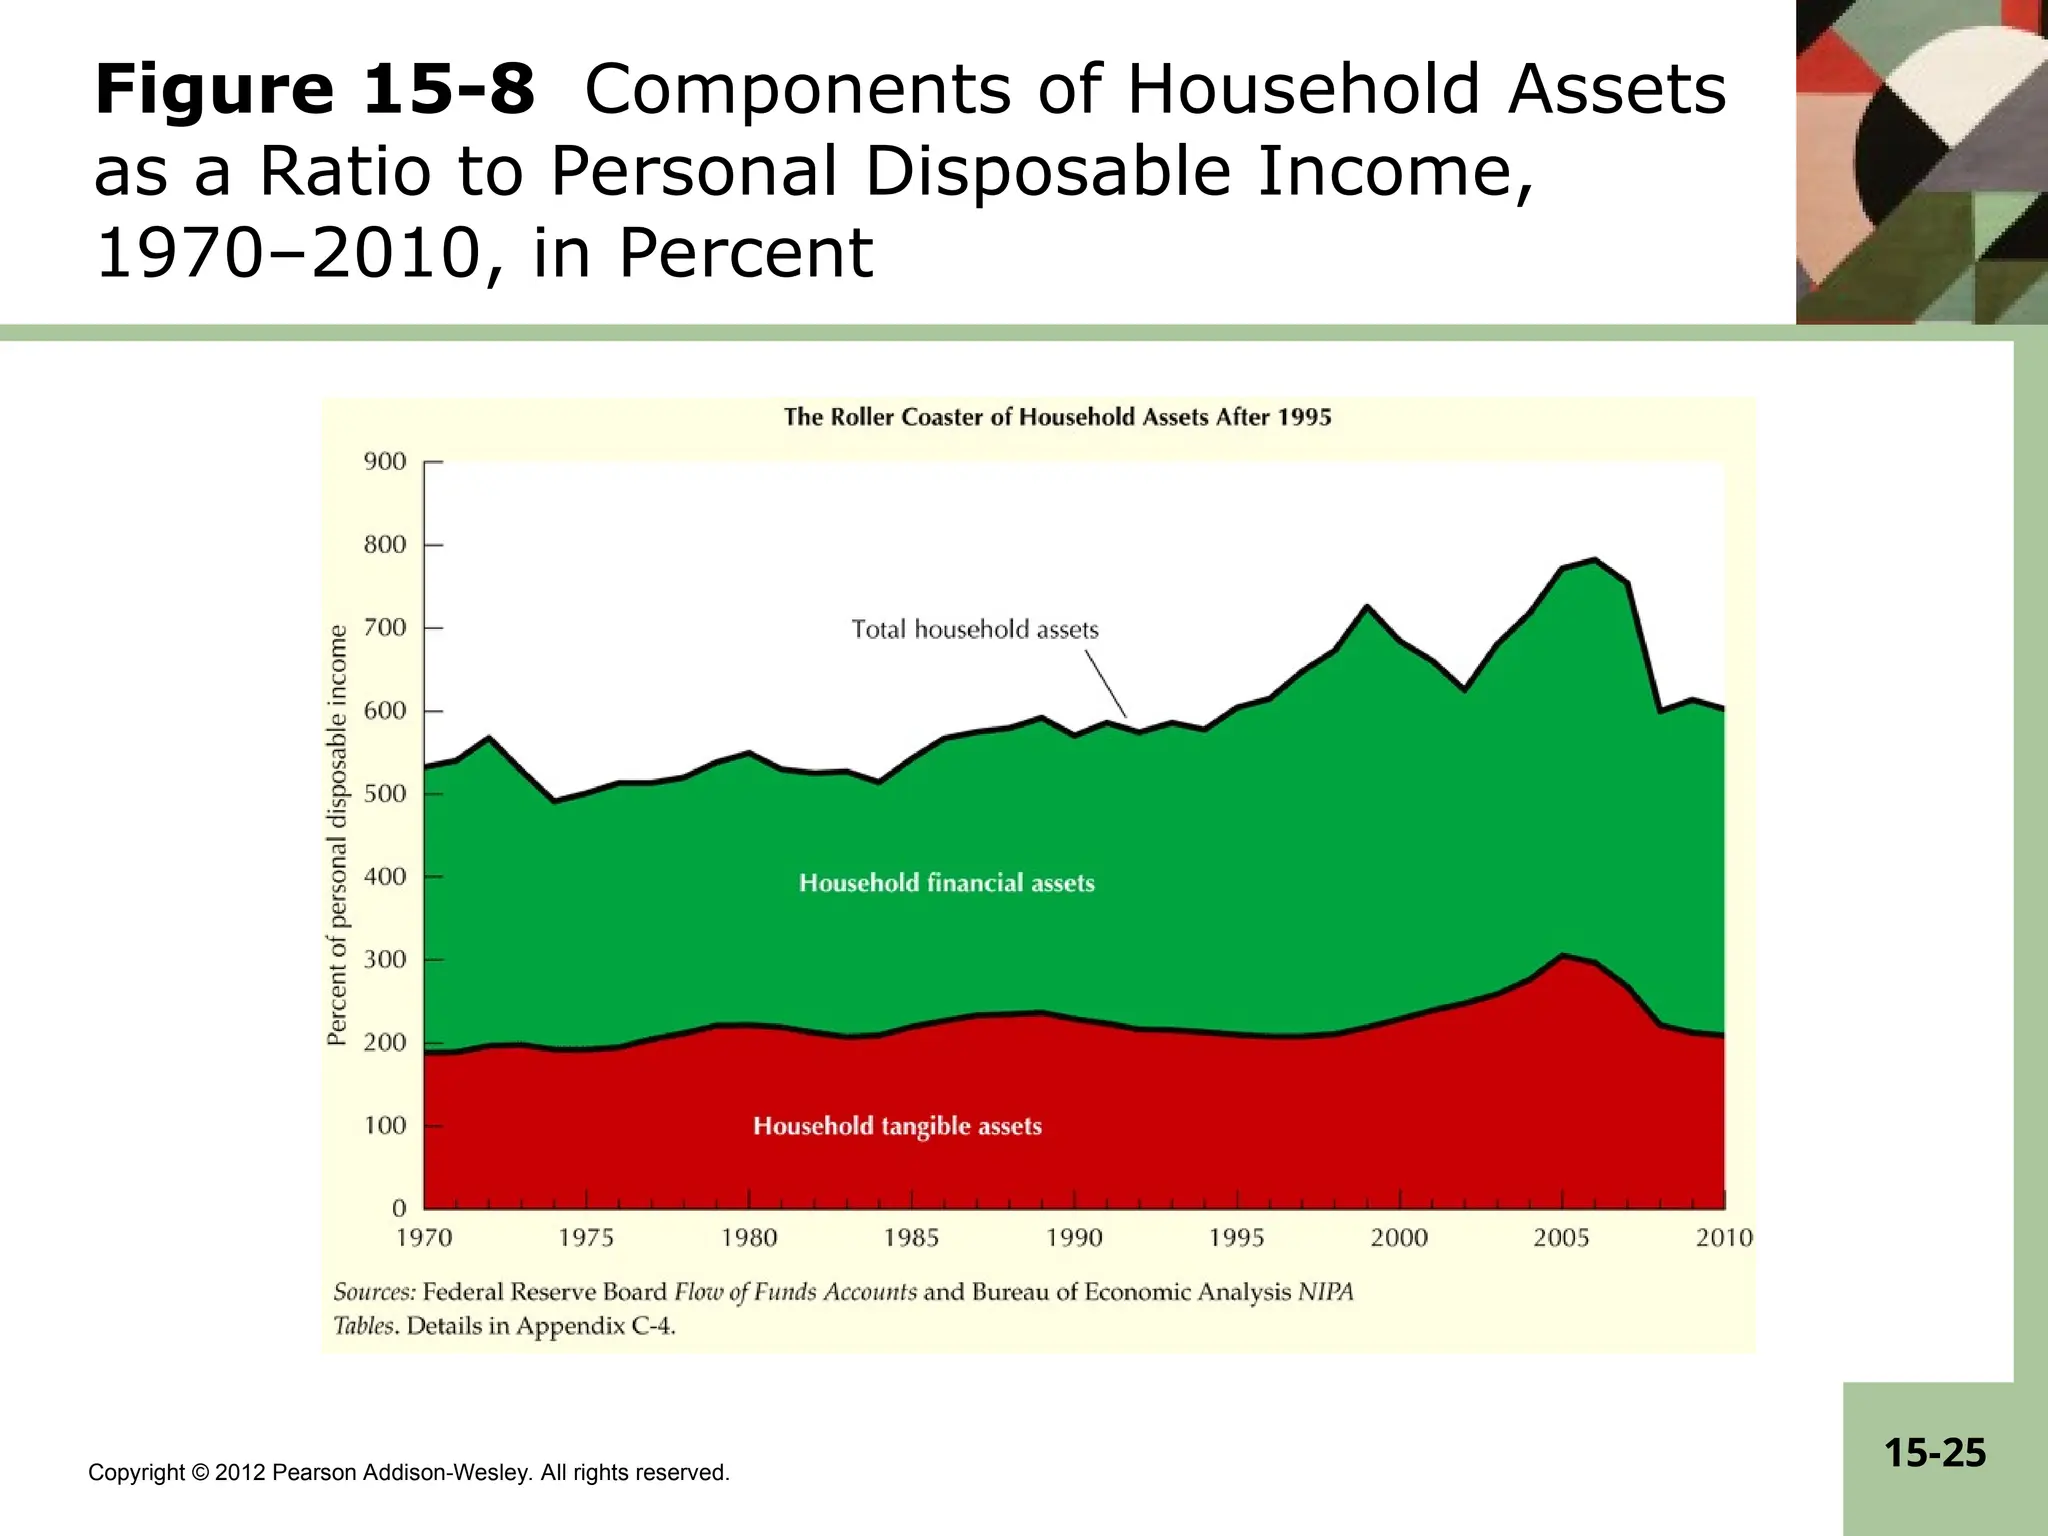
Pearson Addison-Wesley. All rights reserved. 15-25 Figure 15-8 Components of Household Assets as a Ratio to Personal Disposable Income, 1970–2010, in Percent
26.
Copyright © 2012
Pearson Addison-Wesley. All rights reserved. 15-26 Official Household Saving Data • The National Income and Product Accounts (NIPA) measure saving as: S = YD – C – interest payments • Some flaws in the NIPA measure of S include: – NIPA does not include capital gains on stocks, bonds, houses and other assets. – NIPA does not include purchases of consumer durable goods, which would provide a stream of benefits in the future. – Inflation raises the nominal interest paid leading to overestimates of S in periods of high inflation. • The Flow of Funds (FFA) measure of S includes net investment in consumer durables.
27.
Copyright © 2012
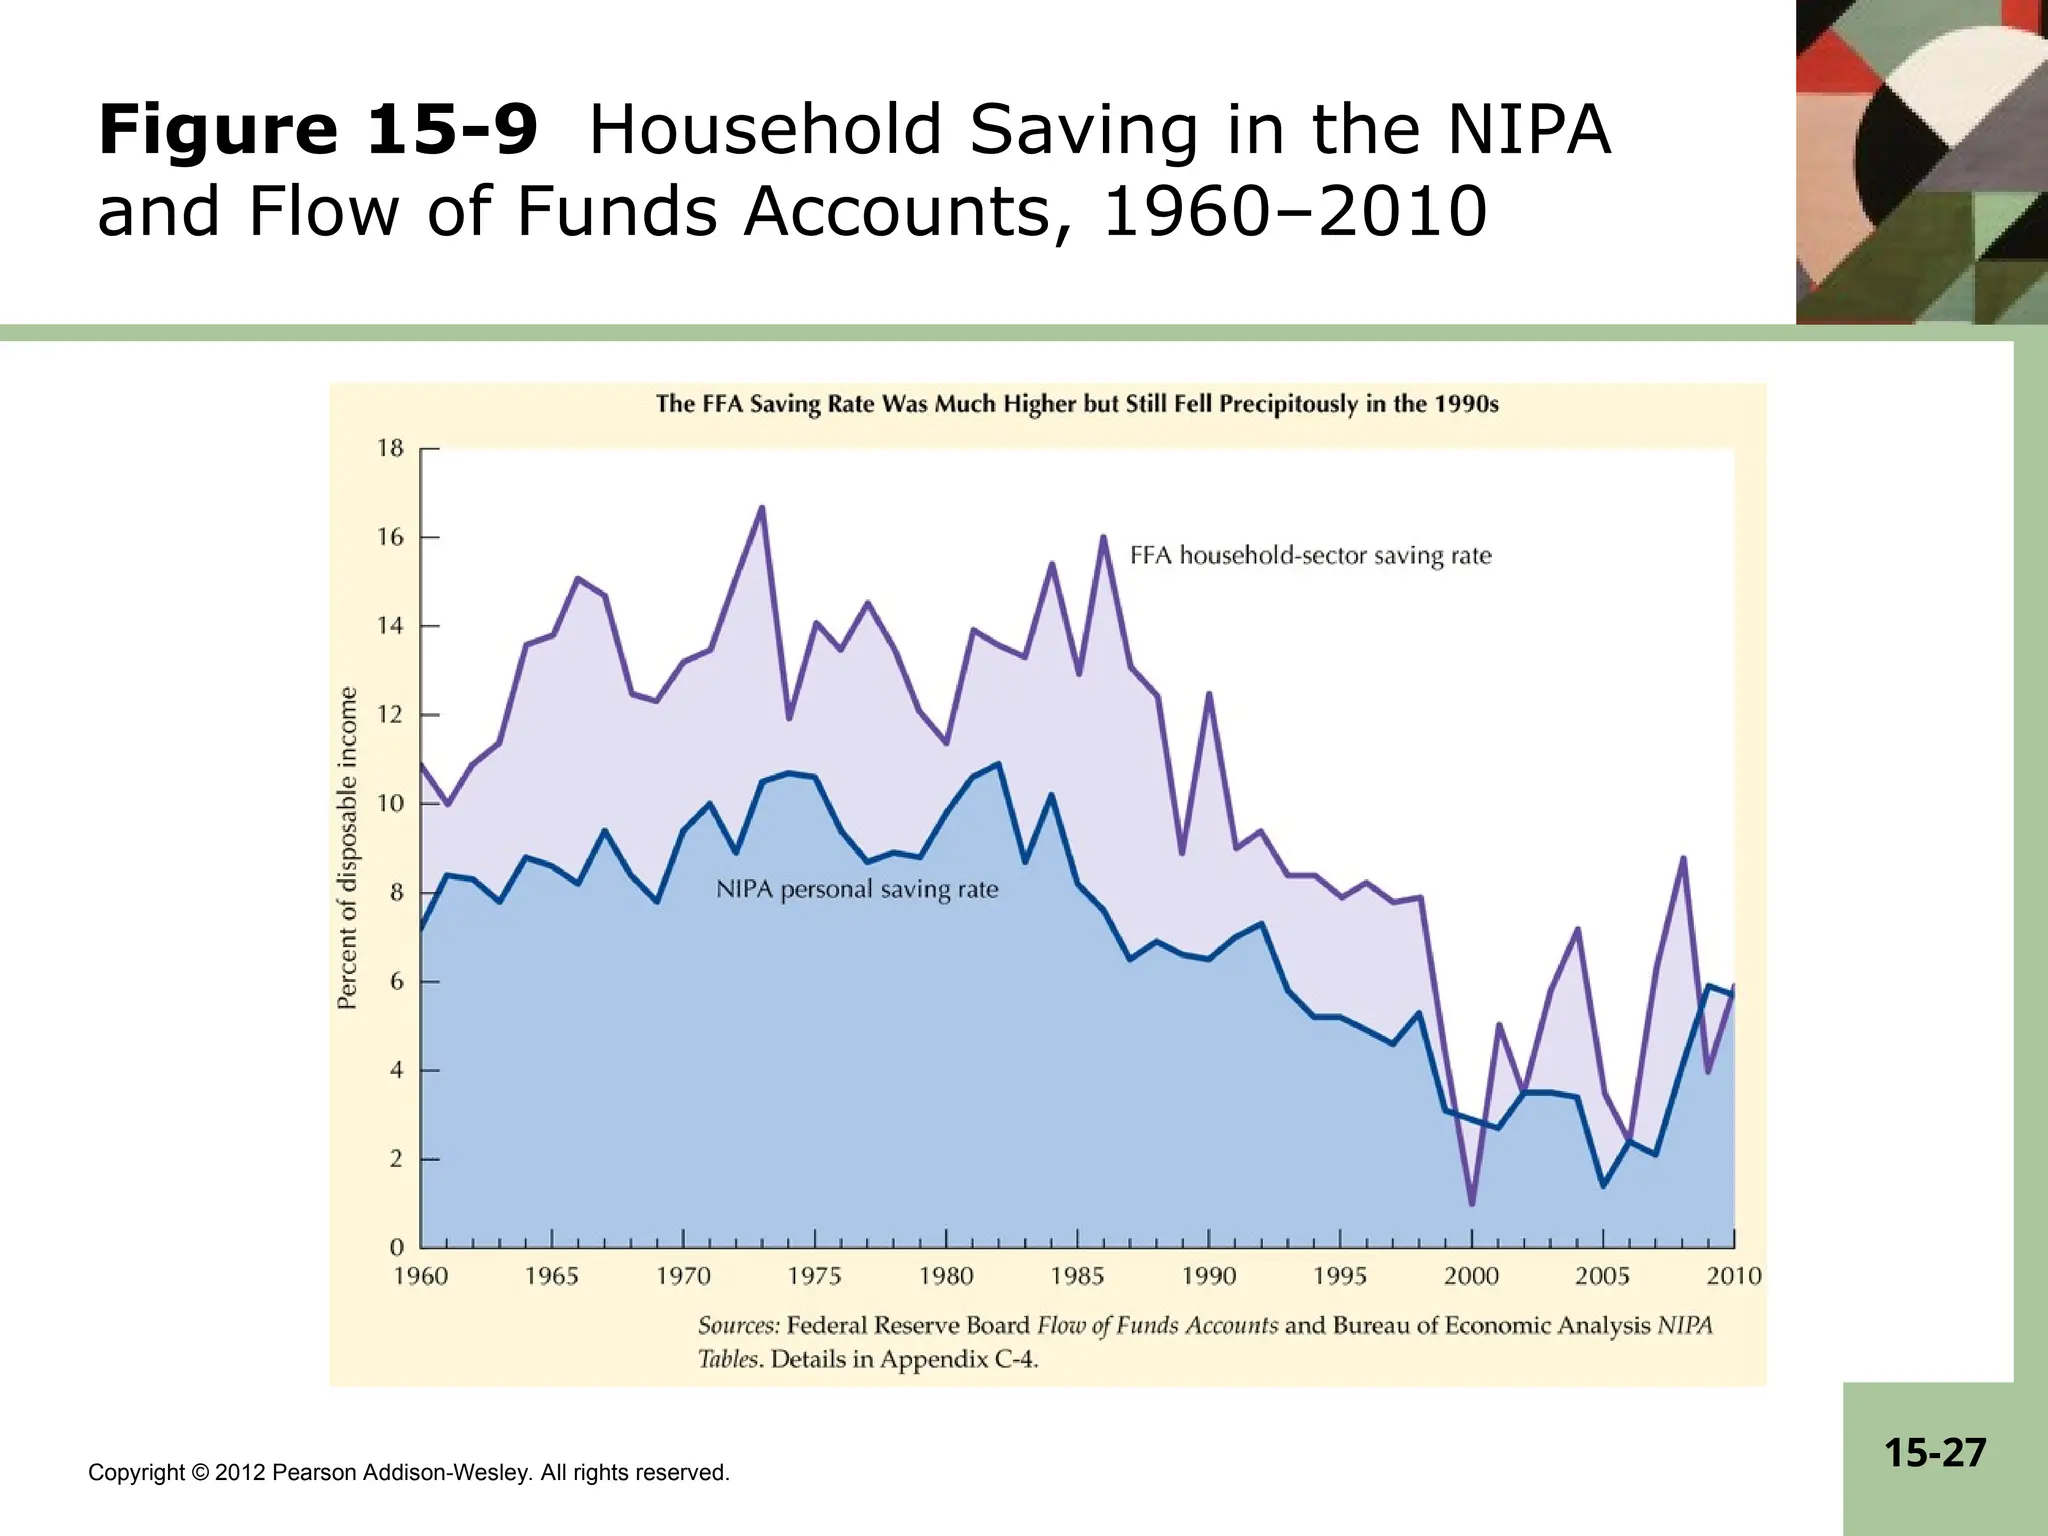
Pearson Addison-Wesley. All rights reserved. 15-27 Figure 15-9 Household Saving in the NIPA and Flow of Funds Accounts, 1960–2010
28.
Copyright © 2012
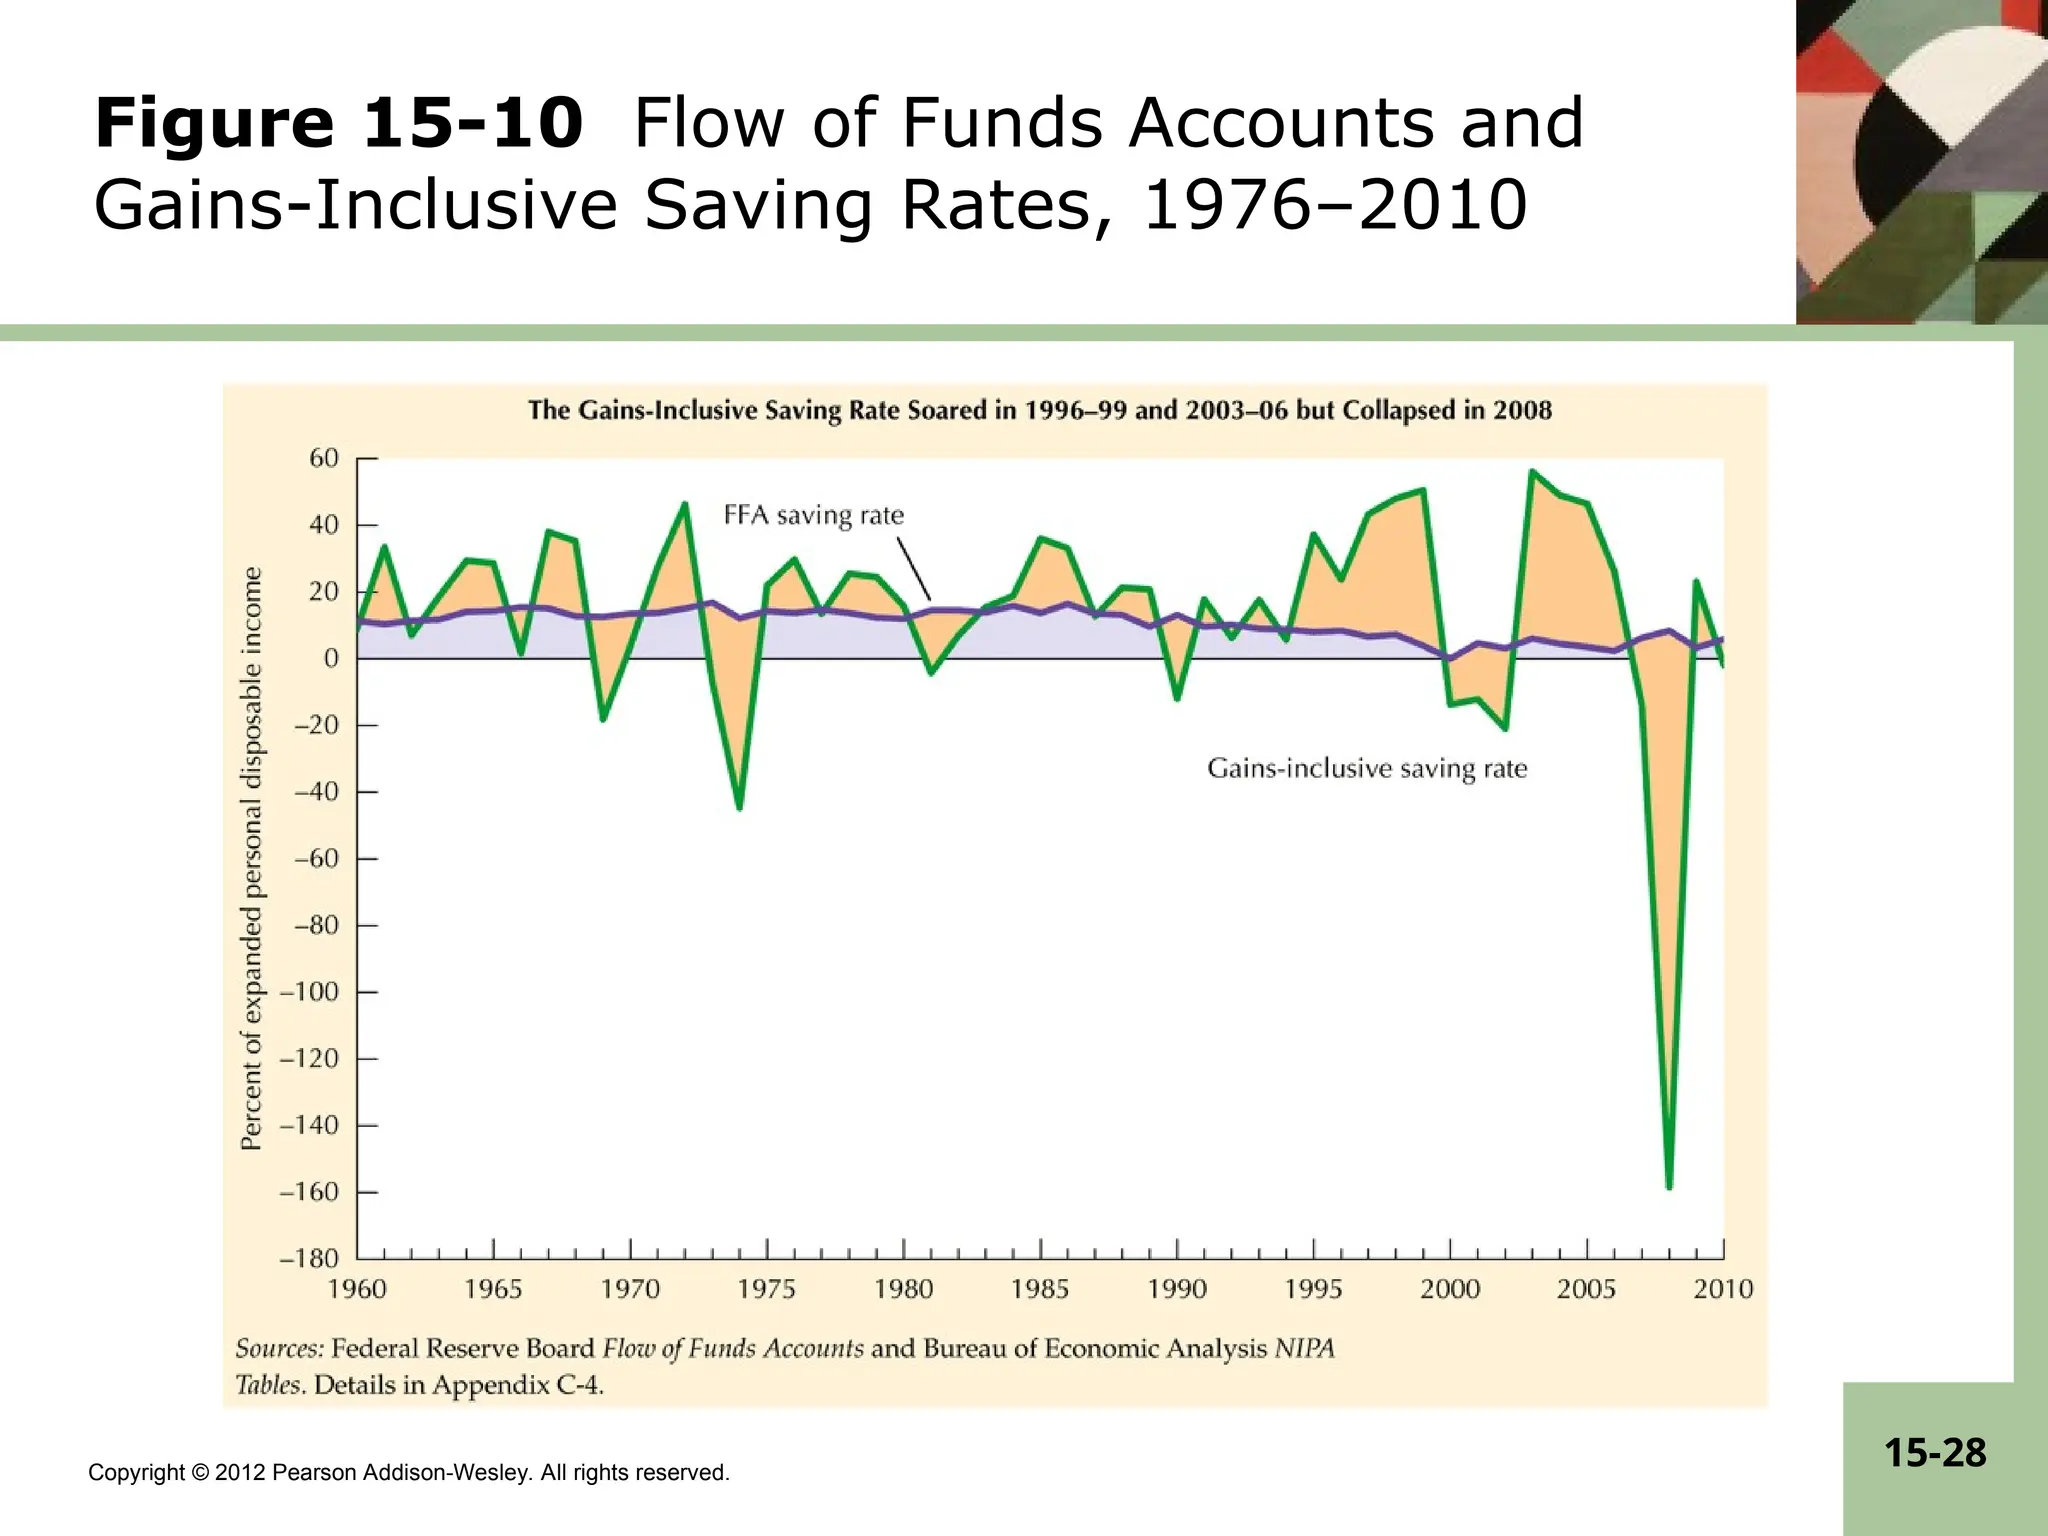
Pearson Addison-Wesley. All rights reserved. 15-28 Figure 15-10 Flow of Funds Accounts and Gains-Inclusive Saving Rates, 1976–2010
Download


![Class4 mff[1]](https://cdn.slidesharecdn.com/ss_thumbnails/class4mff1-101019141432-phpapp02-thumbnail.jpg?width=640&height=640&fit=bounds)


