Download to read offline
![© 2023, IRJET | Impact Factor value: 8.226 | ISO 9001:2008 Certified Journal | Page 346
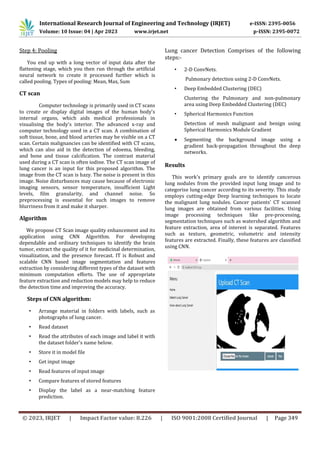
Lung Cancer Detection Using Deep Learning Algorithms
Ritesh Jaiswal1, Pooja Shukla2, Mohini Varpe3, Pranay Krishna More4
1,2,3,4 Organization Name:- VPPCOE & VA
Department :- IT
University Name:- University Of Mumbai
-------------------------------------------------------------------------***------------------------------------------------------------------------
Abstract: One of the leading causes of death worldwide,
in both men and women, is lung cancer. According to WHO,
the estimated number of lung cancer cases per year is two
million. The overall 5-year survival rate for lung cancer
patients increases from 16 to 56% if the disease is detected
in time Computed Tomography (CT) scan can provide
valuable information in the diagnosis of lung diseases This
work's primary goals are to identify cancerous lung
nodules from the provided input lung image and to
categorise lung cancer according to its severity. This study
employs cutting-edge Deep learning techniques to locate
the malignant lung nodules. This study employs cutting-
edge Deep learning techniques to locate the malignant lung
nodules. Cancer patients' CT scanned lung images are
obtained from various facilities. using image processing
techniques like pre-processing, segmentation techniques
such as watershed algorithm and feature extraction, area
of interest is separated. Features such as texture,
geometric, volumetric and intensity features are extracted.
Finally, these features are classified using CNN.
Keywords- Lung Cancer, CT, Deep Learning, Watershed,
CNN. (Key words)
I. INTRODUCTION
Lung cancer disease is the second largest death threat
to the world after heart attack, as this cancer is responsible
for the largest number of deaths, compared to the number
of deaths caused by any other cancer type. [1]. Lung cancer
is characterised by unchecked cell proliferation that
results in the development of lung nodules. It is reported
that lung cancer is responsible for around 19% deaths
globally mostly due to alcohol and tobacco consumption.
The rate of survival is assured by only 15% survival
chances, for a survival period of 5 years. [2]. The main
reason for such a high fatality rate is because therapy is
delayed due to discovery occurring at a later stage.
Chances of survival can rise by 50–70% if lung cancer is
discovered sooner. Non-small cell lung cancer and small
cell lung cancer are the two major groups into which the
lung cancer can be classified based on the cell
characteristics. [7] non-small cell lung cancer is the most
common type of lung cancer contributing to about 85-90%
of total lung cancer cases, while the other 10-15% of the
cases is diagnosed with small cell lung cancer. The leading
cause of cancer-related deaths worldwide is lung cancer.
The ultimate stage of lung cancer is when the symptoms
become apparent so it is very tough to identify in its
beginning stage. Because of this, compared to all other
cancer forms, lung cancer has a particularly high mortality
rate. The two kind of lung disease which develop and
spread in an unexpected way, are small cell lung
malignancies (SCLC) and non-little cell lung tumors
(NSCLC) [1]. The phase of lung disease alludes to the
degree to which the growth has spread in the lung. The
World Health Organization reported that more than 7.6
million people worldwide lost their lives to lung cancer
each year. Moreover, the death rates of lung cancer are
expected upon to keep rising, to wind up around 17 million
worldwide in 2030[2]. Despite being the best imaging tool
in the medical sector, clinicians find it challenging to
interpret and detect cancer from CT scan data. In year of
2005, around 1,362,825 new cancer cases are expected
and around 571,590 deaths are expected to happen due to
cancer in the United States. It was evaluated that there will
be 162,921 deaths from lung cancer, which occurs 30% of
all cancer deaths. [3] The extent of the spread of cancer is
the basis for the division of lung cancer into stages. It
comprises of four stages namely stage I-The cancer is
confined to the lung, stages II and III-the cancer is confined
to the chest (with larger and more invasive tumor
classified as stage III) and Stage IV-Cancer has spread from
the chest to other parts of the body.
There are many techniques to diagnose the lung cancer
such as X-rays, Computed Tomography (CT), Magnetic
Resonance Imaging (MRI scan), and Sputum Cytology. The
problem with these techniques is that it can be time
consuming and makes detection possible only at later
stages. Despite being the best imaging tool in the medical
sector, clinicians find it challenging to interpret and detect
cancer from CT scan data. Hence, computer assisted
diagnosis might be useful for clinicians to precisely identify
the malignant cells. Computer aided techniques such as
Deep learning and image processing have been
implemented. In our proposed algorithm we have tried to
solve these problems. Our developed algorithm can detect
cancer affected cell and the corresponding stage such as
initial, middle, or final stage. If no cancer affected cell is
found in the input image, then it checks the probability of
lung cancer.
International Research Journal of Engineering and Technology (IRJET) e-ISSN: 2395-0056
Volume: 10 Issue: 04 | Apr 2023 www.irjet.net p-ISSN: 2395-0072](https://image.slidesharecdn.com/irjet-v10i450-230610121841-2d61b818/85/Lung-Cancer-Detection-Using-Deep-Learning-Algorithms-1-320.jpg)
![© 2023, IRJET | Impact Factor value: 8.226 | ISO 9001:2008 Certified Journal | Page 346
Lung Cancer Detection Using Deep Learning Algorithms
Ritesh Jaiswal1, Pooja Shukla2, Mohini Varpe3, Pranay Krishna More4
1,2,3,4 Organization Name:- VPPCOE & VA
Department :- IT
University Name:- University Of Mumbai
-------------------------------------------------------------------------***------------------------------------------------------------------------
Abstract: One of the leading causes of death worldwide,
in both men and women, is lung cancer. According to WHO,
the estimated number of lung cancer cases per year is two
million. The overall 5-year survival rate for lung cancer
patients increases from 16 to 56% if the disease is detected
in time Computed Tomography (CT) scan can provide
valuable information in the diagnosis of lung diseases This
work's primary goals are to identify cancerous lung
nodules from the provided input lung image and to
categorise lung cancer according to its severity. This study
employs cutting-edge Deep learning techniques to locate
the malignant lung nodules. This study employs cutting-
edge Deep learning techniques to locate the malignant lung
nodules. Cancer patients' CT scanned lung images are
obtained from various facilities. using image processing
techniques like pre-processing, segmentation techniques
such as watershed algorithm and feature extraction, area
of interest is separated. Features such as texture,
geometric, volumetric and intensity features are extracted.
Finally, these features are classified using CNN.
Keywords- Lung Cancer, CT, Deep Learning, Watershed,
CNN. (Key words)
I. INTRODUCTION
Lung cancer disease is the second largest death threat
to the world after heart attack, as this cancer is responsible
for the largest number of deaths, compared to the number
of deaths caused by any other cancer type. [1]. Lung cancer
is characterised by unchecked cell proliferation that
results in the development of lung nodules. It is reported
that lung cancer is responsible for around 19% deaths
globally mostly due to alcohol and tobacco consumption.
The rate of survival is assured by only 15% survival
chances, for a survival period of 5 years. [2]. The main
reason for such a high fatality rate is because therapy is
delayed due to discovery occurring at a later stage.
Chances of survival can rise by 50–70% if lung cancer is
discovered sooner. Non-small cell lung cancer and small
cell lung cancer are the two major groups into which the
lung cancer can be classified based on the cell
characteristics. [7] non-small cell lung cancer is the most
common type of lung cancer contributing to about 85-90%
of total lung cancer cases, while the other 10-15% of the
cases is diagnosed with small cell lung cancer. The leading
cause of cancer-related deaths worldwide is lung cancer.
The ultimate stage of lung cancer is when the symptoms
become apparent so it is very tough to identify in its
beginning stage. Because of this, compared to all other
cancer forms, lung cancer has a particularly high mortality
rate. The two kind of lung disease which develop and
spread in an unexpected way, are small cell lung
malignancies (SCLC) and non-little cell lung tumors
(NSCLC) [1]. The phase of lung disease alludes to the
degree to which the growth has spread in the lung. The
World Health Organization reported that more than 7.6
million people worldwide lost their lives to lung cancer
each year. Moreover, the death rates of lung cancer are
expected upon to keep rising, to wind up around 17 million
worldwide in 2030[2]. Despite being the best imaging tool
in the medical sector, clinicians find it challenging to
interpret and detect cancer from CT scan data. In year of
2005, around 1,362,825 new cancer cases are expected
and around 571,590 deaths are expected to happen due to
cancer in the United States. It was evaluated that there will
be 162,921 deaths from lung cancer, which occurs 30% of
all cancer deaths. [3] The extent of the spread of cancer is
the basis for the division of lung cancer into stages. It
comprises of four stages namely stage I-The cancer is
confined to the lung, stages II and III-the cancer is confined
to the chest (with larger and more invasive tumor
classified as stage III) and Stage IV-Cancer has spread from
the chest to other parts of the body.
There are many techniques to diagnose the lung cancer
such as X-rays, Computed Tomography (CT), Magnetic
Resonance Imaging (MRI scan), and Sputum Cytology. The
problem with these techniques is that it can be time
consuming and makes detection possible only at later
stages. Despite being the best imaging tool in the medical
sector, clinicians find it challenging to interpret and detect
cancer from CT scan data. Hence, computer assisted
diagnosis might be useful for clinicians to precisely identify
the malignant cells. Computer aided techniques such as
Deep learning and image processing have been
implemented. In our proposed algorithm we have tried to
solve these problems. Our developed algorithm can detect
cancer affected cell and the corresponding stage such as
initial, middle, or final stage. If no cancer affected cell is
found in the input image, then it checks the probability of
lung cancer.
International Research Journal of Engineering and Technology (IRJET) e-ISSN: 2395-0056
Volume: 10 Issue: 04 | Apr 2023 www.irjet.net p-ISSN: 2395-0072](https://image.slidesharecdn.com/irjet-v10i450-230610121841-2d61b818/75/Lung-Cancer-Detection-Using-Deep-Learning-Algorithms-1-2048.jpg)
![International Research Journal of Engineering and Technology (IRJET) e-ISSN: 2395-0056
Volume: 10 Issue: 04 | Apr 2023 www.irjet.net p-ISSN: 2395-0072
© 2023, IRJET | Impact Factor value: 8.226 | ISO 9001:2008 Certified Journal | Page 350
Automated system for lung cancer detection.
Application of median Filter to eliminate impulse noise in
the images proved to be a success. The morphological
operations also contributed towards satisfactory results in
the process of segmentation. Artificial neural networks
proved to be a good classifier with acceptable accuracy.
The methodology adopted in this project resulted in an
accuracy of 92% for the hospital database. This system
aims at increasing the accuracy and speed of the lung
cancer detection system. It also helps in detecting the
cancer at earlier stages.
REFERENCES
[1] Bijaya Kumar Hatuwal1, Himal Chand Thapa2, “Lung
Cancer Detection Using Convolutional Neural Network on
Histopathological Images”, “International Journal of
Computer Trends and Technology” October (2020).
[2] Vaishnavi. D1, Arya. K. S2, Devi Abirami. T3, M. N.
Kavitha4, “Lung Cancer Detection using Machine
Learning”, “International Journal of Engineering Research
& Technology (IJERT)”, Special Issue – (2019).
[3] Alan L. Yuille4 “Deep Supervision for Pancreatic Cyst
Segmentation in Abdominal CT Scans” (2018).
[4] Moffy Vas1, Amita Dessai 2, “Lung cancer detection
system using lung CT image processing”, IEEE, (2017).
[5] Mario Buty1, Ziyue Xu1, Mingchen Gao”
Characterization of Lung Nodule Malignancy using Hybrid
Shape and Appearance Features” (2017).
[6] Buty, M., Xu, Z., Gao, M., Bagci, U., Wu, A., Mollura, D.J.:
Characterization of Lung Nodule Malignancy Using Hybrid
Shape and Appearance Features. In: MICCAI. pp. 662–670.
Springer (2016).
[7] Mohsen Keshani, Zohreh Azimifar and Reza Boostani,
"Lung nodule segmentation using activecontour modeling”
MVIP, IEEE, (2016).
[8] Gawade Prathamesh Pratap, R.P Chauhan, "Detection of
lung cancer cells using image processing techniques ", 1st
IEEE International Conference on Power Electronics,
Intelligent control and energy systems, IEEE, (2016)
[9] Arnaud A. A. Setio, Francesco Ciompi, Geert Litjens,
Paul Gerke, Colin Jacobs, Sarah J. van Riel,
Mathi”Pulmonary nodule detection in CT images: false
positive reduction using multi-view convolutional
networks”(2016).
[10] Junyuan Xie, Ross Girshick “Unsupervised Deep
Embedding for Clustering Analysis” (2016).
[11] Badrul Alam Mia, Mohammad Abu Yusuf, "Detection of
lung cancer from CT image using image processing and
neural network", International conference on Electrical
Engineering and Information Communication Technology
(ICEEICT), IEEE, May, (2015).
[12] K Punithavathy, M M Ramya, Sumathi Poobal,
"Analysis of statistical texture features for automatic lung
cancer detection in PET/CT images", International
Conference on Robotics, Automation, Control and
Embedded systems (RACE), IEEE ,18-20 February (2015).
[13] Muhammed Anshad, S.S Kumar, Recent methods for
the detection of tumor using computer aided diagnosis",
International Conference on Control, Instrumentation,
Communication and Computational technologies
(ICCICCT), IEEE transactions, (2014).
[14] Nooshin Hadavi, Md Jan Nordin, Ali Shojaeipour,
“Lung cancer diagnosis using CT-scan images based on
cellular learning automata”, International conference on
Computer and Information Sciences (ICCOINS), IEEE,
(2014).
[15] Anita Chaudhary, Sonit Sukhraj Singh “Lung cancer
detection on CT images using image processing”,
computing sciences 2012 international conference, IEEE,
(2012).
[16] Robert M Haralick, K.Shanmugam, Itshak Dinstein,
“Textural Features for_ Image Classification” IEEE
Transactions on Systems, Man and Cybernetics, 3(6), pp.
610- 621, (1973).
Conclusions](https://image.slidesharecdn.com/irjet-v10i450-230610121841-2d61b818/85/Lung-Cancer-Detection-Using-Deep-Learning-Algorithms-5-320.jpg)

This document discusses using deep learning algorithms to detect lung cancer from CT scans. It aims to identify cancerous lung nodules and classify the severity of lung cancer cases. The study uses techniques like preprocessing, segmentation, feature extraction and CNNs to analyze CT scan images of lung cancer patients. Features of the images like texture, geometry, volume and intensity are extracted and classified using convolutional neural networks to detect malignant lung nodules and determine the cancer stage.