This document describes the ATTA (Atom Trap Trace Analysis) experiment which aims to precisely measure trace amounts of krypton isotopes in liquid xenon. ATTA uses laser cooling and trapping techniques to isolate and count individual atoms. The document outlines the ATTA system, which involves exciting atoms to a metastable state using a plasma source, slowing and collimating atoms using optical molasses and Zeeman slowing, and finally trapping atoms using magneto-optical traps. Precisely measuring krypton contamination levels in xenon is important for the larger XENON dark matter detection experiment to understand background signals and increase sensitivity to detect weakly interacting massive particles (WIMPs).
![Abstract
XENON is a dark matter experiment that is searching for direct collisions be-
tween liquid Xenon nuclei and weakly interacting massive particles, WIMPS,
the chief candidate for dark matter. The latest detection chamber to be built
is XENON1T, with 3.3 tons of ultra radio-pure liquid Xenon, located at Lab-
oratori Nazionali de Gran Sasso (LNGS) in Italy. To increase the certainty
that a collision was due to a WIMP, impurities, especially radioactive ones, are
removed from the Xenon, and the remaining Xenon is probed for Krypton impu-
rities using an atom trap trace analysis, ATTA. The expected number of events
from regular matter can be extrapolated from the level of Krypton impurities,
and extra events outside of the expected number could be a WIMP interaction
[1]. Since ATTA traps individual atoms, the precision of each step is imperative
for the device to work properly. This summer I worked on engineering a way for
multiple pressure gauges, a thermometer, and a humidity sensor to be regularly
queried for measurements and to save those measurements to a database. I also
developed a web-page that updates with the latest values of these measurements
from the database.
1 Introduction
Although there is a large amount of theoretical and observational evidence sug-
gesting that dark matter exists and is abundant in our universe, there has yet to
be a detection of dark matter particles. There are a number of large-scale, inter-
national experiments that are searching for one class of dark matter candidates,
weakly interacting massive particles (WIMPs), through indirect and direct de-
tection. One such direct detection experiment is XENON, which searches for the
scattering of WIMPs off of the detector medium, liquid Xenon (LXe), in a dual-
phase time projection chamber. The XENON experiment has been upgraded
twice, each time increasing the volume of the detector medium but keeping the
same operating principle. The first XENON detector, XENON10 was deployed
in 2006 and contains 15 kg of LXe; the second detector, XENON100 was de-
ployed in 2008 and contains 165 kg of LXe; the third detector, XENON1T,
started construction in 2014 and will contain 3.3 tons of LXe [1].
1.1 Dark Matter and WIMPs
Dark matter is known to make up 85% of all matter in the observable universe.
It has mass but interacts with electromagnetic radiation very weakly, if at all,
which means that it cannot be seen visually. However its gravitational influences
can be seen visually; two examples of this are shown in the rotation of stars in
galaxies and gravitational lensing.
Vera Rubin and Kent Ford were the first to observe that stars in galaxies at
large radii were moving much faster than what was expected by the amount of
luminous mass. The radial velocity distribution is given by Newtonian dynamics
1](https://image.slidesharecdn.com/9ad1880f-4699-47b0-95f5-e5a1f0cec752-160818180949/85/Lister_report-3-320.jpg)
![to be v(r)= GM(r)/r where M(r) is the radial mass distribution and G is
Newton’s gravitational constant. According to this equation, at large radii the
velocity should fall as v(r) ∼ r–1/2
, but instead the velocity is seen to be almost
constant at large radii. This can be explained if there is a dark matter halo
with M(r) ∼ r. Similar rotation curves have been found at larger scales, such as
in the rotation of galaxies in a cluster. Another visual example of the effects of
dark matter is gravitational lensing. According to Einstein’s Theory of General
Relativity, light is bent in a gravitational field. This bending can be seen in the
distortion of the appearance of galaxies, even when the mass that would cause
this distortion cannot be seen. The missing mass is theorized to be dark matter.
Although the visual evidence for dark matter is interesting, the tightest con-
straints on the energy density of dark matter comes from the Cosmic Microwave
Background (CMB). The CMB was emitted shortly after the big bang when elec-
trons first combined with atoms and radiation fell out of thermal equilibrium
with matter. Although the temperature of the CMB is very isotropic, small
spatial anisotropies can be seen corresponding to relative temperature fluctua-
tions on the order of one part in 10 4
- 10 5
. These anisotropies are visualized
in a power spectrum of its temperature variation as a function of angular scale.
From the power spectrum, the total dark matter density is found to be Ωch2
=
0.1199 ± 0.0022 and the total non-relativistic matter density is found to be Ωm
= 0.316 ± 0.014 [1].
The WIMP is a dark matter particle that was produced during the big bang,
and interacts with standard particles on a strength scale of the weak nuclear
force. From the abundance of dark matter today, the WIMP’s self-annihilation
cross section can be found to be σv ∼ 3x10 –26
cm3
s–1
, which is expected
from a new particle on the 100 Gev mass scale that interacts with the weak
force. A new particle with these properties is also predicted by super-symmetric
extensions of the standard model of particle physics [5].
1.2 The Xenon Experiment
There are two possible types of interactions between a particle and the Xe
atoms, electronic and nuclear recoils. In electronic recoils, a charged particle
interacts with the electron cloud surrounding the Xe atom. In nuclear recoils, a
neutral particle collides with the Xe atom nucleus, imparting momentum to the
atom which then dissipates energy through electronic interactions. WIMPs are
expected to interact with the Xe atoms via nuclear recoils. Particle interactions
with sufficient energy will excite or ionize the Xe atom, causing a series of
chemical reactions that produces an electron or scintillation light, a photon. It
is these photons and electrons that the XENON experiments are detecting.
The XENON detectors consist of a large volume of thermally and optically
isolated LXe, used to shield the inner detector. A smaller volume of LXe and
GXe, gaseous Xenon, is enclosed and instrumented with light collection devices
that can detect single photons, called photo-multiplier tubes (PMTs). PMTs
convert incident photons to a measureable current. There is a set of PMTs
placed underneath the LXe volume facing upwards, and a second set of PMTs
2](https://image.slidesharecdn.com/9ad1880f-4699-47b0-95f5-e5a1f0cec752-160818180949/85/Lister_report-4-320.jpg)
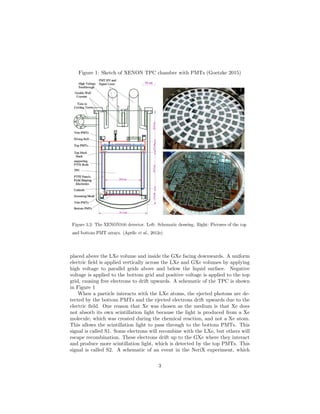
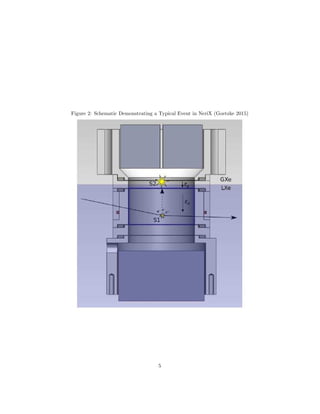
![has the same operating principle as XENON but on a smaller scale, is shown in
Figure 2.
Nuclear recoils in LXe are known to have a higher recombination fraction
than electron recoils, causing a smaller amount of escaped electrons to be de-
tected by the upper PMTs (S2). Nuclear recoils also tend to excite the Xe
atoms more often than ionizing them, causing more initial scintillation light
(S1). Therefore nuclear recoils have a smaller S2/S1 ratio than electron recoils.
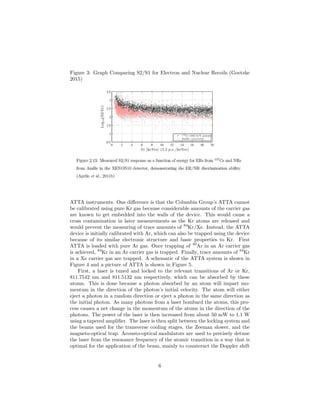
This ratio is used to discriminate whether an event was caused by a charged
particle or a neutral particle. Figure 3 demonstrates the difference of this ratio
between nuclear and electron recoil.
The scattering rate per unit mass of the target is given by
R ≈ nxσtot v mN
−1
(1)
Where nx is the local dark matter density, σtot is the total interaction cross
section, v is the average relative velocity between the WIMPs and the detector,
and mN is the mass of the target nuclei. Assuming nx is 3000 m–3
based on a
100 GeV/c2
WIMP mass, σtot is 2x10 –39
cm2
, v is 220 km/s, and mN is 131
amu, it is estimated that R ≈ 0.019 events/kg/year.
Because the expected rate of nuclear recoils of WIMPs is so low, in order
to detect a WIMP particle with high accuracy it is necessary to increase the
sensitivity to signals and efficiently differentiate WIMP signals from background
signals. One such way of doing so is to reduce the background signal by selecting
radio-pure materials to build detectors and limit the nuclear reactions of the
detector material.
Commercially available Xenon is distilled from the air, and is always contam-
inated with natural Krypton at the ppm level. One isotope of Krypton, 85
Kr, is
problematic for the experiment because it undergoes β-decay, emitting an elec-
tron. Although the detector can discriminate between electronic and nuclear
recoils with high accuracy, it is not perfect. With a discrimination accuracy of
%99.75, %0.25 of electronic recoils will be identified as nuclear recoils, and so
the electrons emitted by the decay of 85
Kr form a dominant background. The
Xenon used in the XENON experiments is first cryogenically distilled, which
reduces the level of Kr to the parts per trillion (ppt) level, which corresponds
to a 85
Kr level of 10 –23
. The level of contamination in the liquid Xenon is then
measured by ATTA and a rare gas mass spectrometer (RGMS) by collaborators
at the Max-Planck Institue in order to add to the expected background events
[1].
1.3 ATTA
The atom trap trace analysis (ATTA) technique uses laser cooling and trapping
methods to determine ultra-low isotopic abundances. The Columbia groups
ATTA is used to determine the absolute level of 85
Kr/Xe by directly measuring
the absolute abundance of 84
Kr/Xe. The Columbia University Group’s ATTA
utilizes traditional laser cooling and trapping techniques, but differs from typical
4](https://image.slidesharecdn.com/9ad1880f-4699-47b0-95f5-e5a1f0cec752-160818180949/85/Lister_report-6-320.jpg)
![of the moving atoms.
Next the atoms are excited. However the energy difference between the
ground state and the first excited state for both Ar and Kr are far in the
UV, and light sources of such wavelength are not commercially sold. Instead,
the transition between the lowest metastable state, 5s[3
2 ]2 (3
P2) and the next
excited state are used for trapping. A singly-ionized plasma source is used to
excite the gas to the first metastable state. The plasma beam is created using a
high-quality radio frequency (RF) oscillator. The carrier gas is passed through
this plasma beam, which excites the atoms to many different energy levels,
including the lowest metastable state. These atoms in the metastable state can
be trapped, although a fraction of them will return to the ground state.
The atoms are collimated into a beam by slowing in the transverse direction
using a process called optical molasses. The atoms are slowed in the longitudinal
direction by Zeeman slowing. Finally, 3D trapping is done using a magneto-
optical trap. The magneto-optical trap traps the atoms in a spherical vacuum
chamber using a combination of three sets of counter-propagating laser beams
and a varying magnetic field. The trapping efficiency is defined by the ratio of
the rate at which the isotopes of interest are loaded into the trap divided by
the consumption rate of the isotope by the device. The relative abundance of
the isotope in a sample can be found by the total number of atoms trapped in
a measurement divided by the product of the total mass consumed times the
overall trapping efficiency [1].
1.4 My Contribution
The primary goal of my work at the XENON experiment is to automate read-
ings from various instruments in the ATTA experiment, save those readings to
an existing database, and print these values to a schematic hosted on the ATTA
wiki. To do so, I had to first be able to request measurements from each de-
vice. Next I updated an existing code that regularly queries the instruments
for measurements and saves them to a database. Then, I designed and imple-
mented a way to connect multiple instruments to a hub and send data over a
USB repeater cable that is twenty-five meters long. Finally, I wrote a script for
a web-page that shows an image of a schematic of the vacuum system in the
ATTA experiment with text boxes that update with the latest values from the
database for different instruments.
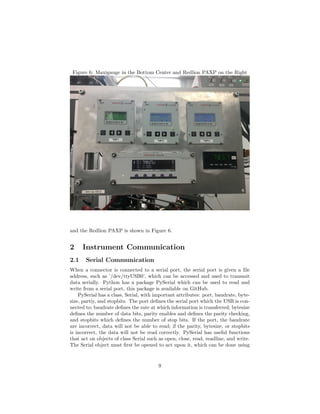
The instruments I read from included a Pfeiffer Maxigauge, a Redlion PAXP,
and Temperature and Humidity Sensors connected to a Raspberry Pi. The
Maxigauge has six sensors that connect to pressure gauges. Sensor One measures
the pressure of the sample gas. Sensor Two measures the pressure in the RF
source, labeled RF source in Figure 4. Sensor Three measures the pressure
near the second transverse cooling stage, labeled T2 in Figure 4. Sensor Four
measures the pressure inside the magneto-optical trap chamber, labeled MOT
in Figure 4. The Redlion PAXP is used to measure the pressure inside another
part of the sample gas reservoir. Raspberry Pi measures the temperature and
humidity of the room that houses ATTA. A picture of the Pfeiffer Maxigauge
8](https://image.slidesharecdn.com/9ad1880f-4699-47b0-95f5-e5a1f0cec752-160818180949/85/Lister_report-10-320.jpg)
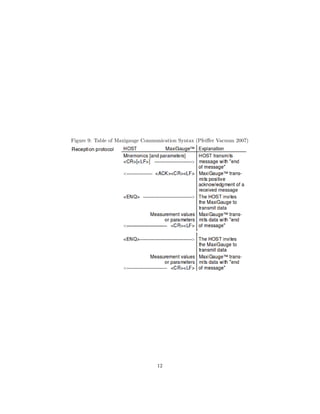
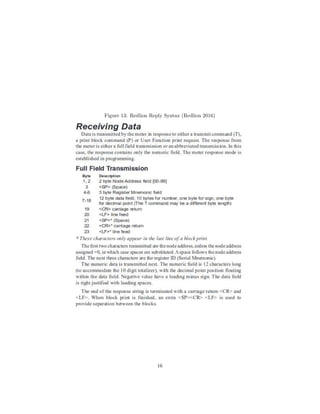
![Figure 8: Diagram of Pin Outputs (Pfeiffer Vacuum 2007)
function. If a setting was changed, the final data is the new setting. This
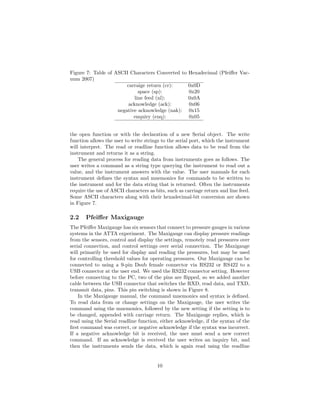
communication syntax is shown in Figure 9.
The most useful mnemonic is to read the pressure from different sensors. In
the first written string you specify the sensor number. Then the final returned
data string gives you the status of the pressure, whether its in range of the
thresholds, over the threshold, under the threshold, not connected, or giving an
error, and the pressure value [3]. The syntax of the pressure command is shown
in Figure 10.
If the Maxigauge serial port is located in /dev/ttyUSB0, the full communi-
cation protocol goes as follows:
import serial
mg = serial.Serial("/dev/ttyUSB0")
mg.write("PR1 x0D")
mg.readline()
>>>6 #Maxigauge replies with the positive acknowledge byte
mg.write("x05")
mg.readline()
>>>0,7.051e-04 #Maxigague replies with the status and pressure
2.3 Redlion PAXP
The Redlion PAXP is used to process inputs, and in our group it is used to
convert voltage to a pressure. It has a display screen with controls, which allows
our group to program a function to convert voltage to pressure and change other
settings. With a communication card we can remotely control it using an RS232
9-pin Dsub connector. Data can be read from and written to the PAXP, and we
mostly read from it. To communicate with the PAXP the user writes a string
identifying the node address; the type of command, such as reading from or
writing to the machine; and the register ID, to identify the type of value one
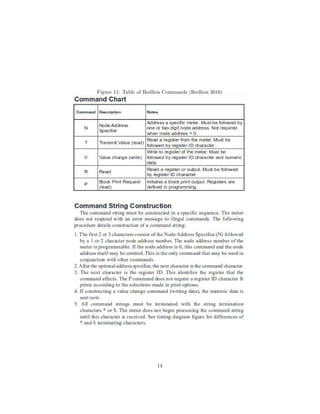
wants to read. The syntax of commands is shown in Figure 11 and Figure 12.
The node address allows one to have the PAXP connected to many different
devices, however our group only uses it to read from one voltage, so we set the
node address to zero. Therefore the node address does not have to be specified in
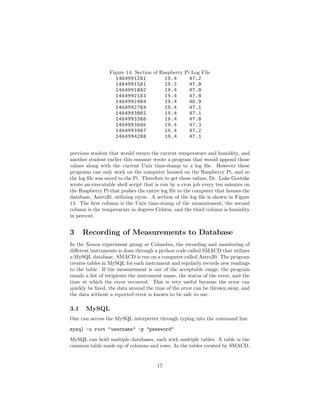
11](https://image.slidesharecdn.com/9ad1880f-4699-47b0-95f5-e5a1f0cec752-160818180949/85/Lister_report-13-320.jpg)
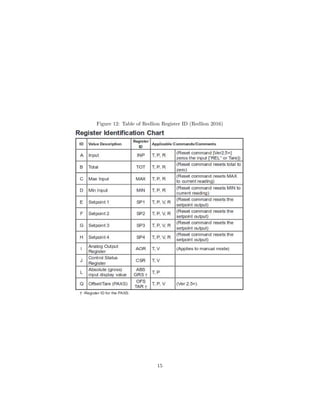
![Figure 10: Syntax of Pressure Inquiry Command (Pfeiffer Vacuum 2007)
the command string. We also only use the T command to read from the machine.
We use the A Register ID to read the input, which is internally converted in the
PAXP from voltage to pressure in Torr using a manually programmed function.
Command strings need to be appended with either * or $ to specify the response
delay with * for 50 milliseconds and $ for 2 milliseconds, we normally use the
*. The command string used to read the pressure is TA*. Once that command
is written we use the function readline to read the pressure. Because we read
from the input register ID, the returned field contains the three bit register ID,
INP, and the pressure [2]. The syntax of the response string is shown in Figure
13.
A typical serial communication with the PAXP goes as follows with the
PAXP serial port located in the /dev/ttyUSB0 file.
import serial
Redlion = serial.Serial("/dev/ttyUSB0")
Redlion.write(’TA*’)
Redlion.readline()
>>>INP 731.0 #PAXP replies with the Register ID and the converted pressure
2.4 Temperature and Humidity Sensors
In the room that houses ATTA, a Raspberry Pi has been set up to record
temperature and humidity of the room. A Python program was written by a
13](https://image.slidesharecdn.com/9ad1880f-4699-47b0-95f5-e5a1f0cec752-160818180949/85/Lister_report-15-320.jpg)
![always be synced up perfectly, and SMACD gives an error if two values with
the same time-stamp are saved to the database.
4 Hardware
The Astro20 computer is across the cyclotron building from the ATTA exper-
iment, and cables that run from the instruments to Astro20 have to be about
twenty-five meters long. To limit the chance that cables become tangled and
to limit clutter in the lab, we decided to design a way that one cable could run
from Astro20 to the room that houses ATTA and then split to each instrument.
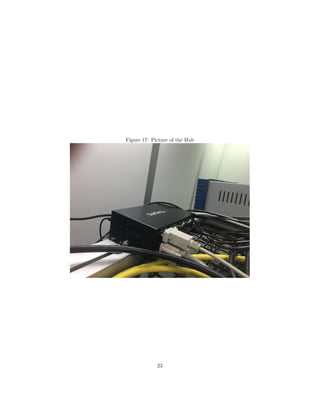
After researching ways to do this, we ordered a hub that splits from one female
USB B input to eight DB 9 male connectors. We chose to use this hub be-
cause when it is connected to a computer, it automatically opens eight different
consecutive serial port addresses corresponding to the numbers labeled on each
connector. This allows us to easily address each instrument separately using the
constructor of the class Serial. The hub can draw power from the USB input if
the other end is connected directly to a computer, and it can also draw power
from an M12 connector. To test the hub, we connected a USB A to USB B cable
from a laptop to the hub. Then from the hub we connected the Redlion PAXP
to one DB 9 connector, and SMACD successfully ran and saved measurements
to the database on the laptop. A picture of the Hub is shown in Figure 17.
Another issue was the length of USB cables. USB cables were designed to
run a maximum of five meters [4], which is too small for the distance between
Astro20 and the hub. To circumvent this problem, we ordered a USB repeater
cable. This cable is designed to extend USB beyond the five meters by connect-
ing one port hubs together in series. The repeater cable we use runs twenty-five
meters.
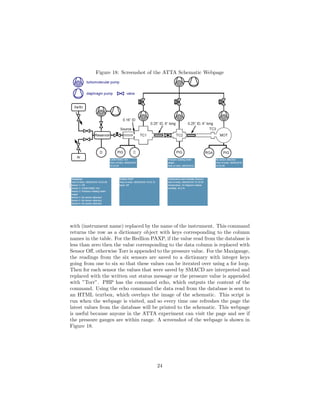
5 ATTA Schematic
I created a webpage that overlays text boxes with the last readings from the
database on a picture of a schematic of the vacuum systems used in the ATTA
experiment. To do so a combination of PHP and HTML is used. HTML is
a markup language for describing web pages. Every content in the document
is surrounded by tags, denoted by the brackets <>. For example the content
of the header section is in between the tags <head> and </head>, with the
/ denoting the closing tag. PHP is a server-side scripting language used for
web development and can be embedded into HTML scripts. PHP is compatible
with MySQL and allows the user to write commands and retrieve returned values
from MySQL commands. A PHP program is started with the tag <?php>, and
supports variables. PHP is used to retrieve rows from the database on Astro20.
To do so, a connection to the database is created, and the following command
is sent:
SELECT * FROM (instrument name) ORDER BY (instrument name)_id DESC LIMIT 1;
22](https://image.slidesharecdn.com/9ad1880f-4699-47b0-95f5-e5a1f0cec752-160818180949/85/Lister_report-24-320.jpg)
![6 Conclusion
During my time with the XENON group I engineered a way for readings from
various instruments in the ATTA system to be continuously saved to a database,
and designed a webpage with a schematic of the ATTA vacuum system that
updates with the latest measurements from the database. Because of my work,
collaborators can see the status of many different vacuum systems in ATTA
from their computers anywhere with internet access, allowing them to know the
status of the experiment whenever they want. And because SMACD already had
the alarm notifications, collaborators will be emailed when there is a problem
with any of the pressure gauges. This allows them to throw out any data around
the time of the error and ensures that the data without an error is sound.
7 Acknowledgements
I would like to thank Dr. Elena Aprile, Columbia University’s REU program,
and the National Science Foundation for this opportunity; Dr. Luke Goetzke
and Zach Greene for all their help; Damon Daw and Tianyu for helping me
navigate through the ATTA room; and the entire XENON group at Columbia
for making my time here so wonderful.
References
[1] Goetzke, L. Low-Energy Electronic Recoils in Liquid Xenon: Search for An-
nual Modulation with XENON100, Measurement of Charge and Light Yield
with neriX, and Measurement of Krypton in Xenon with ATTA Columbia
University, 2015.
[2] MODEL PAX 1/8 DIN ANALOG INPUT PANEL METERS Redlion,
April 2016.
[3] TPG 256 A Vacuum measurement and control unit for Compact Gauges
MaxiGauge Pfeiffer Vacuum, 2007.
[4] Universal Serial Bus Specification Revision 2.0 Compaq Computer Corpo-
ration, Hewlett-Packard Company, Intel Corporation, Lucent Technologies
Inc, Microsoft Corporation, NEC Corporation, Koninklijke Philips Electron-
ics N.V. April 27, 2000
[5] Jungman, Kamionkowski and Griest Supersymmetric dark matter Physics
Reports, 1996.
25](https://image.slidesharecdn.com/9ad1880f-4699-47b0-95f5-e5a1f0cec752-160818180949/85/Lister_report-27-320.jpg)


