Liquid turbine flow meter
•
0 likes•24 views

This document provides installation and operation instructions for a liquid turbine flow meter. It describes the technical specifications of the flow meter, including its measuring principles, materials, flow ranges, accuracy levels, and operating conditions. It also provides cautions and guidelines for proper installation, such as requiring fully filled pipes to avoid bubbles, minimum straight pipe lengths upstream and downstream, and maintaining sufficient backpressure to prevent cavitation.

Recommended
More Related Content
What's hot
What's hot (16)
Similar to Liquid turbine flow meter
Similar to Liquid turbine flow meter (20)
More from Dalian Zero Instrument Technology Co., Ltd China
More from Dalian Zero Instrument Technology Co., Ltd China (20)
Recently uploaded
Recently uploaded (20)
Liquid turbine flow meter
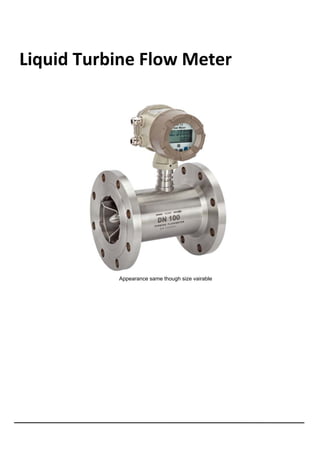
- 1. Liquid Turbine Flow Meter Appearance same though size vairable
- 3. 2 1. General Information This manual will assist you in installing, using and maintaining your flow meter. It is your responsibility to make sure that all operators have access to adequate instructions about safe operating and maintenance procedure. Warning For your safety, review the major warnings and cautions below before operating your equipment. 1. Use only fluids that are compatible with the housing material and wetted components of your turbine. 2. When measuring flammable liquids, observe precautions against fire or explosion. 3. When handling hazardous liquids, always follow the liquid manufacturer’s safety precautions. 4. When working in hazardous environments, always exercise appropriate safety precautions. 5. During turbine removal, liquid may spill. Follow the liquid manufacturer’s safety precautions for clean up of minor spills. 6. Do not blow compressed air through the turbine. 7. Handle the rotor carefully. Even small scratches or nicks can affect accuracy. 8. When tightening the turbine, use a wrench only on the wrench flats. 9. For best results, calibrate the meter at least 1 time per year. 1.1 Product Description Operating Principle: Liquid flows through the turbine housing causing an internal rotor to spin. As the rotor spins, an electrical signal is generated in the pickup coil. This signal is converted into engineering units (liters, cubic meters, gallons etc.) on the local display where is applicable. Optional accessory modules can be used to export the signal to other equipment. Upon receipt, examine your meter for visible damage. The turbine is a precision measuring instrument and should be handled carefully. Remove the protective plugs and caps for a thorough inspection. If any items are damaged or missing, contact us. Make sure the turbine flow model meets your specific needs. For your future reference, it might be useful to record this information on nameplate in the manual in case it becomes unreadable on the turbine. Refer to the nameplate for your customized product’s specification.
- 4. 3 2. Technical Data Measuring system Application range Liquid: water; diesel; gasoline (1) Without Impurity (2) Low viscosity Measured Value Primary measured value Flow Rate Secondary measured value Volume flow Design Features Modular construction The measurement system consists of a flow sensor and a signal converter. It is available as compact and as separate version. Compact version converter N Type: Pulse output without local display A Type: 4‐20mA Output without local display B Type: Local Display; Lithium Battery Power; No Output C Type: Local Display; 24V DC Power; 4‐20mA Output; Optional Function: (1) Backup Power Supply: Lithium Battery (2) Modbus RS485 (3) Pulse Output Connection Thread: DN4‐DN50 Flange: DN15‐DN200 (DIN, ANSI, JIS) Wafer: DN15‐DN100 Measurement Ratio Standard – 10:1; Optional: 20:1 Measuring accuracy Flow conditions similar to EN 29104 Medium: Water Electrical conductivity: ≥ 300 μS/cm Temperature: +10...+30°C / +50...+86°F Inlet section: ≥ 10 DN Reference conditions Operating pressure: 1 bar / 14.5 psig Flow Meter Accuracy Standard: 1.0% of rate Optional: 0.5% of rate
- 5. 4 Operating conditions Temperature T1 Level: ‐20...+80°C T2 Level: ‐20...+120°C Process temperature T3 Level: ‐20...+150°C Standard (with aluminum converter housing): Ambient temperature (all versions) ‐10…+55°C Storage temperature ‐20...+70° Pressure DN100…DN200: PN 16 DN15…DN80: PN 25 EN 1092‐1 Other pressures on request 1/2”...8": 150 lb RF ASME B16.5 Other pressures on request 1/2”...8": 10 K JIS Other pressures on request Installation conditions Installation Take care that flow sensor is always fully filled For detailed information see chapter "Cautions for Installation" Flow direction Forward Arrow on flow sensor indicates flow direction. Inlet run ≥ 10 DN Outlet run ≥ 5 DN
- 6. 5 Materials Sensor housing SS304 Other materials on request Flanges SS304 Other materials on request Rotor EN10088‐3 1.4021 X20Cr13 AISI 420 BS 420S37 Standard: 2Cr13 JIS SUS410J1 Optional: CD4MCu DN15…DN80 Bearings and Shaft Tungsten Carbide Converter Housing Standard: polyurethane coated die‐cast aluminum Process connections Flange EN 1092‐1 DN15...200 in PN 6...40 ASME 1/2”…8" in 150 lb RF JIS 1/2”…8” in 10...20K Design of gasket surface RF Other sizes or pressure ratings on request Thread DN4…DN50 in PN63 Measurable Flow Rate Range: Note: The flow range as blow is for reference only. Consult the factory if you have special requirement. Refer to the nameplate or certificate for actual flow range. Nominal Diameter Standard Flow Range Extended Flow Range (mm) (in.) (m3/h) (m3/h) 4 0.15 0.04 to 0.25 0.04 to 0.4 6 0.25 0.1 to 0.6 0.06 to 0.6 10 0.4 0.2 to 1.2 0.15 to 1.5 15 0.5 0.6 to 6 0.4 to 8 20 0.75 0.8 to 8 0.45 to 9 25 1 1 to 10 0.5 to 10 32 1.25 1.5 to 15 0.8 to 15 40 1.5 2 to 20 1 to 20 50 2 4 to 40 2 to 40 65 2.5 7 to 70 4 to 70 80 3 10 to 100 5 to 100 100 4 20 to 200 10 to 200 125 5 25 to 250 13 to 250 150 6 30 to 300 15 to 300 200 8 80 to 800 40 to 800
- 7. 6 3. ‐ Description Diameter Three Digitals; for example: 010: 10 mm; 015: 15 mm; 080: 80 mm; 100: 100 mm No display; 24V DC; Pulse Output No display; 24V DC; 4‐20mA Output Local display; Lithium Battery Power; No output Local display; 24V DC Power; pulse output & RS485 Optional backup power: Lithium Battery Local display; 24V DC Power; 2 ‐ wire 4‐ 20mA Output Optional backup power: Lithium Battery Local display; 24V DC Power; 3 ‐ wire 4‐ 20mA and pulse Output, with RS485 Optional backup power: Lithium Battery Converter Local display; 24V DC Power; 4‐wire 4‐20mA Output & HART Communication 1.0% of Rate Accuracy 0.5% of Rate Standard Range: refer to flow range table Flow Range Wide Range: refer to flow range table SS304 Body Material SS316 Safety Field without Explosion Explosion Rating ExdIIBT6 Per Standard Pressuring Rating Customized Pressure Rating DXX: D06, D10, D16, D25, D40 D06: DIN PN6; D10: DIN PN10 D16: DIN PN16; D25: DIN PN25 D40: DIN PN40 ANSI 150#; ANSI 300# ANSI 600# Connection Thread; DN4…DN50 ‐20...+80°C ‐20...+120°C Fluid Temperature ‐20...+150°C Model Code: Specifications optional Z100TB
- 8. 7 4. Cautions for Installation 4.1 Mounting Positions • Pipes must be fully filled with liquids. It is essential that pipes remain fully filled at all times, otherwise flow rate indications may be affected and measurement errors may be caused. • Avoid Air Bubbles. If air bubbles enter a measurement pipe, flow rate indications may be affected and measurement errors may be caused. • Avoid all pipe locations where the flow is pulsating, such as in the outlet side of piston or diaphragm pumps. • Avoid locations near equipment producing electrical interference such as electric motors, transformers, variable frequency, etc. • Install the meter with enough room for future access for maintenance purposes. Warning: Precaution for direct sunshine and rain when the meter is installed outside.
- 10. 9 The recommended guidelines are given to enhance accuracy and maximize performance. Distance given here are minimum requirements; double them for desired straight pipe lengths. • Upstream: allow a minimum straight pipe length at least 10 times the internal diameter of the pipe. For example, with the 50mm pipe, there should be 500mm of straight pipe immediately upstream. Desired upstream straight pipe length is 1000mm. • Downstream: allow a minimum straight pipe length at least 5 times the internal diameter of the pipe. For example, with the 50mm pipe, there should be 250mm of straight pipe immediately upstream. Desired upstream straight pipe length is 500mm. 4.3 Anti‐Cavitation Cavitation can be caused by entrained air, and it can seriously damage the rotor on a turbine flow meter. An amount higher than about 100 mg/l of entrained air or gas can produce error. In addition, cavitation can be caused by too little backpressure on the flow meter. For turbine flow meters, you should provide a backpressure (downstream pressure) of at least 1.25 times the vapor pressure, plus 2 times the pressure drop through the flow meter. See formula 1. Formula 1: Pb ≥ 1.25×Pv + 2× (Pin – Pout) In formula 1: (Pb: Back pressure; Pv: Vapor Pressure; Pin: Inlet Pressure; Pout: Outlet Pressure) Create backpressure by installing a control valve on the downstream side of the meter at the proper distance detailed above. Special Notice ♦ Foreign material in the liquid being measured can clog the meter’s rotor and adversely affect accuracy. If this problem is anticipated or experienced, install screens to filter impurities from incoming liquids. ♦ To ensure accurate measurement, drain all air from the system before use. ♦ When the meter contains removable coverplates. Leave the coverplate installed unless accessory modules specify removal. Don’t remove the coverplates when the meter is powered, or electrical shock and explosion hazard can be caused.
- 11. 10 4.4 Connections 4.4.1 Thread Connection Note: Default Thread is Male G Thread, other thread are available on request. For example: Female NPT Thread, Male NPT Thread; Consult us for more information DN4…DN10: Straight Runs and filter are included in the length for DN4 to DN10. DN15…DN50: Straight Runs are optional on request. Diameter (mm) L (mm) Thread Criteria 4 270 G ½” 6 270 G ½” 10 390 G ½” 15 75 G 1” 20 80 G 1” 25 100 G 1‐¼” 32 140 G 2” 40 140 G 2” 50 150 G 2‐1/2”
- 12. 11 4.4.2 Flange Connection ANSI Flange Meter Dimensions Size Code A ANSI Flange Rating Class Flange Diameter (B) Bolt Hole Diameter Bolt Circle Diameter (PCD) Bolt Hole Quantity (inch) (mm) (mm) (mm) (mm) (mm) 1/2" 15 75 150 89 16 60 4 300 95 16 67 4 3/4" 20 80 150 99 16 70 4 300 117 19 83 4 1" 25 100 150 108 16 79 4 300 124 19 89 4 1-1/4" 32 140 150 115 16 89 4 300 135 19 98 4 1-1/2" 40 140 150 127 16 99 4 300 155 22 114 4 2" 50 150 150 152 19 121 4 300 165 19 127 8 2-1/2" 65 170 150 180 19 140 4 300 190 22 149 8 3" 80 200 150 191 19 152 4 300 210 22 168 8 4" 100 220 150 229 19 191 8 300 254 22 200 8 5" 125 250 150 255 22 216 8 300 280 22 235 8 6" 150 300 150 279 22 241 8 300 318 22 270 12 8" 200 360 150 343 22 298 8 300 381 25 330 12
- 13. 12 DIN Flange Meter Dimensions Size Code A DIN Flange Pressure Rating Flange Diameter (B) Bolt Hole Diameter Bolt Circle Diameter (PCD) Bolt Hole Quantity (inch) (mm) (mm) MPa (mm) (mm) (mm) 1/2" 15 75 2.5 95 14 65 4 3/4" 20 80 2.5 105 14 75 4 1" 25 100 2.5 115 14 85 4 1-1/4" 32 140 2.5 140 14 100 4 1-1/2" 40 140 2.5 150 18 110 4 2" 50 150 2.5 165 18 125 4 2-1/2" 65 170 1.6 185 18 145 4 3" 80 200 1.6 200 18 160 8 4" 100 220 1.6 220 18 180 8 5" 125 250 1.6 250 18 210 8 6" 150 300 1.6 285 22 240 8 8" 200 360 1.6 340 22 295 12
- 14. 13 5. Electrical Wiring Warning: Electrical Hazard Disconnect power before beginning wiring. 5.1 Pulse Output, Basic Model. Cable Color Terminal Symbols Description Red Wire Power (+) Power Supply: “24V+” White Wire Common GND Yellow Wire Pulse (+) Pulse Output 5.2 Pulse Output, explosion proof model. Terminal Configuration Terminal Wiring Terminal Symbols Description + Power Supply: “24V+” ‐ GND Pulse Output 5.3 A; two‐wire 4‐20mA Output, No Local Display. Terminal Configuration Terminal Wiring Terminal Symbols Description +A Power Supply: “24V+” ‐B Current Output
- 15. 14 5.4 B, C, C1; Local Display Note: Terminal configuration is same for B, C and ‐C1, but some functions are ONLY available on specified model. The table lists the function of each model. Function List for converter with local display Model Primary Power Supply Optional Dual Power Supply Output Optional Dual Output Communication Note Lithium Battery Not Available Not Available Not Available Not Available 24V DC Lithium Battery Pulse Not Available Modbus RS485 24V DC Lithium Battery 4‐20mA Not Available Not Available 24V DC Lithium Battery 4‐20mA Pulse output Modbus Rs485 Output is only available when 24V Power supply is on. Terminal Configuration 13456782 GND 485A 485B IOUT+ IOUT- FOUT GND +24V+ - ON 1 2 3 ON OFF DIP Switch: K1 Function 1 2 3 Original Pulse Output ON OFF OFF Scaled Pulse Output: 1 m3 / Pulse OFF ON OFF Scaled Pulse Output: 1L/Pulse; 10L/Pulse; 100L/Pulse Configure it in parameter setting OFF OFF ON Terminal Wiring 5.4.1 if the display is blank, put the plug of battery into the battery socket (BAT1).
- 16. 15 5.4.2 Model Function (Optional) Terminal Code Terminal Symbols Description 7 +24V 24V DC+ Power Supply 8 GND GND 5 FOUT Pulse output+ 6 GND Pulse output‐ 1 485A RS485+ C1 Pulse & RS485 Output 2 485B RS485‐ 3 IOUT+ 24V DC+ Power Supply C2 (2 wires) 4‐20mA Output 4 IOUT‐ GND 7 +24V 24V DC+ Power Supply 8 GND GND 4 IOUT‐ Current output 4‐20mA‐ 5 FOUT Pulse output + 1 485A RS485+ C3 (3 wires) 4‐20mA & Pulse & RS485 Output 2 485B RS485‐ Electrical Wiring Diagram Z100TB
- 17. 16 5.5 Function List for converter with local display Model Power Supply Output Optional Dual Output Communication Note 24V DC 4‐20mA (4‐wire) Not Available HART Electrical Wiring Diagram Z100TB
- 18. 17 6. Programming and Setup : All flowmeters are tested and calibrated prior to leaving the factory, and the unique K‐factor is provided on the calibration certificate. Keep the calibration certificate well to avoid the loss of K‐factor. 6.1 No display; Pulse Output Customer should set the correct K‐factor into PLC or Flow totalizer in order to get the correct flow rate. 6.2 No display; 4‐20mA Output Only perform the Zero Point Calibration where it’s necessary. 6.2.1 Zero Point Calibration (1) Shut off the value where the flowmeter is installed, ensure there is no flow rate in pipe. (2) Put high accuracy amperometer into the circuit loop as series connection. (3) Adjust the potentiometer W502 to make sure the display on amperometer is 4mA. 6.2.2 Full Scale Calibration: it’s ONLY available for factory; return the flowmeter to factory for full scale calibration where is applicable. 6.3 series Note: all menus are present in all signal converter versions, but some parameter settings are ONLY valid for specified models. 6.3.1 Display and Keys ① Flow Rate ② Total Flow ③ Keys (See table below for function and representation in text) Z100TB
- 19. 18 Key Measuring mode Menu mode Sub‐menu or function mode Parameter and data mode Enter 1. Display the frequency corresponding to flow rate 2. Enter the parameter setting mode Select menu Press 1 time, return to menu mode, data saved Save the value and advance to next menu ‐ ‐ ‐ For numerical values, move cursor one position to the right or left ‐ ‐ Select sub‐menu or function Use cursor highlighted to change number, unit, setting Esc ‐ Return to measuring mode but prompt whether the data should be saved Return to measuring mode but prompt whether the data should be saved Return to measuring mode but prompt whether the data should be saved Note: Data are not saved when press “Esc” to return to measuring mode. If the value need to be changed, press “Enter” to save value first 6.3.2 Parameters Set Press “Enter” two times at measuring mode, it leads to Password Menu “‐ ‐ ‐ ‐“. (1) Input correct password and press “Enter” can start parameter setting. (2) Press “Enter” again and no password is input can ONLY view all parameters The total menus in “Parameters Set” are 16, and users can access and modify these menus depending on the input password grade. See table below for more information on password grade. Table. Description of Password Grade Password Grade Password Login Privileges Grade 1 No Password Requirement Read Only Grade 2 1234 Read and Edit Grade 3 5678 Save all data as factory defaults Grade 4 1111 Reload factory defaults Note: parameter setting can be ONLY performed by authorized engineer, as parameter change can affect the accuracy of the flowmeter.
- 20. 19 Specific Menu – Parameters Set Menu Parameter Name Setting Method Grades Range F‐‐‐01 Flow Rate Unit Select Parameter Factory ONLY 1; 2; 3 F‐‐‐02 Scaled Pulse Output In Liters Select Parameter User 1: 1 Liter/Pulse 10: 10 Liter/Pulse 100: 100 Liter/Pulse F‐‐‐03 Damping Time Input Value User Unit: Second Value: 1‐10 F‐‐‐04 Maximum Flow Rate Input Value User Unit: same as Flow Rate F‐‐‐05 Minimum Flow Rate Input Value User Unit: same as Flow Rate F‐‐‐06 Maximum Frequency Output Input Value User 0‐3000 Hz Accuracy: 0.1Hz F‐‐‐07 Baud Rate Select Parameter User 1200; 2400; 4800; 9600; 19200 Data Format: n; 8; 1 F‐‐‐08 Device Address Input Value User 01‐99 F‐‐‐09 Frequency Output Mode Select Parameter User 1; 2 F‐‐‐10 Total Flow Reset Input Value User Reset the new value and press “Enter” to confirm the change promptly. P1 Linearization of the Flowcurve: point 1 Input Value Factory ONLY First Row: Frequency (P1) Second Row: K‐Factor (P1) P2 Linearization of the Flowcurve: point 2 Input Value Factory ONLY First Row: Frequency (P2) Second Row: K‐Factor (P2) P3 Linearization of the Flowcurve: point 3 Input Value Factory ONLY First Row: Frequency (P3) Second Row: K‐Factor (P3) P4 Linearization of the Flowcurve: point 4 Input Value Factory ONLY First Row: Frequency (P4) Second Row: K‐Factor (P4) P5 Linearization of the Flowcurve: point 5 Input Value Factory ONLY First Row: Frequency (P5) Second Row: K‐Factor (P5) P Average Input Value Factory ONLY First Row: Frequency (P) Second Row: K‐Factor (P)
- 21. 20 6.3.3 Parameter Function Table No. Function Settings / descriptions F‐‐‐01 Flow Rate Unit Selectable: 1, 2, 3 1: m3; 2: Liter; 3. Factory Reserved Consult the factory first to change the unit, as the K‐factor should also be changed. F‐‐‐02 Scaled Pulse Output In Liters Selectable: 1, 10, 100 1: 1 liter/Pulse; 10: 10 Liters/Pulse; 100: 100 Liters/Pulse Only valid for model supporting Pulse Output; and Position 3 of DIP Switch is ON, others two are OFF. F‐‐‐03 Damping Time Value: 1‐10 second; Recommended Value: 4 Second Flow Range F‐‐‐04 Maximum Flow Rate Unit: same as Flow Rate F‐‐‐05 Minimum Flow Rate Unit: same as Flow Rate Frequency Output F‐‐‐06 Maximum Frequency Output Value: 0‐3000 Hz Accuracy: 0.1Hz RS485 Communication Selectable: 1200; 2400; 4800; 9600; 19200 (Unit: Hz) F‐‐‐07 Baud Rate Default Data Format: 9600, n, 8, 1 F‐‐‐08 Device Address Value: 01‐99 Selectable: 1, 2 F‐‐‐09 Frequency Output Mode 1: Original Pulse Output without linearization 2: Corrected Pulse Output after linearization Reset Total Flow F‐‐‐10 Total Flow Reset Reset the new value and press “Enter” to confirm the change promptly. Linearization P1 Linearization of the Flowcurve: point 1 First Row: Frequency (P1) Second Row: K‐Factor (P1) P2 Linearization of the Flowcurve: point 2 First Row: Frequency (P2) Second Row: K‐Factor (P2) P3 Linearization of the Flowcurve: point 3 First Row: Frequency (P3) Second Row: K‐Factor (P3) P4 Linearization of the Flowcurve: point 4 First Row: Frequency (P4) Second Row: K‐Factor (P4) P5 Linearization of the Flowcurve: point 5 First Row: Frequency (P5) Second Row: K‐Factor (P5) P Average K‐Factor First Row: Frequency (P) Second Row: K‐Factor (P)
- 22. 21 6.4 6.4.1 Display and Keys ① Flow Rate ② Sensor K‐Factor ③ Frequency ④ Keys (See table below for function and representation in text) Key Measuring mode Menu mode Sub‐menu or function mode Parameter and data mode Return to last menu Return to measuring mode but prompt whether the data should be saved Return to measuring mode but prompt whether the data should be saved ‐ Select main menu Select sub‐menu or function Use cursor highlighted to change number, unit, setting ‐ Select main menu Select sub‐menu or function Use cursor highlighted to change number, unit, setting Enter the parameter setting mode advance to next sub‐ menu Advance to next menu For numerical values, move cursor one position to the right or left
- 23. 22 6.4.2 Parameters Set 1. When power on, firstly press key and enter the parameter setting mode. In “Parameter set” there are five main menus, thereof, Basic, System, Calibration, Test, Detail, among of them, System and Detail are needed to input Password, others are not. Main Menu lists Password Login Privileges Basic No Password Requirement Read and Edit System Default: 0200 Read and Edit Calibration No Password Requirement Read and Edit Test No Password Requirement Read and Edit Detail Default: 1111 Read and Edit 2. Press key and hold for 5 seconds, the Total Flow will be displayed on LCD screen, then press key about 5 seconds into lock screen status if only keep total flow on display. Note: parameter setting can be ONLY performed by authorized engineer, as parameter change can affect the accuracy of the flowmeter. Specific Menu – Parameters Set Main menu Sub‐menu Setting Method Grades Range PV Units Select Parameter Factory Only m3/h Other options PV Decimal Select Parameter User 1; 2; 3 Total Units Select Parameter Factory Only L, m3, Gal Total Decimal Select Parameter User 1; 2; 3 Basic Damping time(s) Input value User Unit: Second Value: 0.1‐99.9 New password Input value User xxxx Language Select Parameter User English; Chinese System Signal Qmax (m3/h) Input value User Unit: same as Flow Rate
- 24. 23 Low Cutoff (%) Input value User Unit: % Freq Max (Hz) Input value User Unit: Hz Liter/Pulse Input value User Unit: Liter/Pulse Pulse Width (ms) Input value User Unit: ms Pulse output Pulse Level Select Parameter User Active L; Active H HART Address Input value Factory Only 00‐15 Select Parameter User NO; Yes Total Set Input value User Unit:m3 Load settings Select Parameter User NO; Yes 4mA Trim Input value Factory Only Calibration 20mA Trim Input value Factory Only Loop test Input value Factory Only Test Pulse test Input value Factory Only New password Input value User xxxx Sensor K Input value Factory Only Freq Direct Select Parameter User NO; Yes Linearization of the Flowcurve: point 1 Input Value Factory ONLY First Row: Frequency (P1) Second Row: K‐Factor (P1) Linearization of the Flowcurve: point 2 Input Value Factory ONLY First Row: Frequency (P2) Second Row: K‐Factor (P2) Linearization of the Flowcurve: point 3 Input Value Factory ONLY First Row: Frequency (P3) Second Row: K‐Factor (P3) Revise Linearization of the Flowcurve: point 4 Input Value Factory ONLY First Row: Frequency (P4) Second Row: K‐Factor (P4) Detail Save Settings Select Parameter Factory Only NO; Yes
- 27. 26 7. Troubleshooting Symptom Probable Cause Solution 1. Rotor may drag due to foreign matter obstruction. Check for debris inside the meter. Clean and reassemble. 2. Magnetic pickup not screwed down all the way into the turbine flowmeter body. This causes it not to detect all the rotor blades as they pass Screw the magnetic pickup all the way down into the turbine flow‐meter body. Hand‐tighten only. 3. Turbine Flowmeter installed backwards Install the flowmeter in accordance with the process flow direction 4. Turbine flowmeter rotor installed backwards Install the flowmeter rotor in accordance with the process flow direction More Volume/Output than displayed or registered 5. K‐factor is too high in electronic/readout device Verify K‐factor used. K‐factor should be decreased. 1. Caused by trapped air in the process line Install an air eliminator upstream of turbine flowmeter. Less Volume/Output than displayed or registered 2. K‐factor is too low in electronic/readout device Verify K‐factor used. K‐factor should be increased. 1. Battery Power Type: Bad contact on the connector between battery and PCB Open back cover and repower the flow meter Flow rate indication is unstable 2. DC Power Type: supply voltage is abnormal Check and ensure power supply is 24V DC