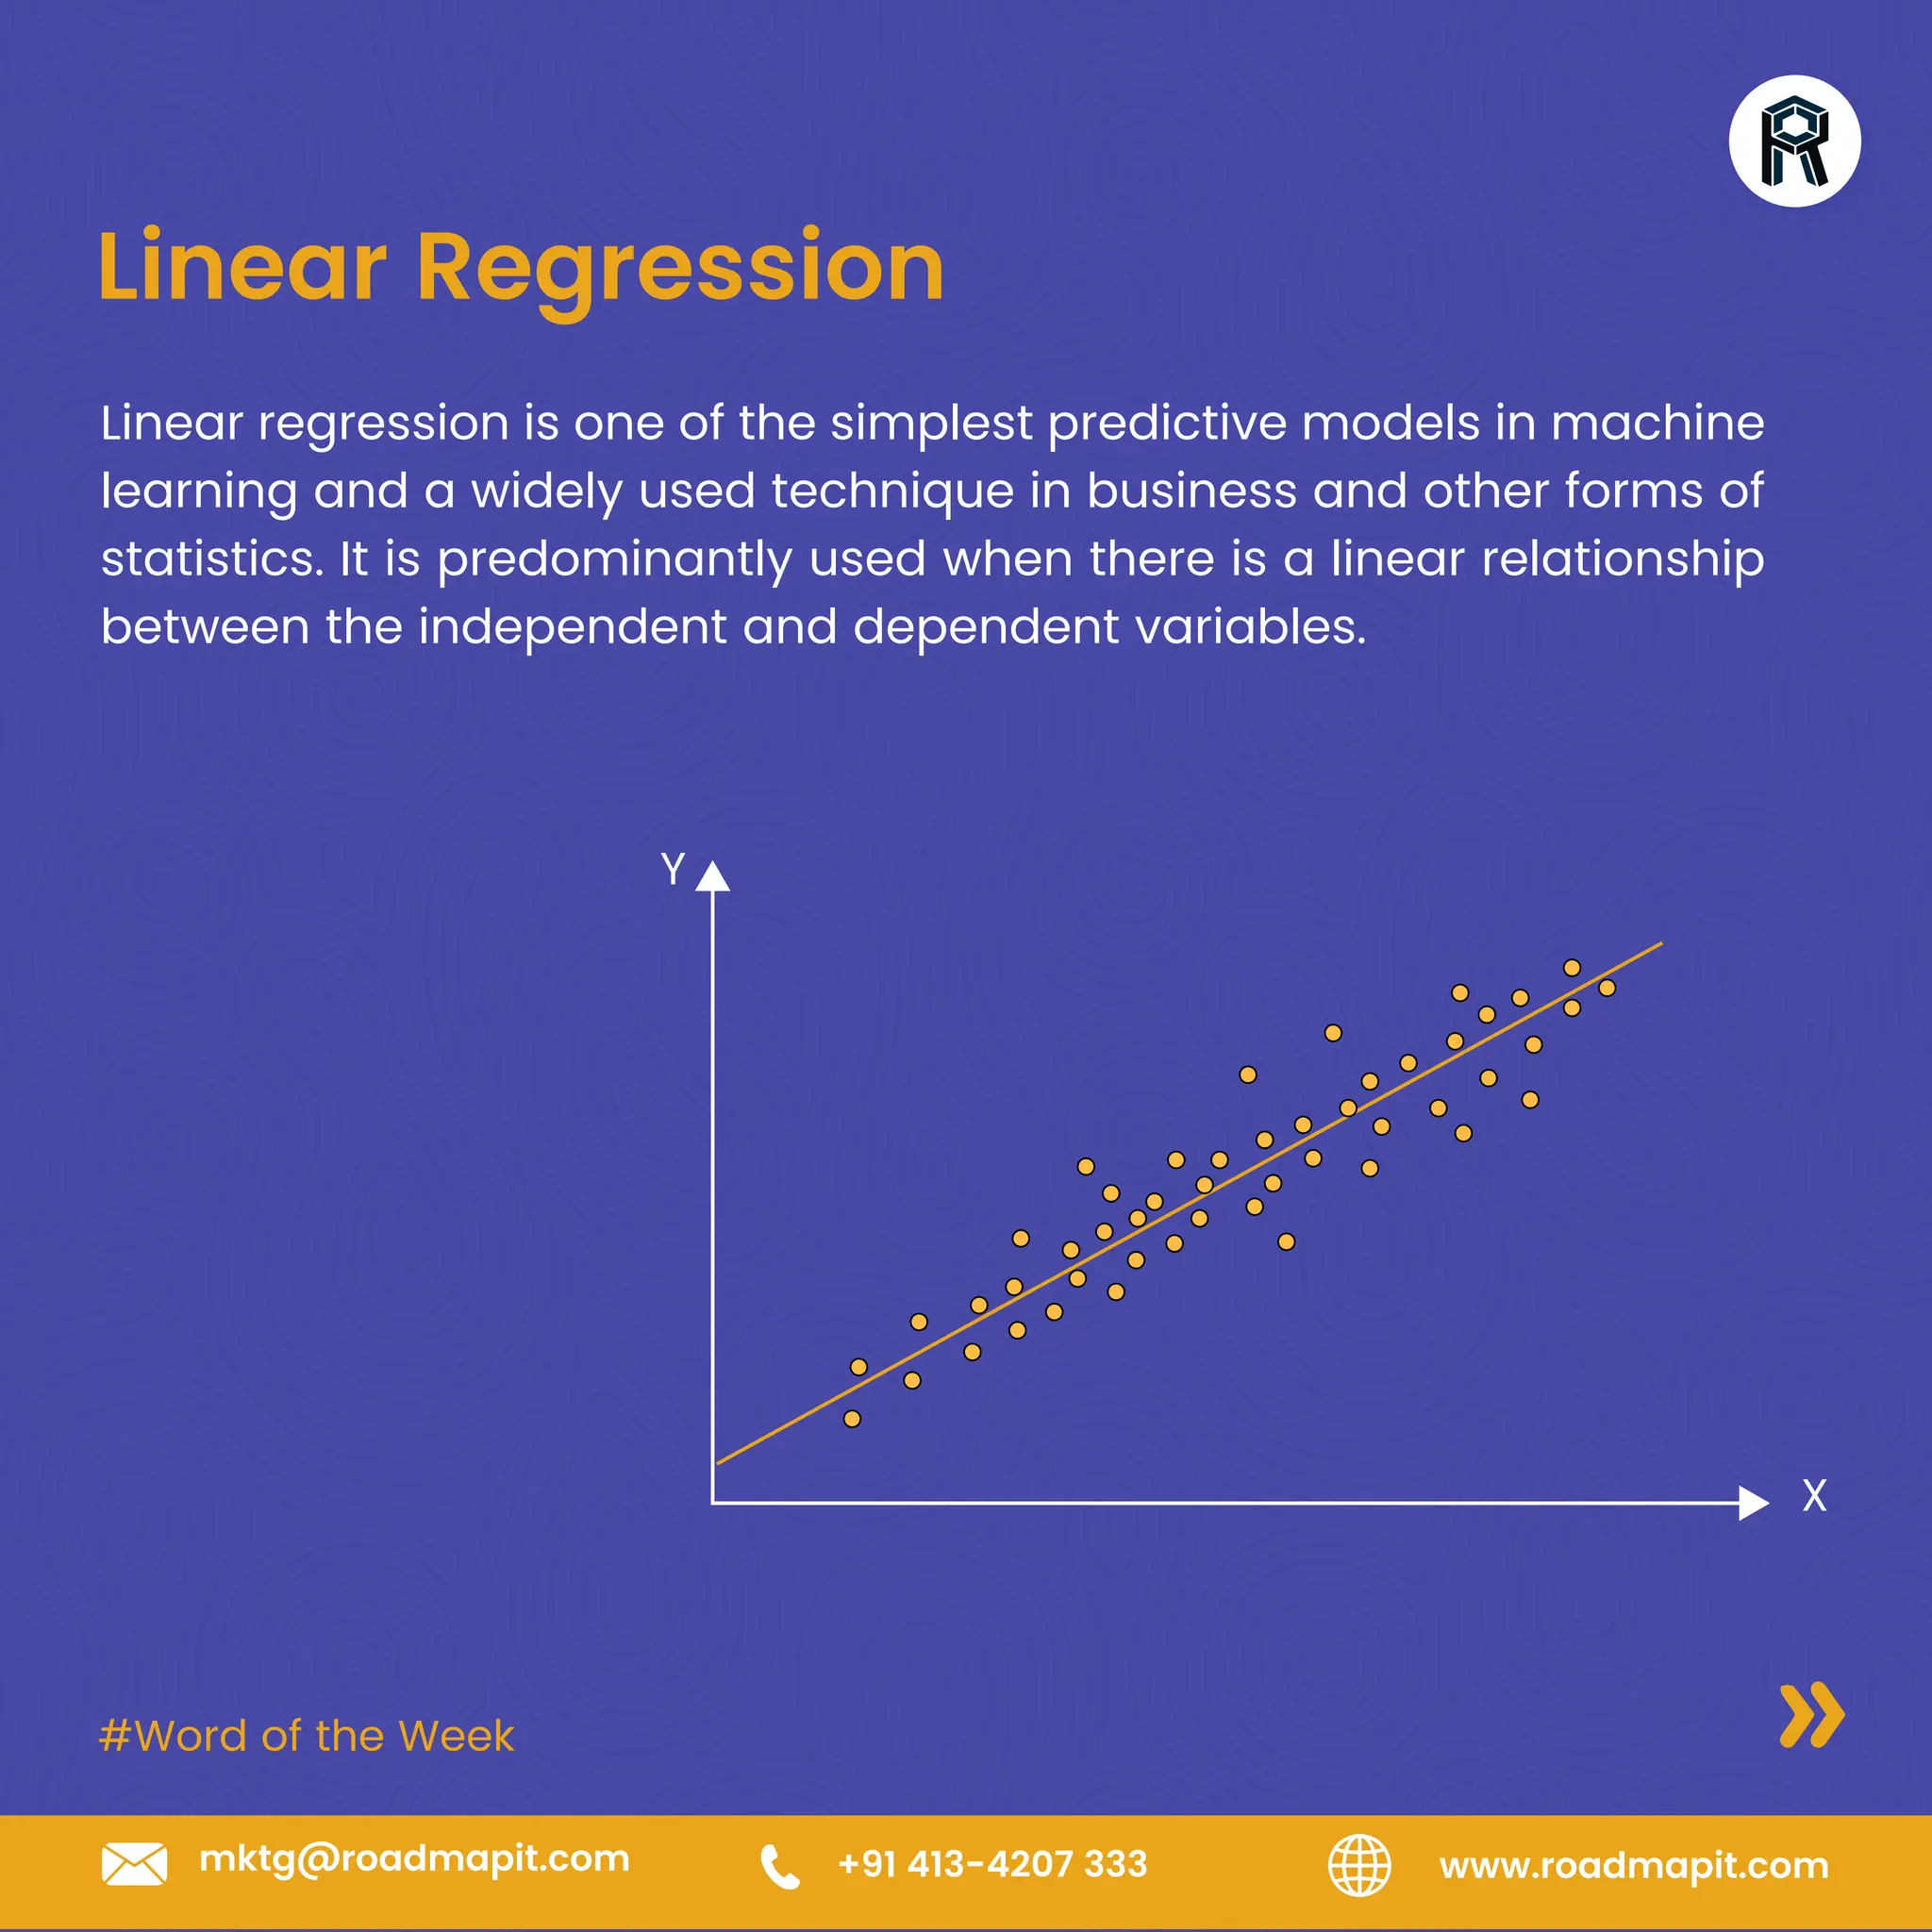
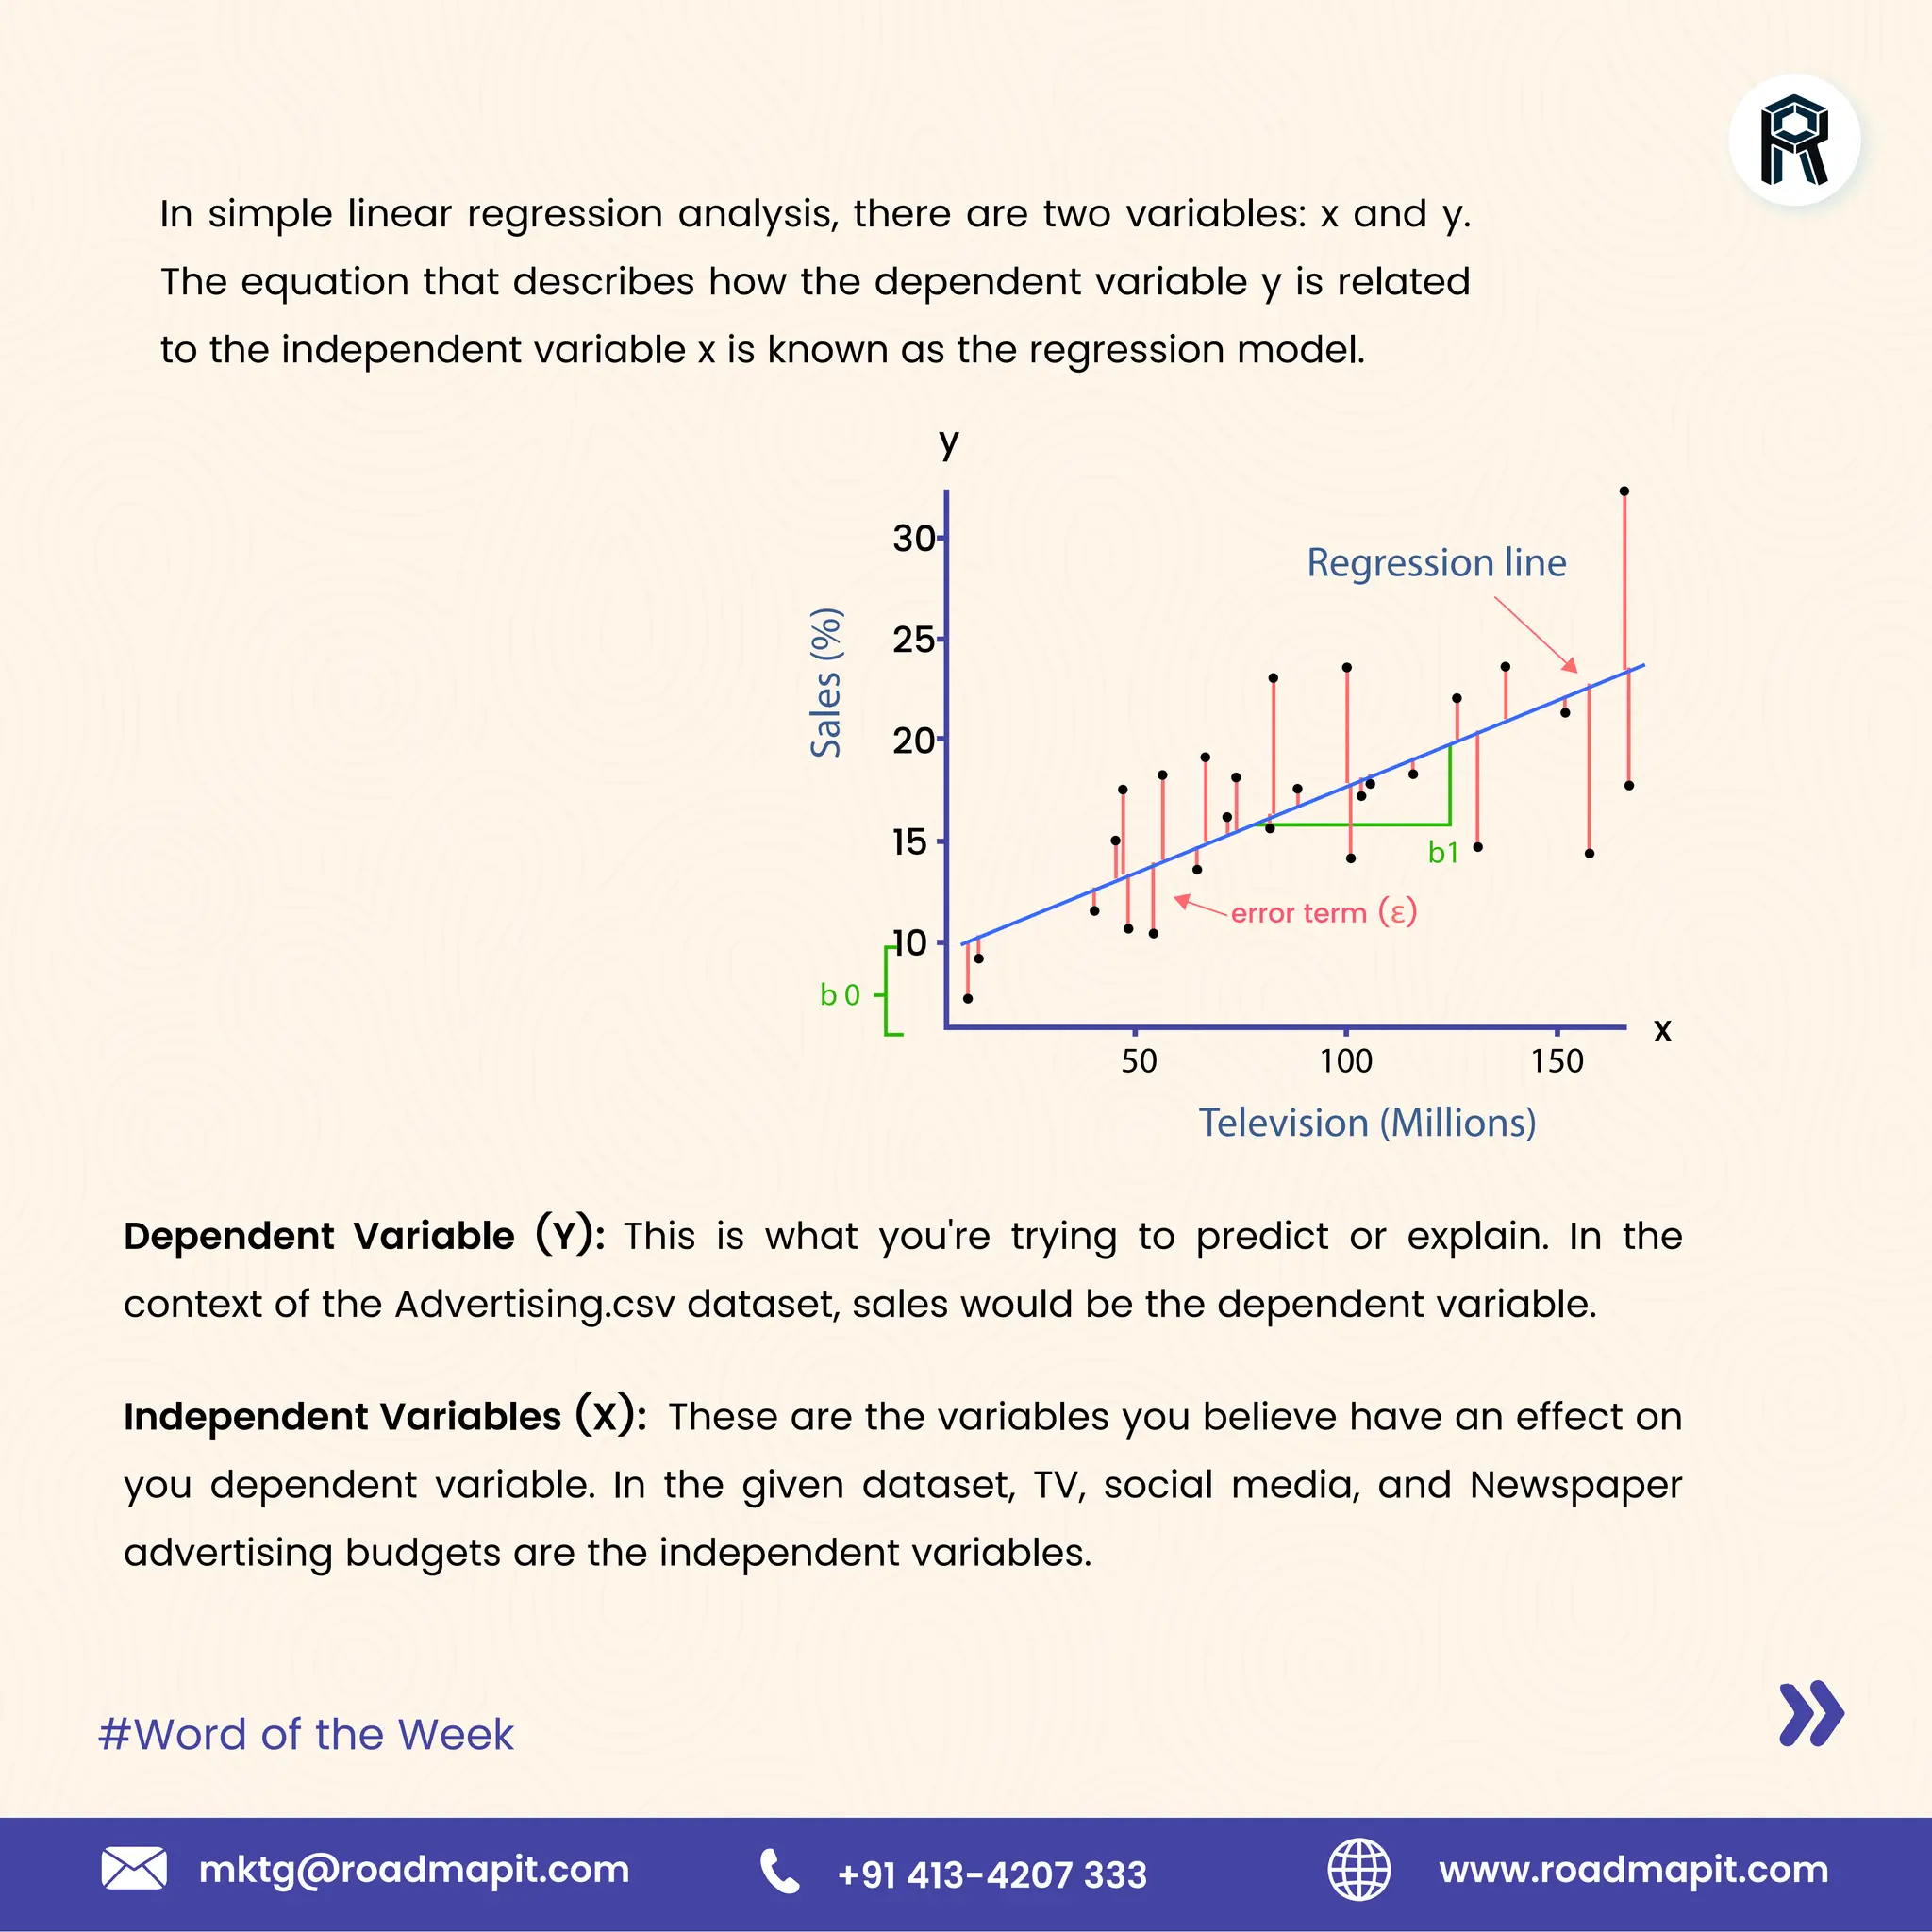
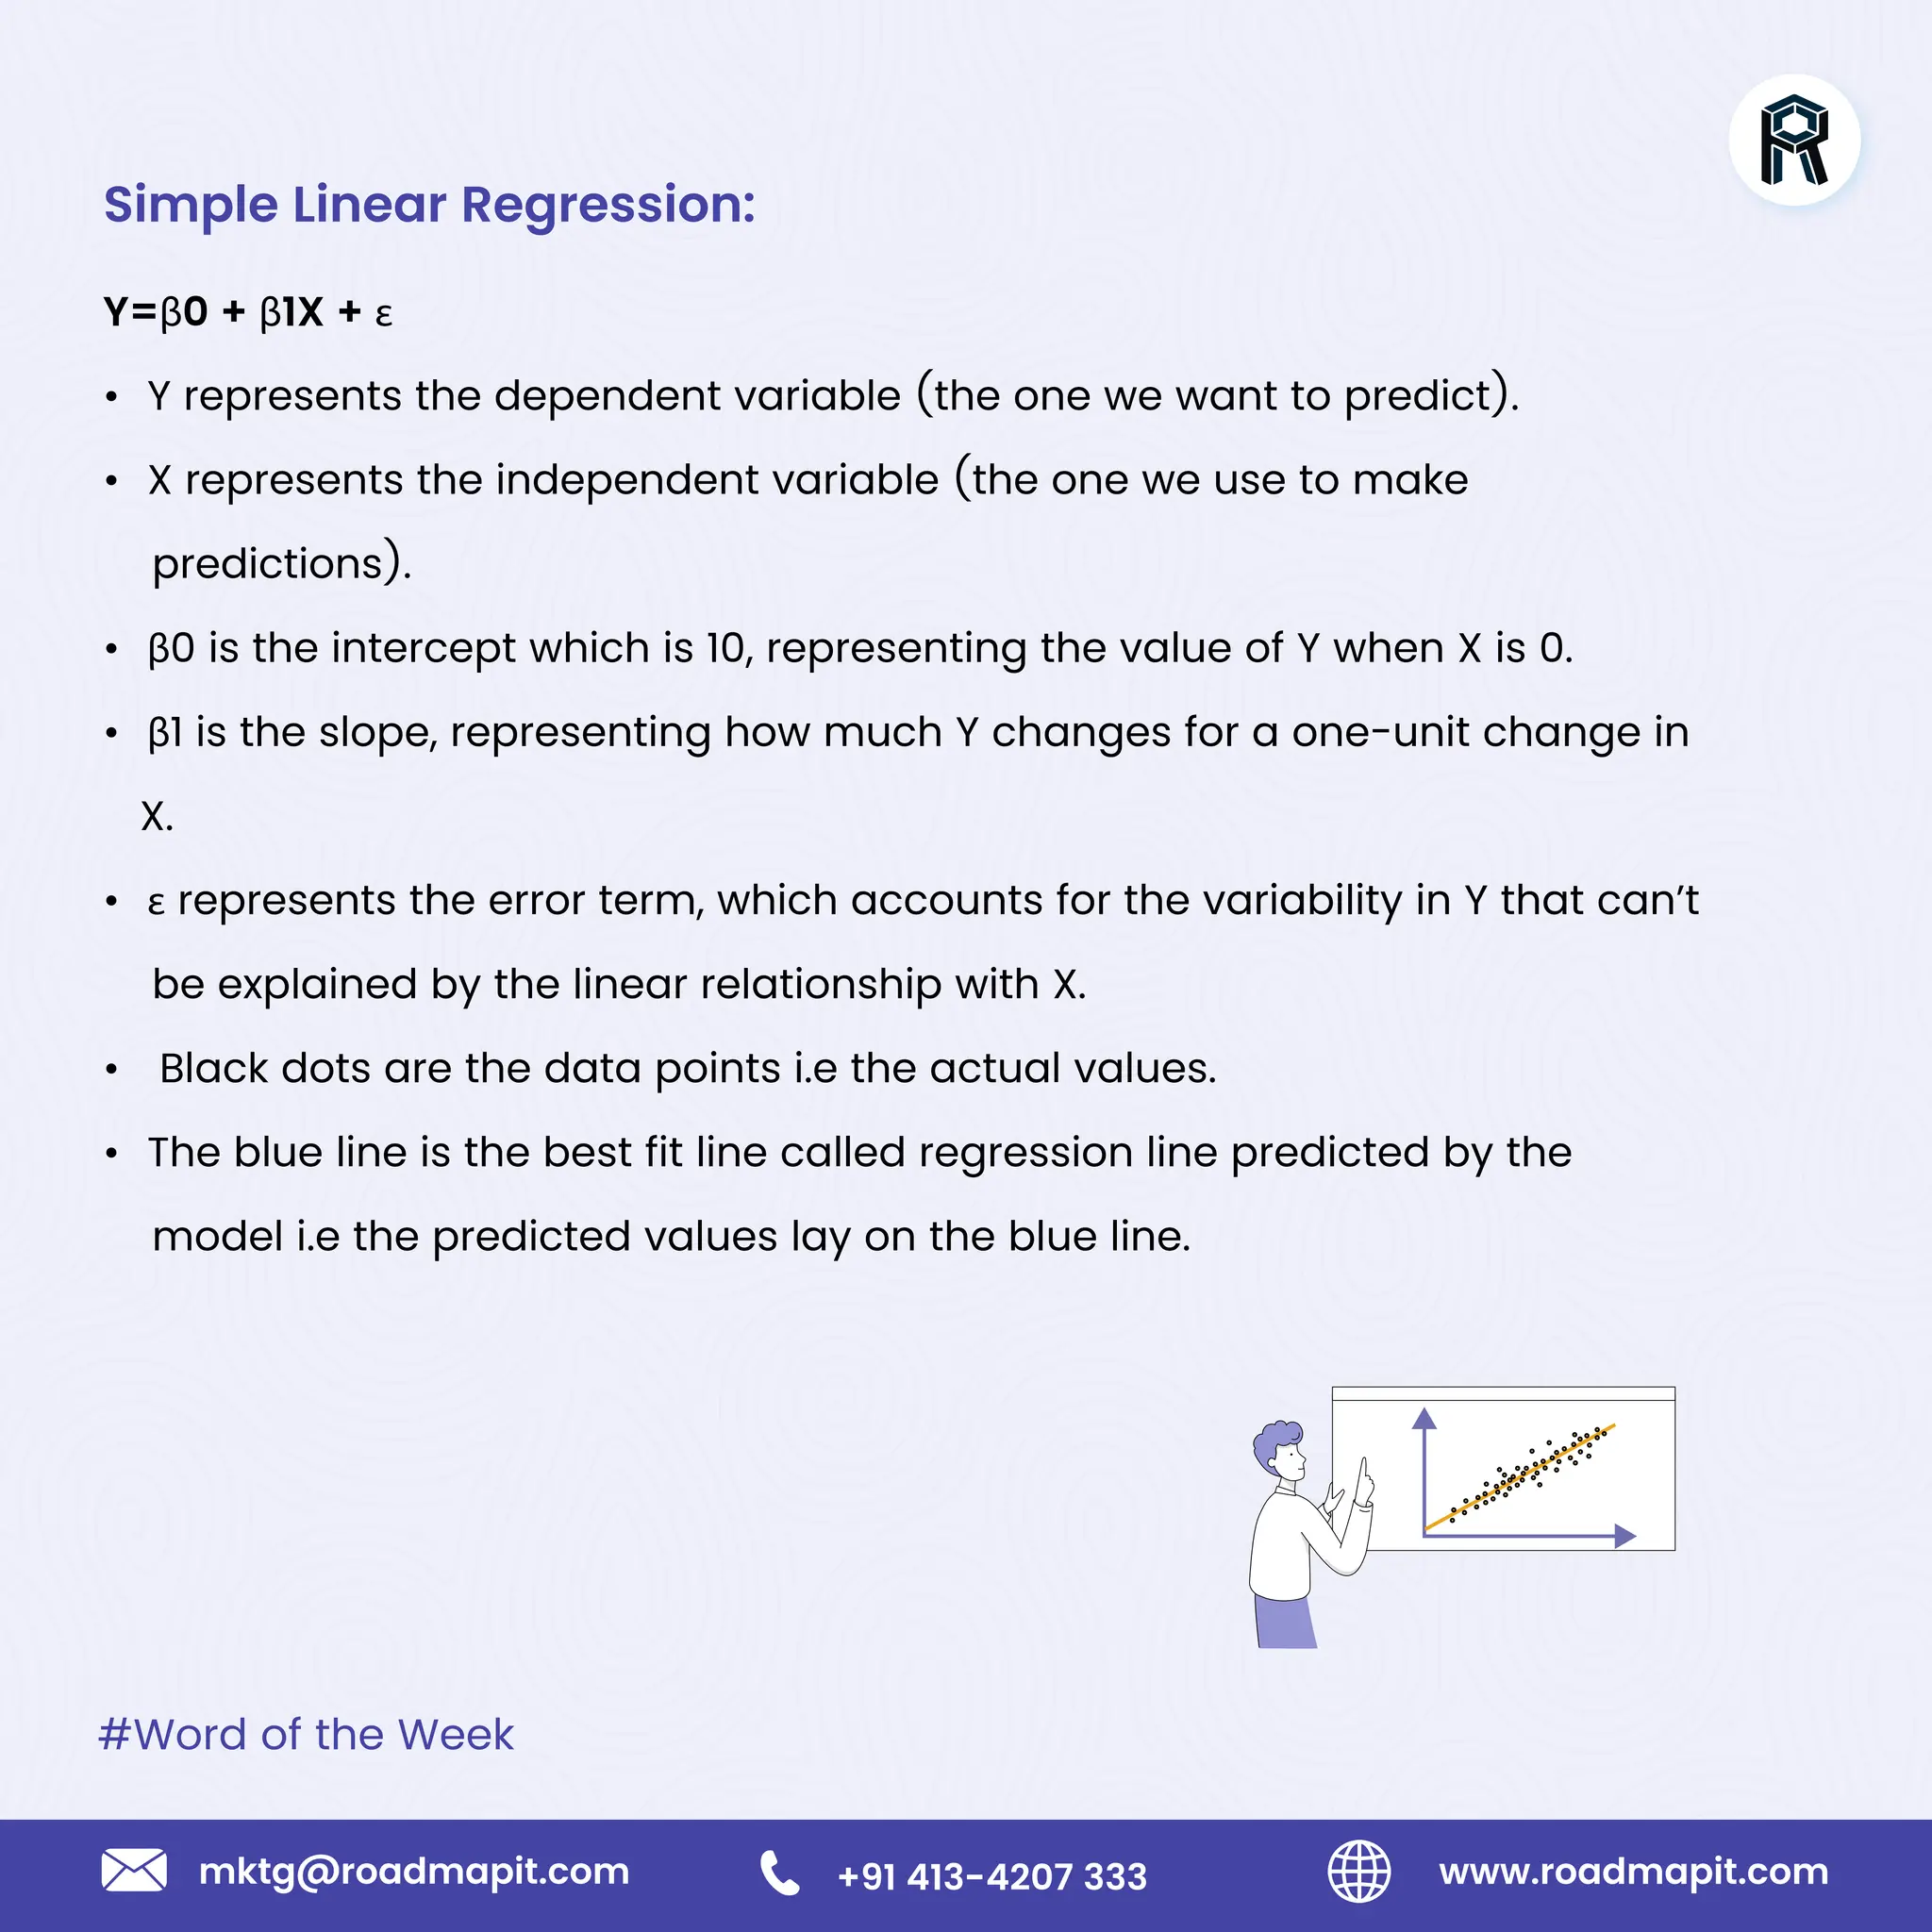
#Word of the Week
www.roadmapit.com
mktg@roadmapit.com +91 413-4207 333
Linear Regression
Linear regression is one of the simplest predictive models in machine
learning and a widely used technique in business and other forms of
statistics. It is predominantly used when there is a linear relationship
between the independent and dependent variables.
Y
X
#Word of the Week
www.roadmapit.com
mktg@roadmapit.com +91 413-4207 333
b1
b 0
error term (ε)
Regression line
Sales
(%)
30
25
20
15
y
x
10
Television (Millions)
50 100 150
In simple linear regression analysis, there are two variables: x and y.
The equation that describes how the dependent variable y is related
to the independent variable x is known as the regression model.
Dependent Variable (Y): This is what you're trying to predict or explain. In the
context of the Advertising.csv dataset, sales would be the dependent variable.
Independent Variables (X): These are the variables you believe have an effect on
you dependent variable. In the given dataset, TV, social media, and Newspaper
advertising budgets are the independent variables.
#Word of the Week
www.roadmapit.com
mktg@roadmapit.com +91 413-4207 333
Simple Linear Regression:
Y=β0 + β1X + ε
• Y represents the dependent variable (the one we want to predict).
• X represents the independent variable (the one we use to make
predictions).
• β0 is the intercept which is 10, representing the value of Y when X is 0.
• β1 is the slope, representing how much Y changes for a one-unit change in
X.
• ε represents the error term, which accounts for the variability in Y that can’t
be explained by the linear relationship with X.
• Black dots are the data points i.e the actual values.
• The blue line is the best fit line called regression line predicted by the
model i.e the predicted values lay on the blue line.

Linear regression Word of the Week

  • 1.
    #Word of theWeek www.roadmapit.com mktg@roadmapit.com +91 413-4207 333 Linear Regression Linear regression is one of the simplest predictive models in machine learning and a widely used technique in business and other forms of statistics. It is predominantly used when there is a linear relationship between the independent and dependent variables. Y X
  • 2.
    #Word of theWeek www.roadmapit.com mktg@roadmapit.com +91 413-4207 333 b1 b 0 error term (ε) Regression line Sales (%) 30 25 20 15 y x 10 Television (Millions) 50 100 150 In simple linear regression analysis, there are two variables: x and y. The equation that describes how the dependent variable y is related to the independent variable x is known as the regression model. Dependent Variable (Y): This is what you're trying to predict or explain. In the context of the Advertising.csv dataset, sales would be the dependent variable. Independent Variables (X): These are the variables you believe have an effect on you dependent variable. In the given dataset, TV, social media, and Newspaper advertising budgets are the independent variables.
  • 3.
    #Word of theWeek www.roadmapit.com mktg@roadmapit.com +91 413-4207 333 Simple Linear Regression: Y=β0 + β1X + ε • Y represents the dependent variable (the one we want to predict). • X represents the independent variable (the one we use to make predictions). • β0 is the intercept which is 10, representing the value of Y when X is 0. • β1 is the slope, representing how much Y changes for a one-unit change in X. • ε represents the error term, which accounts for the variability in Y that can’t be explained by the linear relationship with X. • Black dots are the data points i.e the actual values. • The blue line is the best fit line called regression line predicted by the model i.e the predicted values lay on the blue line.