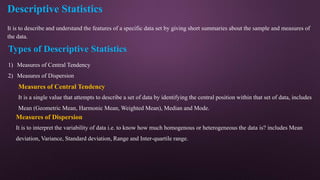
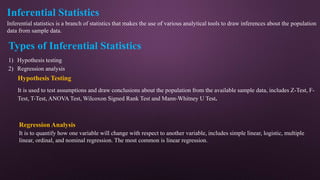
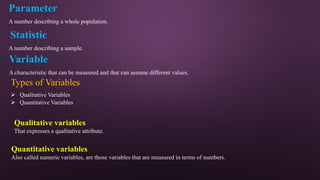
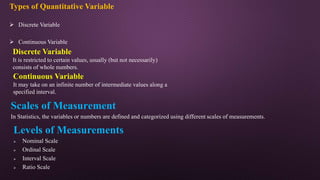
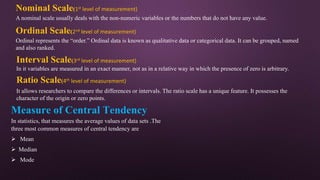
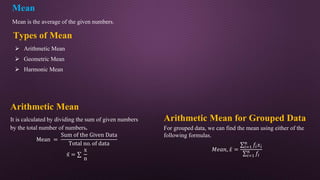
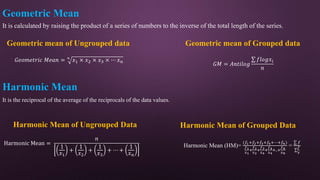
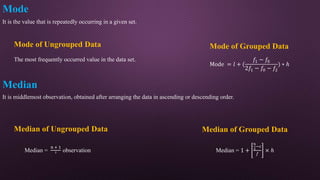
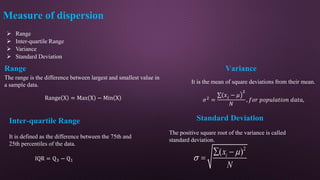
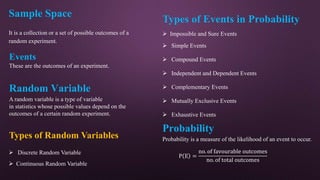
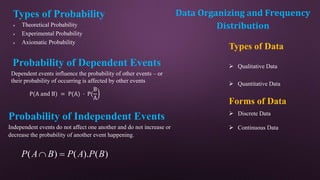
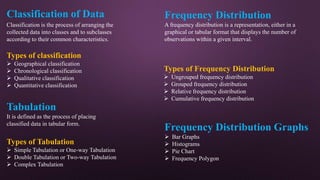
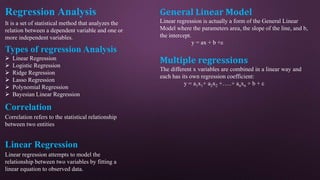
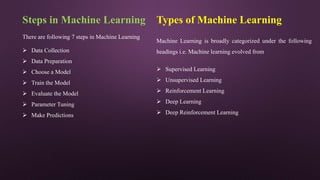
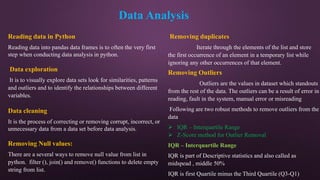
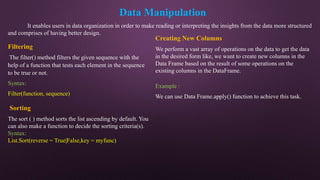
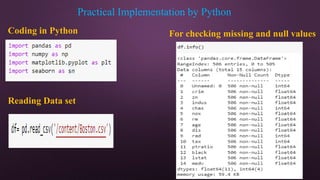
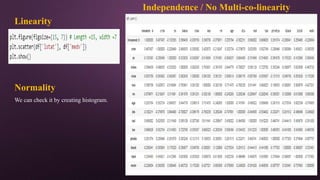
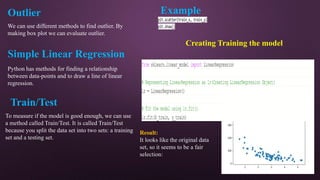
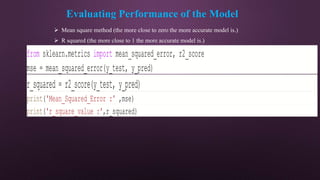
The Linear Regression Applications to Machine Learning with
Practical Implementation
F22071ED87
BC190201392 BC180407936 BC190404854,
BC190205385 BC190405179 BC190410680
Supervisor
Irfan Ullah
Project Title
Program
BS(Mathematics)
Group Members
Group ID
‫الرحیم‬ ‫الرحمن‬ ‫ہللا‬ ‫بسم‬
Table of Contents
01 Statistics
02 Types of statistics
03 Descriptive statistics and types
04 Inferential statistics and types
05 Parameters and statists
06 Variable and types
07 Scales of measurement
08 Measure of central tendency
09 Measure of dispersion
10 Sample Space and Event
11 Random Variable and Types
12 Probability and types
13 Probability of dependent and
independent
14 Data Organizing and Frequency
Distribution
15 Regression analysis and types
16 Linear regression and Multiple regression
17 What is python
18 Python uses and Data types
19 Python operation and libraries
20 Machine Learning
21 Terminologies of ML
22 Steps and Types of ML
23 Data Analysis
24 Data Manipulation
25 Assumption of linear Regression
26 Practical implementation of python
27 Linearity and normality
28 outliers
29 Simple Linear regression
30 Train test
31 Finding Slope as Coefficient and y
Intercept as Intercept
Statistics
The science of collecting, analyzing, presenting, and interpreting data.
Types of Statistics
 Descriptive Statistics
 Inferential Statistics
Population
Simply a population includes all the
elements or items that are under
consideration in a statistical study.
Sample
It is defined as the subset or a small
part of all the possible data values
that are part of the specified field of
study.
Sampling
Sampling is the process of selecting the
sample from the population.
Types of sampling
 Probability Sampling
 Non-Probability Sampling
Probability Sampling
Take sample that cannot be
selected at the discretion of the
researcher.
Non-Probability Sampling
Take sample that can be selected
at the discretion of the
researcher.
Descriptive Statistics
It is to describe and understand the features of a specific data set by giving short summaries about the sample and measures of
the data.
Types of Descriptive Statistics
1) Measures of Central Tendency
2) Measures of Dispersion
Measures of Central Tendency
It is a single value that attempts to describe a set of data by identifying the central position within that set of data, includes
Mean (Geometric Mean, Harmonic Mean, Weighted Mean), Median and Mode.
Measures of Dispersion
It is to interpret the variability of data i.e. to know how much homogenous or heterogeneous the data is? includes Mean
deviation, Variance, Standard deviation, Range and Inter-quartile range.
Inferential Statistics
Inferential statistics is a branch of statistics that makes the use of various analytical tools to draw inferences about the population
data from sample data.
Types of Inferential Statistics
1) Hypothesis testing
2) Regression analysis
Hypothesis Testing
It is used to test assumptions and draw conclusions about the population from the available sample data, includes Z-Test, F-
Test, T-Test, ANOVA Test, Wilcoxon Signed Rank Test and Mann-Whitney U Test.
Regression Analysis
It is to quantify how one variable will change with respect to another variable, includes simple linear, logistic, multiple
linear, ordinal, and nominal regression. The most common is linear regression.
Parameter
A number describing a whole population.
Statistic
A number describing a sample.
Variable
A characteristic that can be measured and that can assume different values.
Types of Variables
 Qualitative Variables
 Quantitative Variables
Qualitative variables
That expresses a qualitative attribute.
Quantitative variables
Also called numeric variables, are those variables that are measured in terms of numbers.
Types of Quantitative Variable
 Discrete Variable
 Continuous Variable
Discrete Variable
It is restricted to certain values, usually (but not necessarily)
consists of whole numbers.
Continuous Variable
It may take on an infinite number of intermediate values along a
specified interval.
Scales of Measurement
In Statistics, the variables or numbers are defined and categorized using different scales of measurements.
Levels of Measurements
 Nominal Scale
 Ordinal Scale
 Interval Scale
 Ratio Scale
Nominal Scale(1st level of measurement)
A nominal scale usually deals with the non-numeric variables or the numbers that do not have any value.
Ordinal Scale(2nd level of measurement)
Ordinal represents the “order.” Ordinal data is known as qualitative data or categorical data. It can be grouped, named
and also ranked.
Interval Scale(3rd level of measurement)
In it variables are measured in an exact manner, not as in a relative way in which the presence of zero is arbitrary.
Ratio Scale(4th level of measurement)
It allows researchers to compare the differences or intervals. The ratio scale has a unique feature. It possesses the
character of the origin or zero points.
Measure of Central Tendency
In statistics, that measures the average values of data sets .The
three most common measures of central tendency are
 Mean
 Median
 Mode
Mean
Mean is the average of the given numbers.
Arithmetic Mean for Grouped Data
For grouped data, we can find the mean using either of the
following formulas.
𝑀𝑒𝑎𝑛, 𝑥 =
𝑖=1
𝑛
𝑓𝑖𝑥𝑖
𝑖=1
𝑛
𝑓𝑖
Types of Mean
Arithmetic Mean
It is calculated by dividing the sum of given numbers
by the total number of numbers.
Mean =
Sum of the Given Data
Total no. of data
x̄ =
x
n
 Arithmetic Mean
 Geometric Mean
 Harmonic Mean
Geometric Mean
It is calculated by raising the product of a series of numbers to the inverse of the total length of the series.
Geometric mean of Ungrouped data
𝐺𝑒𝑜𝑚𝑒𝑡𝑟𝑖𝑐 𝑀𝑒𝑎𝑛 = 𝑛
𝑥1 × 𝑥2 × 𝑥3 × ⋯ 𝑥𝑛
Geometric mean of Grouped data
𝐺𝑀 = 𝐴𝑛𝑡𝑖𝑙𝑜𝑔
𝑓𝑙𝑜𝑔𝑥𝑖
𝑛
It is the reciprocal of the average of the reciprocals of the data values.
Harmonic Mean
Harmonic Mean of Ungrouped Data
Harmonic Mean =
𝑛
1
𝑥1
+
1
𝑥2
+
1
𝑥3
+ ⋯ +
1
𝑥𝑛
Harmonic Mean of Grouped Data
Harmonic Mean (HM)=
(𝑓1+𝑓2+𝑓3+𝑓4+⋯+𝑓𝑛)
𝑓1
𝑥1
+
𝑓2
𝑥2
+
𝑓3
𝑥4
+
𝑓4
𝑥4
+..+
𝑓𝑛
𝑥𝑛
=
𝑓
𝑓
𝑥
Mode
It is the value that is repeatedly occurring in a given set.
The most frequently occurred value in the data set.
Mode of Ungrouped Data Mode of Grouped Data
Mode = 𝑙 + (
𝑓1 − 𝑓0
2𝑓1 − 𝑓0 − 𝑓2
) ∗ ℎ
Median
It is middlemost observation, obtained after arranging the data in ascending or descending order.
Median of Ungrouped Data
Median =
n + 1
2 observation
Median of Grouped Data
Median = 1 +
𝑛
2
−𝑐
𝑓
× ℎ
 Range
 Inter-quartile Range
 Variance
 Standard Deviation
Range
The range is the difference between largest and smallest value in
a sample data.
Measure of dispersion
Range X = Max X − Min X
Inter-quartile Range
It is defined as the difference between the 75th and
25th percentiles of the data.
IQR = Q3 − Q1
Variance
It is the mean of square deviations from their mean.
𝜎2 =
(𝑥𝑖 − 𝜇
2
𝑁
, 𝑓𝑜𝑟 𝑝𝑜𝑝𝑢𝑙𝑎𝑡𝑖𝑜𝑛 𝑑𝑎𝑡𝑎,
Standard Deviation
The positive square root of the variance is called
standard deviation.
2
( )
i
x
N


 

Sample Space
It is a collection or a set of possible outcomes of a
random experiment.
Events
These are the outcomes of an experiment.
Types of Events in Probability
 Impossible and Sure Events
 Simple Events
 Compound Events
 Independent and Dependent Events
 Complementary Events
 Mutually Exclusive Events
 Exhaustive Events
Random Variable
A random variable is a type of variable
in statistics whose possible values depend on the
outcomes of a certain random experiment.
Types of Random Variables
 Discrete Random Variable
 Continuous Random Variable
Probability
Probability is a measure of the likelihood of an event to occur.
P E =
no. of favourable outcomes
no. of total outcomes
Types of Probability
 Theoretical Probability
 Experimental Probability
 Axiomatic Probability
Probability of Dependent Events
Dependent events influence the probability of other events – or
their probability of occurring is affected by other events
P(A and B) = P(A) · P(
B
A
Probability of Independent Events
Independent events do not affect one another and do not increase or
decrease the probability of another event happening.
( ) ( ). ( )
P A B P A P B
 
Data Organizing and Frequency
Distribution
Types of Data
 Qualitative Data
 Quantitative Data
Forms of Data
 Discrete Data
 Continuous Data
Classification of Data
Classification is the process of arranging the
collected data into classes and to subclasses
according to their common characteristics.
Types of classification
 Geographical classification
 Chronological classification
 Qualitative classification
 Quantitative classification
Tabulation
It is defined as the process of placing
classified data in tabular form.
Types of Tabulation
 Simple Tabulation or One-way Tabulation
 Double Tabulation or Two-way Tabulation
 Complex Tabulation
Frequency Distribution
A frequency distribution is a representation, either in a
graphical or tabular format that displays the number of
observations within a given interval.
Types of Frequency Distribution
 Ungrouped frequency distribution
 Grouped frequency distribution
 Relative frequency distribution
 Cumulative frequency distribution
Frequency Distribution Graphs
 Bar Graphs
 Histograms
 Pie Chart
 Frequency Polygon
Regression Analysis
It is a set of statistical method that analyzes the
relation between a dependent variable and one or
more independent variables.
Types of regression Analysis
 Linear Regression
 Logistic Regression
 Ridge Regression
 Lasso Regression
 Polynomial Regression
 Bayesian Linear Regression
Correlation
Correlation refers to the statistical relationship
between two entities
Linear Regression
Linear regression attempts to model the
relationship between two variables by fitting a
linear equation to observed data.
General Linear Model
Linear regression is actually a form of the General Linear
Model where the parameters area, the slope of the line, and b,
the intercept.
y = ax + b +ε
Multiple regressions
The different x variables are combined in a linear way and
each has its own regression coefficient:
y = a1x1+ a2x2 +…..+ anxn + b + ε
What is Python?
Python is a popular programing language that is object-oriented used for general-purpose programing.
to create web applications, create workflows and handle big data and perform complex mathematics.
Python is used
Python syntax compared to other programing languages
It is for readability, and has some similarities to the English language with influence from
mathematics, as opposed to other programing languages which often use semicolons or parentheses.
Python data types
Numeric data types: int, float, complex, String data types:str, Sequence types: list, tuple, range,
Binary types: bytes, byte array , memory view, Mapping data type: dict., Boolean type: bool.
Operations in Python
There are six operations in python which are Addition, Subtractions, Multiplications, Division, Floor division, Module and Power.
Python Libraries
It is a reuse able chunk of code e.g. Matplotlib, Pandas and Numpy.
List
A dynamically sizes array that gets declared in other languages.
Tuple
Collections of various objects of python departed by commas.
Sets
The sets are an unordered collection of data types.
Python coding
With python compliers we can edit code and see the results in browser.
Learning
It is “to gain knowledge, or understanding of, or skill in, by study, instruction, or experience,” and “modification of a behavioral
tendency by experience.”
Machine learning
It usually refers to the changes in systems that perform tasks associated with artificial intelligence (AI). Such tasks involve
recognition, diagnosis, planning, robot control, prediction, etc.
Terminologies Used in ML
Algorithm
Machine Learning
Machine Learning Model
Black Box Model
Interpretable Machine Learning
Dataset
Instance
Target
Training
Machine Learning Task
Over fitting
Under-fitting
Steps in Machine Learning
There are following 7 steps in Machine Learning
 Data Collection
 Data Preparation
 Choose a Model
 Train the Model
 Evaluate the Model
 Parameter Tuning
 Make Predictions
Types of Machine Learning
Machine Learning is broadly categorized under the following
headings i.e. Machine learning evolved from
 Supervised Learning
 Unsupervised Learning
 Reinforcement Learning
 Deep Learning
 Deep Reinforcement Learning
Data Analysis
Reading data in Python
Reading data into pandas data frames is to often the very first
step when conducting data analysis in python.
Data exploration
It is to visually explore data sets look for similarities, patterns
and outliers and to identify the relationships between different
variables.
Data cleaning
It is the process of correcting or removing corrupt, incorrect, or
unnecessary data from a data set before data analysis.
Removing Null values:
There are a several ways to remove null value from list in
python. filter (), join() and remove() functions to delete empty
string from list.
Removing duplicates
Iterate through the elements of the list and store
the first occurrence of an element in a temporary list while
ignoring any other occurrences of that element.
Removing Outliers
Outliers are the values in dataset which standouts
from the rest of the data. The outliers can be a result of error in
reading, fault in the system, manual error or misreading
Following are two robust methods to remove outliers from the
data
 IQR – Interquartile Range
 Z-Score method for Outlier Removal
IQR – Interquartile Range
IQR is part of Descriptive statistics and also called as
midspead , middle 50%
IQR is first Quartile minus the Third Quartile (Q3-Q1)
Data Manipulation
It enables users in data organization in order to make reading or interpreting the insights from the data more structured
and comprises of having better design.
Filtering
The filter() method filters the given sequence with the
help of a function that tests each element in the sequence
to be true or not.
Syntax:
Filter(function, sequence)
Sorting
The sort ( ) method sorts the list ascending by default. You
can also make a function to decide the sorting criteria(s).
Syntax:
List.Sort(reverse = True|False,key = myfunc)
Creating New Columns
We perform a vast array of operations on the data to get the data
in the desired form like, we want to create new columns in the
Data Frame based on the result of some operations on the
existing columns in the DataFrame.
Example :
We can use Data Frame.apply() function to achieve this task.
Assumptions of Linear Regression
Linear Relationship
It can be done by making a scatter plot for each independent
variable with the dependent variable.
Normality
The X and Y variables should be normally distributed.
Histograms, KDE plots, Q-Q plots can be used to check the
normality assumptions.
Independence / No Multi-co-linearity
If the VIF score is greater than 5 then the variables are highly
correlated. In short, observations are independent of each other.
Consequences of the violation of any of the Assumptions
The violation of the assumptions leads to a decrease in accuracy of the model therefore the predictions are not accurate and
error is also high.
Practical Implementation by Python
Coding in Python
Reading Data set
For checking missing and null values
Linearity
Normality
We can check it by creating histogram.
Independence / No Multi-co-linearity
Outlier
We can use different methods to find outlier. By
making box plot we can evaluate outlier.
Simple Linear Regression
Python has methods for finding a relationship
between data-points and to draw a line of linear
regression.
Train/Test
To measure if the model is good enough, we can use
a method called Train/Test. It is called Train/Test
because you split the data set into two sets: a training
set and a testing set.
Example
plt.scatter(train_x, train_y)
plt.show()
from sklearn.linear_model import LinearRegression
# Representing LinearRegression as lr(Creating LinearRegression Object)
lr = LinearRegression()
# Fit the model using lr.fit()
lr.fit(X_train, y_train)
Result:
It looks like the original data
set, so it seems to be a fair
selection:
Creating Training the model
Finding Slope as Coefficient and y Intercept as Intercept
print(lr.intercept_)
print(lr.coef_)
[30.99841982]
[[-0.73242792]]
Output
y_pred= lr.predict(X_test)
y_pred= pd.DataFrame(y_pred)
y_pred.head()
Predicting Values
Evaluating Performance of the Model
 Mean square method (the more close to zero the more accurate model is.)
 R squared (the more close to 1 the more accurate model is.)
from sklearn.metrics import mean_squared_error, r2_score
mse = mean_squared_error(y_test, y_pred)
r_squared = r2_score(y_test, y_pred)
print('Mean_Squared_Error :' ,mse)
print('r_square_value :',r_squared)
Plotting the predicted and actual y values
The more the graph is tend to look like a straight line the more it is accurate.
import matplotlib.pyplot as plt
plt.scatter(y_test,y_pred,c='r')
plt.xlabel('Y Test')
plt.ylabel('Predicted Y')
plt.grid()
Multiple Regression Analysis
Since the model is not that accurate that' s we should try multiple regression analysis
X=df1[['lstat','rm', 'ptratio' ]] # Independent varaibles is named as X
y=df1[['medv']] # Dependent varaible is named as y.
from sklearn.model_selection import train_test_split # Importing necessary libraries.
X_train, X_test, y_train, y_test = train_test_split(X, y, test_size = 0.5 , random_state=10
)
from sklearn.linear_model import LinearRegression
# Representing LinearRegression as lr(Creating LinearRegression Object)
Mr = LinearRegression()
# Fit the model using lr.fit()
Mr.fit(X_train, y_train) print(Mr.intercept_)
print(Mr.coef_)
Linear Regression()
Special Thanks
To
Sir Irfan Ullah Marwat

linear regression application of machine learning.pptx

  • 1.
    The Linear RegressionApplications to Machine Learning with Practical Implementation F22071ED87 BC190201392 BC180407936 BC190404854, BC190205385 BC190405179 BC190410680 Supervisor Irfan Ullah Project Title Program BS(Mathematics) Group Members Group ID ‫الرحیم‬ ‫الرحمن‬ ‫ہللا‬ ‫بسم‬
  • 2.
    Table of Contents 01Statistics 02 Types of statistics 03 Descriptive statistics and types 04 Inferential statistics and types 05 Parameters and statists 06 Variable and types 07 Scales of measurement 08 Measure of central tendency 09 Measure of dispersion 10 Sample Space and Event 11 Random Variable and Types 12 Probability and types 13 Probability of dependent and independent 14 Data Organizing and Frequency Distribution 15 Regression analysis and types 16 Linear regression and Multiple regression 17 What is python 18 Python uses and Data types 19 Python operation and libraries 20 Machine Learning 21 Terminologies of ML 22 Steps and Types of ML 23 Data Analysis 24 Data Manipulation 25 Assumption of linear Regression 26 Practical implementation of python 27 Linearity and normality 28 outliers 29 Simple Linear regression 30 Train test 31 Finding Slope as Coefficient and y Intercept as Intercept
  • 3.
    Statistics The science ofcollecting, analyzing, presenting, and interpreting data. Types of Statistics  Descriptive Statistics  Inferential Statistics Population Simply a population includes all the elements or items that are under consideration in a statistical study. Sample It is defined as the subset or a small part of all the possible data values that are part of the specified field of study. Sampling Sampling is the process of selecting the sample from the population. Types of sampling  Probability Sampling  Non-Probability Sampling Probability Sampling Take sample that cannot be selected at the discretion of the researcher. Non-Probability Sampling Take sample that can be selected at the discretion of the researcher.
  • 4.
    Descriptive Statistics It isto describe and understand the features of a specific data set by giving short summaries about the sample and measures of the data. Types of Descriptive Statistics 1) Measures of Central Tendency 2) Measures of Dispersion Measures of Central Tendency It is a single value that attempts to describe a set of data by identifying the central position within that set of data, includes Mean (Geometric Mean, Harmonic Mean, Weighted Mean), Median and Mode. Measures of Dispersion It is to interpret the variability of data i.e. to know how much homogenous or heterogeneous the data is? includes Mean deviation, Variance, Standard deviation, Range and Inter-quartile range.
  • 5.
    Inferential Statistics Inferential statisticsis a branch of statistics that makes the use of various analytical tools to draw inferences about the population data from sample data. Types of Inferential Statistics 1) Hypothesis testing 2) Regression analysis Hypothesis Testing It is used to test assumptions and draw conclusions about the population from the available sample data, includes Z-Test, F- Test, T-Test, ANOVA Test, Wilcoxon Signed Rank Test and Mann-Whitney U Test. Regression Analysis It is to quantify how one variable will change with respect to another variable, includes simple linear, logistic, multiple linear, ordinal, and nominal regression. The most common is linear regression.
  • 6.
    Parameter A number describinga whole population. Statistic A number describing a sample. Variable A characteristic that can be measured and that can assume different values. Types of Variables  Qualitative Variables  Quantitative Variables Qualitative variables That expresses a qualitative attribute. Quantitative variables Also called numeric variables, are those variables that are measured in terms of numbers.
  • 7.
    Types of QuantitativeVariable  Discrete Variable  Continuous Variable Discrete Variable It is restricted to certain values, usually (but not necessarily) consists of whole numbers. Continuous Variable It may take on an infinite number of intermediate values along a specified interval. Scales of Measurement In Statistics, the variables or numbers are defined and categorized using different scales of measurements. Levels of Measurements  Nominal Scale  Ordinal Scale  Interval Scale  Ratio Scale
  • 8.
    Nominal Scale(1st levelof measurement) A nominal scale usually deals with the non-numeric variables or the numbers that do not have any value. Ordinal Scale(2nd level of measurement) Ordinal represents the “order.” Ordinal data is known as qualitative data or categorical data. It can be grouped, named and also ranked. Interval Scale(3rd level of measurement) In it variables are measured in an exact manner, not as in a relative way in which the presence of zero is arbitrary. Ratio Scale(4th level of measurement) It allows researchers to compare the differences or intervals. The ratio scale has a unique feature. It possesses the character of the origin or zero points. Measure of Central Tendency In statistics, that measures the average values of data sets .The three most common measures of central tendency are  Mean  Median  Mode
  • 9.
    Mean Mean is theaverage of the given numbers. Arithmetic Mean for Grouped Data For grouped data, we can find the mean using either of the following formulas. 𝑀𝑒𝑎𝑛, 𝑥 = 𝑖=1 𝑛 𝑓𝑖𝑥𝑖 𝑖=1 𝑛 𝑓𝑖 Types of Mean Arithmetic Mean It is calculated by dividing the sum of given numbers by the total number of numbers. Mean = Sum of the Given Data Total no. of data x̄ = x n  Arithmetic Mean  Geometric Mean  Harmonic Mean
  • 10.
    Geometric Mean It iscalculated by raising the product of a series of numbers to the inverse of the total length of the series. Geometric mean of Ungrouped data 𝐺𝑒𝑜𝑚𝑒𝑡𝑟𝑖𝑐 𝑀𝑒𝑎𝑛 = 𝑛 𝑥1 × 𝑥2 × 𝑥3 × ⋯ 𝑥𝑛 Geometric mean of Grouped data 𝐺𝑀 = 𝐴𝑛𝑡𝑖𝑙𝑜𝑔 𝑓𝑙𝑜𝑔𝑥𝑖 𝑛 It is the reciprocal of the average of the reciprocals of the data values. Harmonic Mean Harmonic Mean of Ungrouped Data Harmonic Mean = 𝑛 1 𝑥1 + 1 𝑥2 + 1 𝑥3 + ⋯ + 1 𝑥𝑛 Harmonic Mean of Grouped Data Harmonic Mean (HM)= (𝑓1+𝑓2+𝑓3+𝑓4+⋯+𝑓𝑛) 𝑓1 𝑥1 + 𝑓2 𝑥2 + 𝑓3 𝑥4 + 𝑓4 𝑥4 +..+ 𝑓𝑛 𝑥𝑛 = 𝑓 𝑓 𝑥
  • 11.
    Mode It is thevalue that is repeatedly occurring in a given set. The most frequently occurred value in the data set. Mode of Ungrouped Data Mode of Grouped Data Mode = 𝑙 + ( 𝑓1 − 𝑓0 2𝑓1 − 𝑓0 − 𝑓2 ) ∗ ℎ Median It is middlemost observation, obtained after arranging the data in ascending or descending order. Median of Ungrouped Data Median = n + 1 2 observation Median of Grouped Data Median = 1 + 𝑛 2 −𝑐 𝑓 × ℎ
  • 12.
     Range  Inter-quartileRange  Variance  Standard Deviation Range The range is the difference between largest and smallest value in a sample data. Measure of dispersion Range X = Max X − Min X Inter-quartile Range It is defined as the difference between the 75th and 25th percentiles of the data. IQR = Q3 − Q1 Variance It is the mean of square deviations from their mean. 𝜎2 = (𝑥𝑖 − 𝜇 2 𝑁 , 𝑓𝑜𝑟 𝑝𝑜𝑝𝑢𝑙𝑎𝑡𝑖𝑜𝑛 𝑑𝑎𝑡𝑎, Standard Deviation The positive square root of the variance is called standard deviation. 2 ( ) i x N     
  • 13.
    Sample Space It isa collection or a set of possible outcomes of a random experiment. Events These are the outcomes of an experiment. Types of Events in Probability  Impossible and Sure Events  Simple Events  Compound Events  Independent and Dependent Events  Complementary Events  Mutually Exclusive Events  Exhaustive Events Random Variable A random variable is a type of variable in statistics whose possible values depend on the outcomes of a certain random experiment. Types of Random Variables  Discrete Random Variable  Continuous Random Variable Probability Probability is a measure of the likelihood of an event to occur. P E = no. of favourable outcomes no. of total outcomes
  • 14.
    Types of Probability Theoretical Probability  Experimental Probability  Axiomatic Probability Probability of Dependent Events Dependent events influence the probability of other events – or their probability of occurring is affected by other events P(A and B) = P(A) · P( B A Probability of Independent Events Independent events do not affect one another and do not increase or decrease the probability of another event happening. ( ) ( ). ( ) P A B P A P B   Data Organizing and Frequency Distribution Types of Data  Qualitative Data  Quantitative Data Forms of Data  Discrete Data  Continuous Data
  • 15.
    Classification of Data Classificationis the process of arranging the collected data into classes and to subclasses according to their common characteristics. Types of classification  Geographical classification  Chronological classification  Qualitative classification  Quantitative classification Tabulation It is defined as the process of placing classified data in tabular form. Types of Tabulation  Simple Tabulation or One-way Tabulation  Double Tabulation or Two-way Tabulation  Complex Tabulation Frequency Distribution A frequency distribution is a representation, either in a graphical or tabular format that displays the number of observations within a given interval. Types of Frequency Distribution  Ungrouped frequency distribution  Grouped frequency distribution  Relative frequency distribution  Cumulative frequency distribution Frequency Distribution Graphs  Bar Graphs  Histograms  Pie Chart  Frequency Polygon
  • 16.
    Regression Analysis It isa set of statistical method that analyzes the relation between a dependent variable and one or more independent variables. Types of regression Analysis  Linear Regression  Logistic Regression  Ridge Regression  Lasso Regression  Polynomial Regression  Bayesian Linear Regression Correlation Correlation refers to the statistical relationship between two entities Linear Regression Linear regression attempts to model the relationship between two variables by fitting a linear equation to observed data. General Linear Model Linear regression is actually a form of the General Linear Model where the parameters area, the slope of the line, and b, the intercept. y = ax + b +ε Multiple regressions The different x variables are combined in a linear way and each has its own regression coefficient: y = a1x1+ a2x2 +…..+ anxn + b + ε
  • 17.
    What is Python? Pythonis a popular programing language that is object-oriented used for general-purpose programing. to create web applications, create workflows and handle big data and perform complex mathematics. Python is used Python syntax compared to other programing languages It is for readability, and has some similarities to the English language with influence from mathematics, as opposed to other programing languages which often use semicolons or parentheses. Python data types Numeric data types: int, float, complex, String data types:str, Sequence types: list, tuple, range, Binary types: bytes, byte array , memory view, Mapping data type: dict., Boolean type: bool.
  • 18.
    Operations in Python Thereare six operations in python which are Addition, Subtractions, Multiplications, Division, Floor division, Module and Power. Python Libraries It is a reuse able chunk of code e.g. Matplotlib, Pandas and Numpy. List A dynamically sizes array that gets declared in other languages. Tuple Collections of various objects of python departed by commas. Sets The sets are an unordered collection of data types. Python coding With python compliers we can edit code and see the results in browser.
  • 19.
    Learning It is “togain knowledge, or understanding of, or skill in, by study, instruction, or experience,” and “modification of a behavioral tendency by experience.” Machine learning It usually refers to the changes in systems that perform tasks associated with artificial intelligence (AI). Such tasks involve recognition, diagnosis, planning, robot control, prediction, etc. Terminologies Used in ML Algorithm Machine Learning Machine Learning Model Black Box Model Interpretable Machine Learning Dataset Instance Target Training Machine Learning Task Over fitting Under-fitting
  • 20.
    Steps in MachineLearning There are following 7 steps in Machine Learning  Data Collection  Data Preparation  Choose a Model  Train the Model  Evaluate the Model  Parameter Tuning  Make Predictions Types of Machine Learning Machine Learning is broadly categorized under the following headings i.e. Machine learning evolved from  Supervised Learning  Unsupervised Learning  Reinforcement Learning  Deep Learning  Deep Reinforcement Learning
  • 21.
    Data Analysis Reading datain Python Reading data into pandas data frames is to often the very first step when conducting data analysis in python. Data exploration It is to visually explore data sets look for similarities, patterns and outliers and to identify the relationships between different variables. Data cleaning It is the process of correcting or removing corrupt, incorrect, or unnecessary data from a data set before data analysis. Removing Null values: There are a several ways to remove null value from list in python. filter (), join() and remove() functions to delete empty string from list. Removing duplicates Iterate through the elements of the list and store the first occurrence of an element in a temporary list while ignoring any other occurrences of that element. Removing Outliers Outliers are the values in dataset which standouts from the rest of the data. The outliers can be a result of error in reading, fault in the system, manual error or misreading Following are two robust methods to remove outliers from the data  IQR – Interquartile Range  Z-Score method for Outlier Removal IQR – Interquartile Range IQR is part of Descriptive statistics and also called as midspead , middle 50% IQR is first Quartile minus the Third Quartile (Q3-Q1)
  • 22.
    Data Manipulation It enablesusers in data organization in order to make reading or interpreting the insights from the data more structured and comprises of having better design. Filtering The filter() method filters the given sequence with the help of a function that tests each element in the sequence to be true or not. Syntax: Filter(function, sequence) Sorting The sort ( ) method sorts the list ascending by default. You can also make a function to decide the sorting criteria(s). Syntax: List.Sort(reverse = True|False,key = myfunc) Creating New Columns We perform a vast array of operations on the data to get the data in the desired form like, we want to create new columns in the Data Frame based on the result of some operations on the existing columns in the DataFrame. Example : We can use Data Frame.apply() function to achieve this task.
  • 23.
    Assumptions of LinearRegression Linear Relationship It can be done by making a scatter plot for each independent variable with the dependent variable. Normality The X and Y variables should be normally distributed. Histograms, KDE plots, Q-Q plots can be used to check the normality assumptions. Independence / No Multi-co-linearity If the VIF score is greater than 5 then the variables are highly correlated. In short, observations are independent of each other. Consequences of the violation of any of the Assumptions The violation of the assumptions leads to a decrease in accuracy of the model therefore the predictions are not accurate and error is also high.
  • 24.
    Practical Implementation byPython Coding in Python Reading Data set For checking missing and null values
  • 25.
    Linearity Normality We can checkit by creating histogram. Independence / No Multi-co-linearity
  • 26.
    Outlier We can usedifferent methods to find outlier. By making box plot we can evaluate outlier. Simple Linear Regression Python has methods for finding a relationship between data-points and to draw a line of linear regression. Train/Test To measure if the model is good enough, we can use a method called Train/Test. It is called Train/Test because you split the data set into two sets: a training set and a testing set. Example plt.scatter(train_x, train_y) plt.show() from sklearn.linear_model import LinearRegression # Representing LinearRegression as lr(Creating LinearRegression Object) lr = LinearRegression() # Fit the model using lr.fit() lr.fit(X_train, y_train) Result: It looks like the original data set, so it seems to be a fair selection: Creating Training the model
  • 27.
    Finding Slope asCoefficient and y Intercept as Intercept print(lr.intercept_) print(lr.coef_) [30.99841982] [[-0.73242792]] Output y_pred= lr.predict(X_test) y_pred= pd.DataFrame(y_pred) y_pred.head() Predicting Values
  • 28.
    Evaluating Performance ofthe Model  Mean square method (the more close to zero the more accurate model is.)  R squared (the more close to 1 the more accurate model is.) from sklearn.metrics import mean_squared_error, r2_score mse = mean_squared_error(y_test, y_pred) r_squared = r2_score(y_test, y_pred) print('Mean_Squared_Error :' ,mse) print('r_square_value :',r_squared)
  • 29.
    Plotting the predictedand actual y values The more the graph is tend to look like a straight line the more it is accurate. import matplotlib.pyplot as plt plt.scatter(y_test,y_pred,c='r') plt.xlabel('Y Test') plt.ylabel('Predicted Y') plt.grid() Multiple Regression Analysis Since the model is not that accurate that' s we should try multiple regression analysis X=df1[['lstat','rm', 'ptratio' ]] # Independent varaibles is named as X y=df1[['medv']] # Dependent varaible is named as y. from sklearn.model_selection import train_test_split # Importing necessary libraries. X_train, X_test, y_train, y_test = train_test_split(X, y, test_size = 0.5 , random_state=10 ) from sklearn.linear_model import LinearRegression # Representing LinearRegression as lr(Creating LinearRegression Object) Mr = LinearRegression() # Fit the model using lr.fit() Mr.fit(X_train, y_train) print(Mr.intercept_) print(Mr.coef_) Linear Regression()
  • 30.