Download to read offline
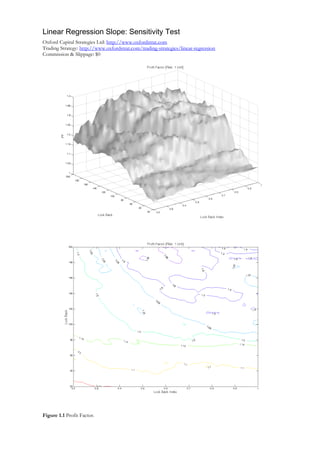
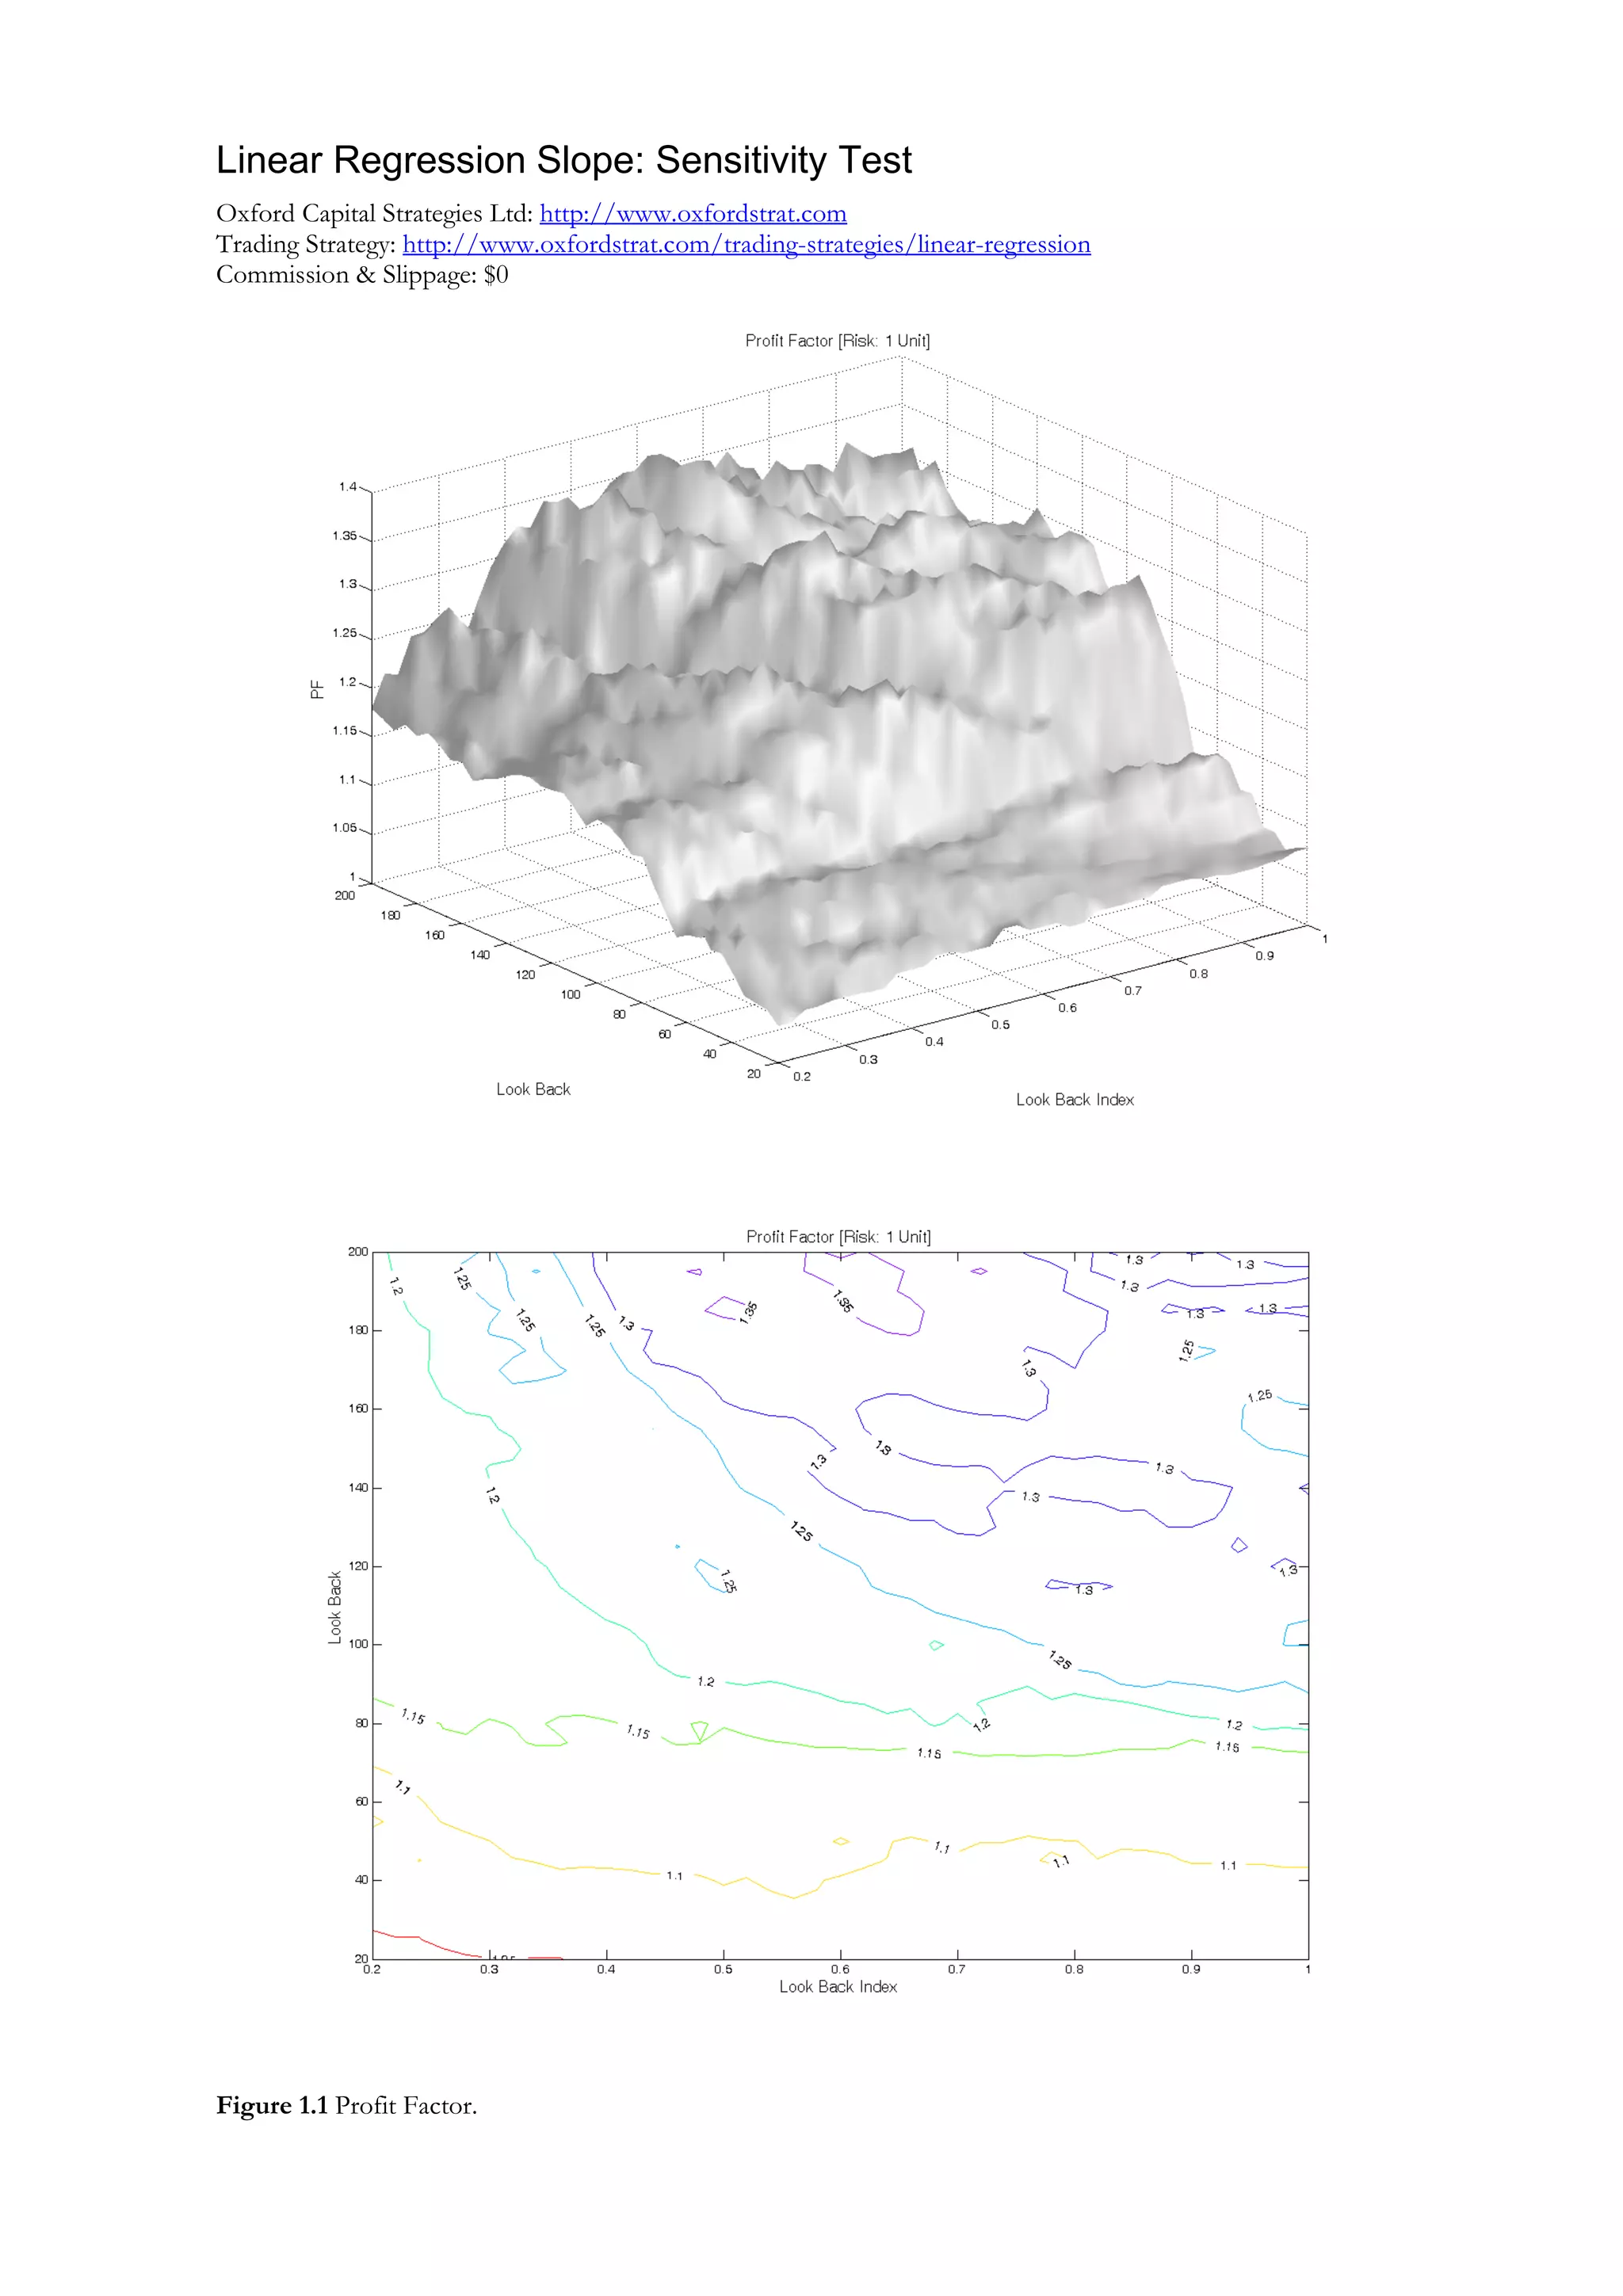
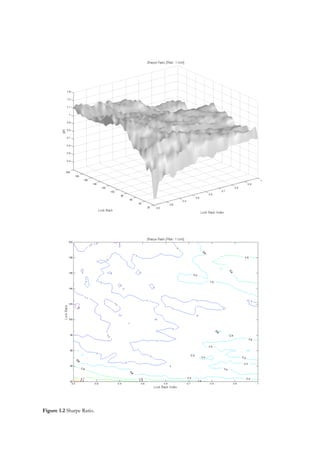
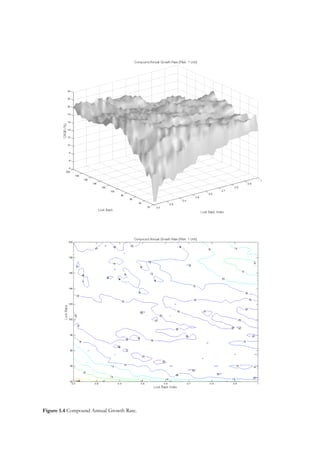
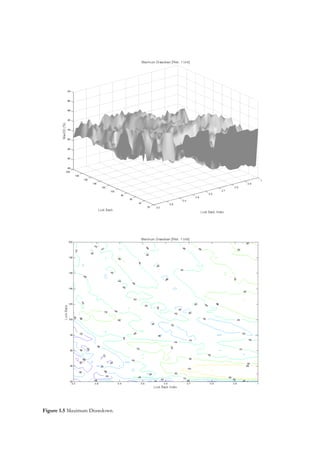
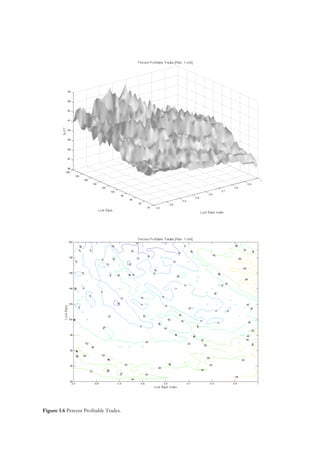

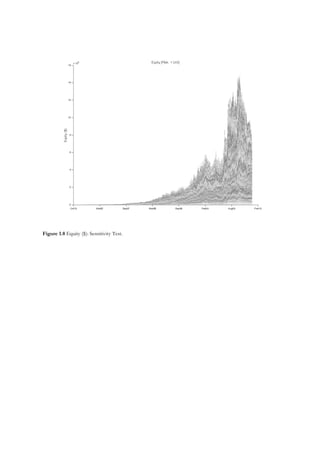

This document presents the results of a sensitivity test on a linear regression trading strategy. It includes figures showing the profit factor, Sharpe ratio, ulcer performance index, compound annual growth rate, maximum drawdown, percentage of profitable trades, and average win/average loss ratio from applying the strategy with $0 commission and slippage. The final figure shows the equity curve from the sensitivity test of the linear regression strategy.


