Download to read offline
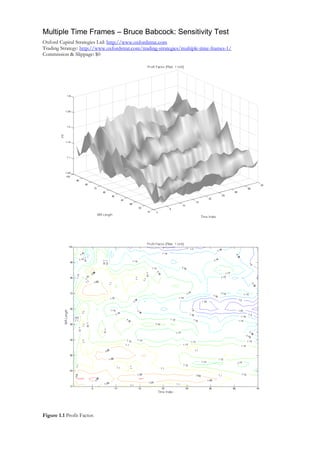

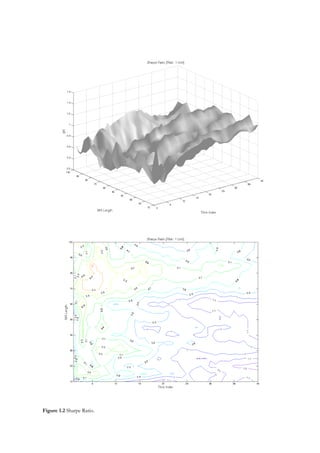
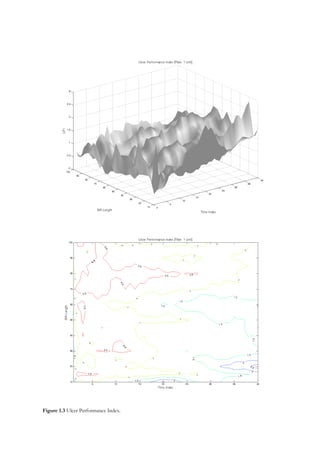
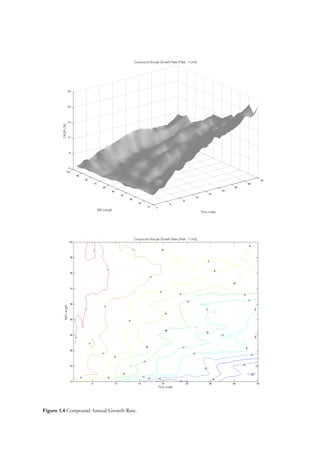
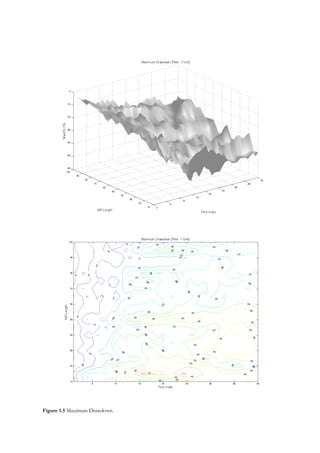
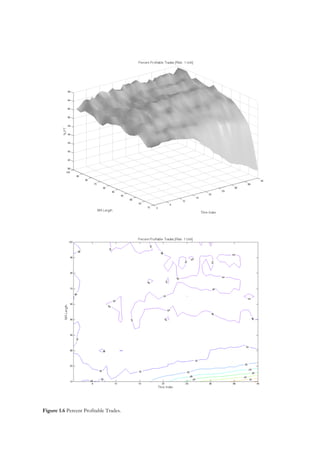
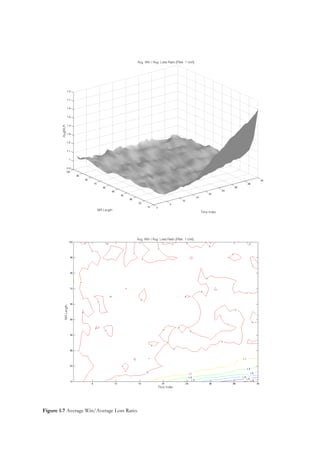
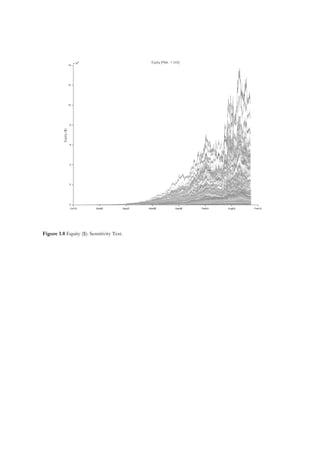

This document discusses the results of a sensitivity test on a trading strategy that uses multiple time frames. It includes figures showing the profit factor, Sharpe ratio, ulcer performance index, compound annual growth rate, maximum drawdown, percentage of profitable trades, and average win/average loss ratio from running the strategy with $0 commission and slippage. An equity curve also shows the strategy's performance over time in the sensitivity test.


