Download to read offline
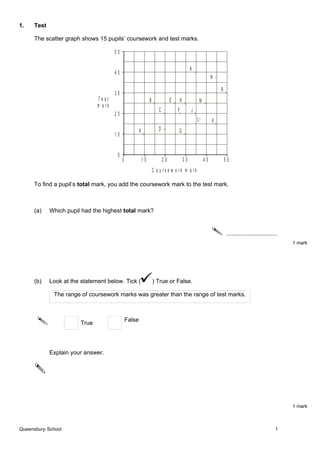


1) The document contains a scatter graph showing 15 pupils' coursework and test marks. 2) To find a pupil's total mark, you add their coursework mark to their test mark. 3) The smallest total mark needed to win a prize is shown in the shaded region of the graph, which indicates a total mark of 65 or more.