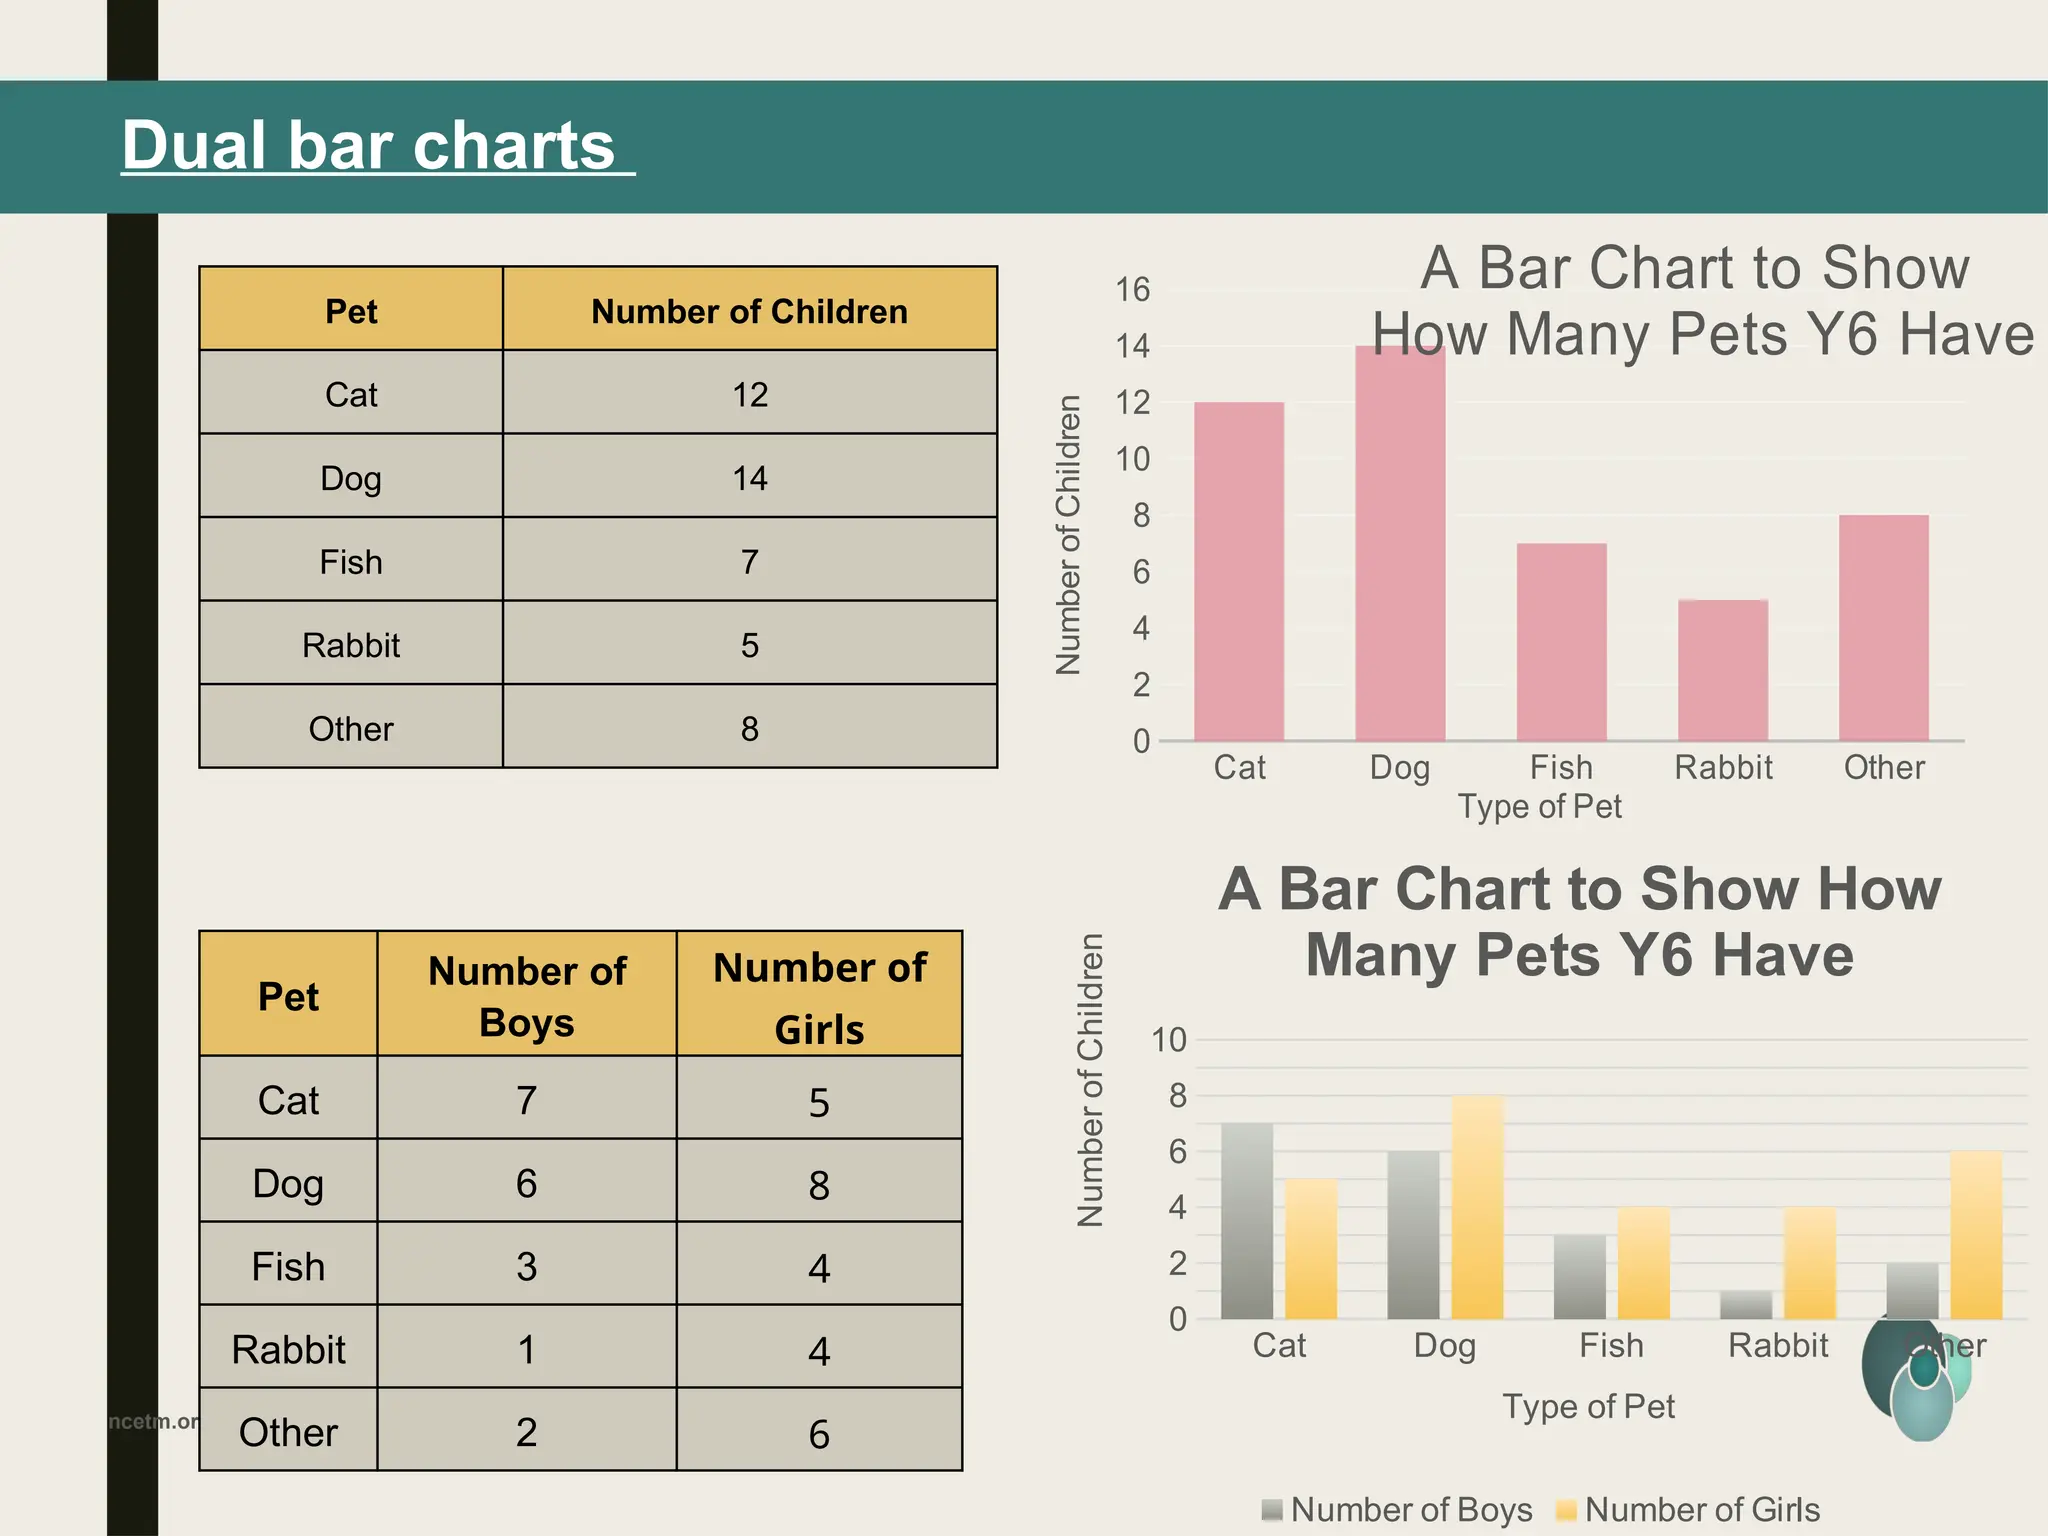
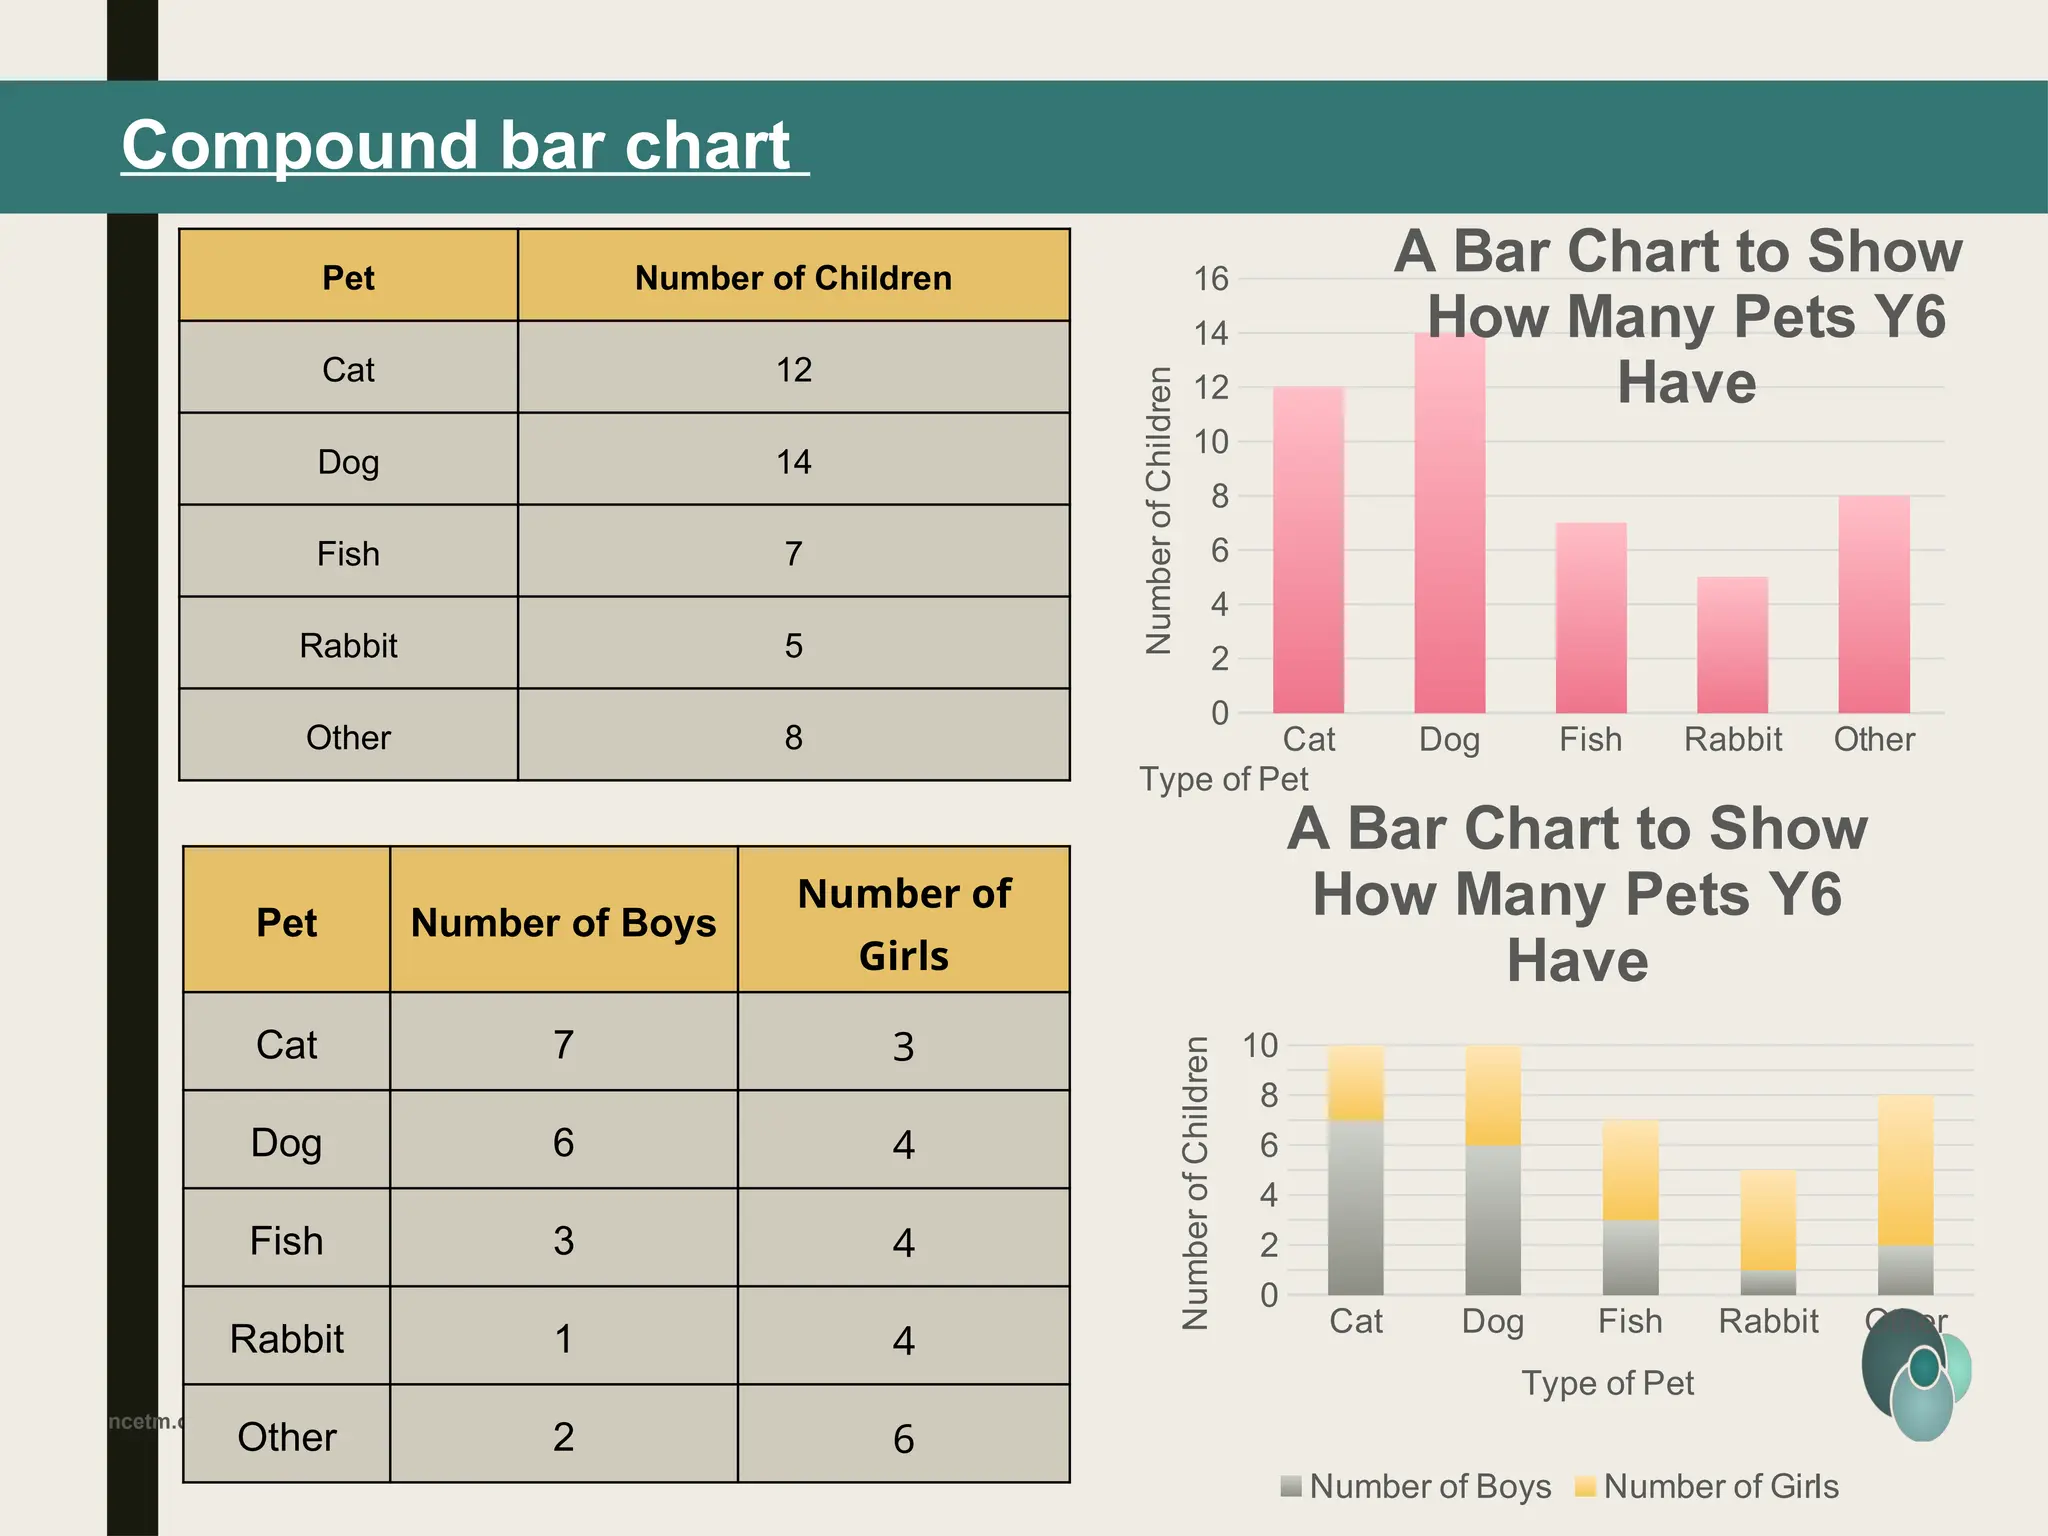
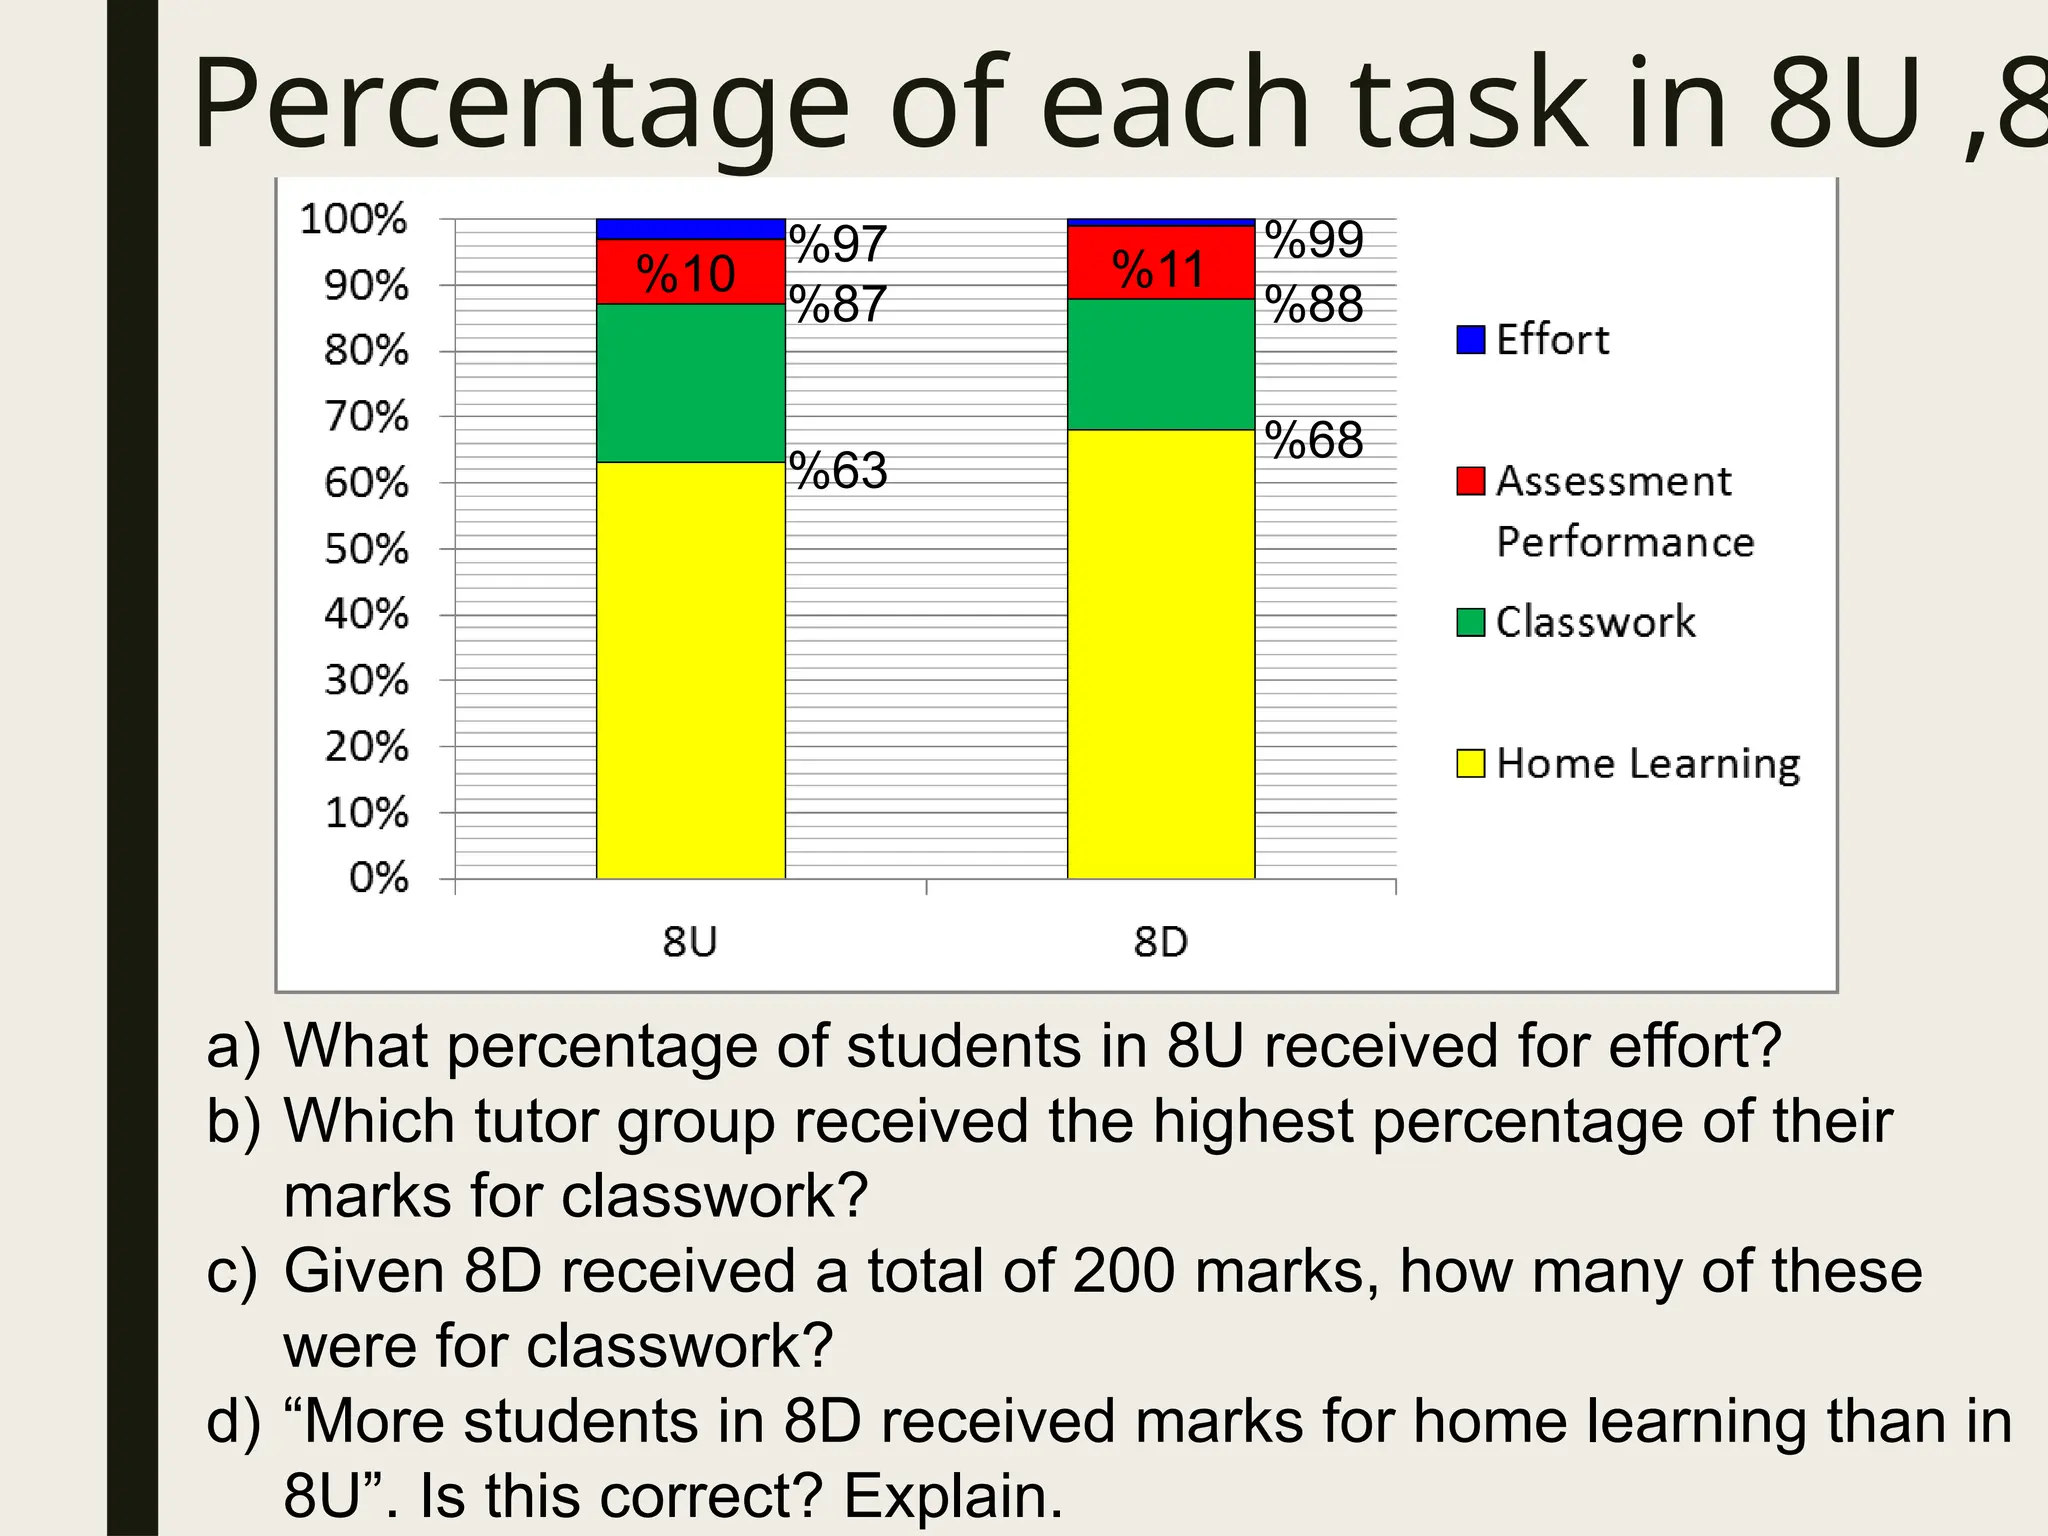
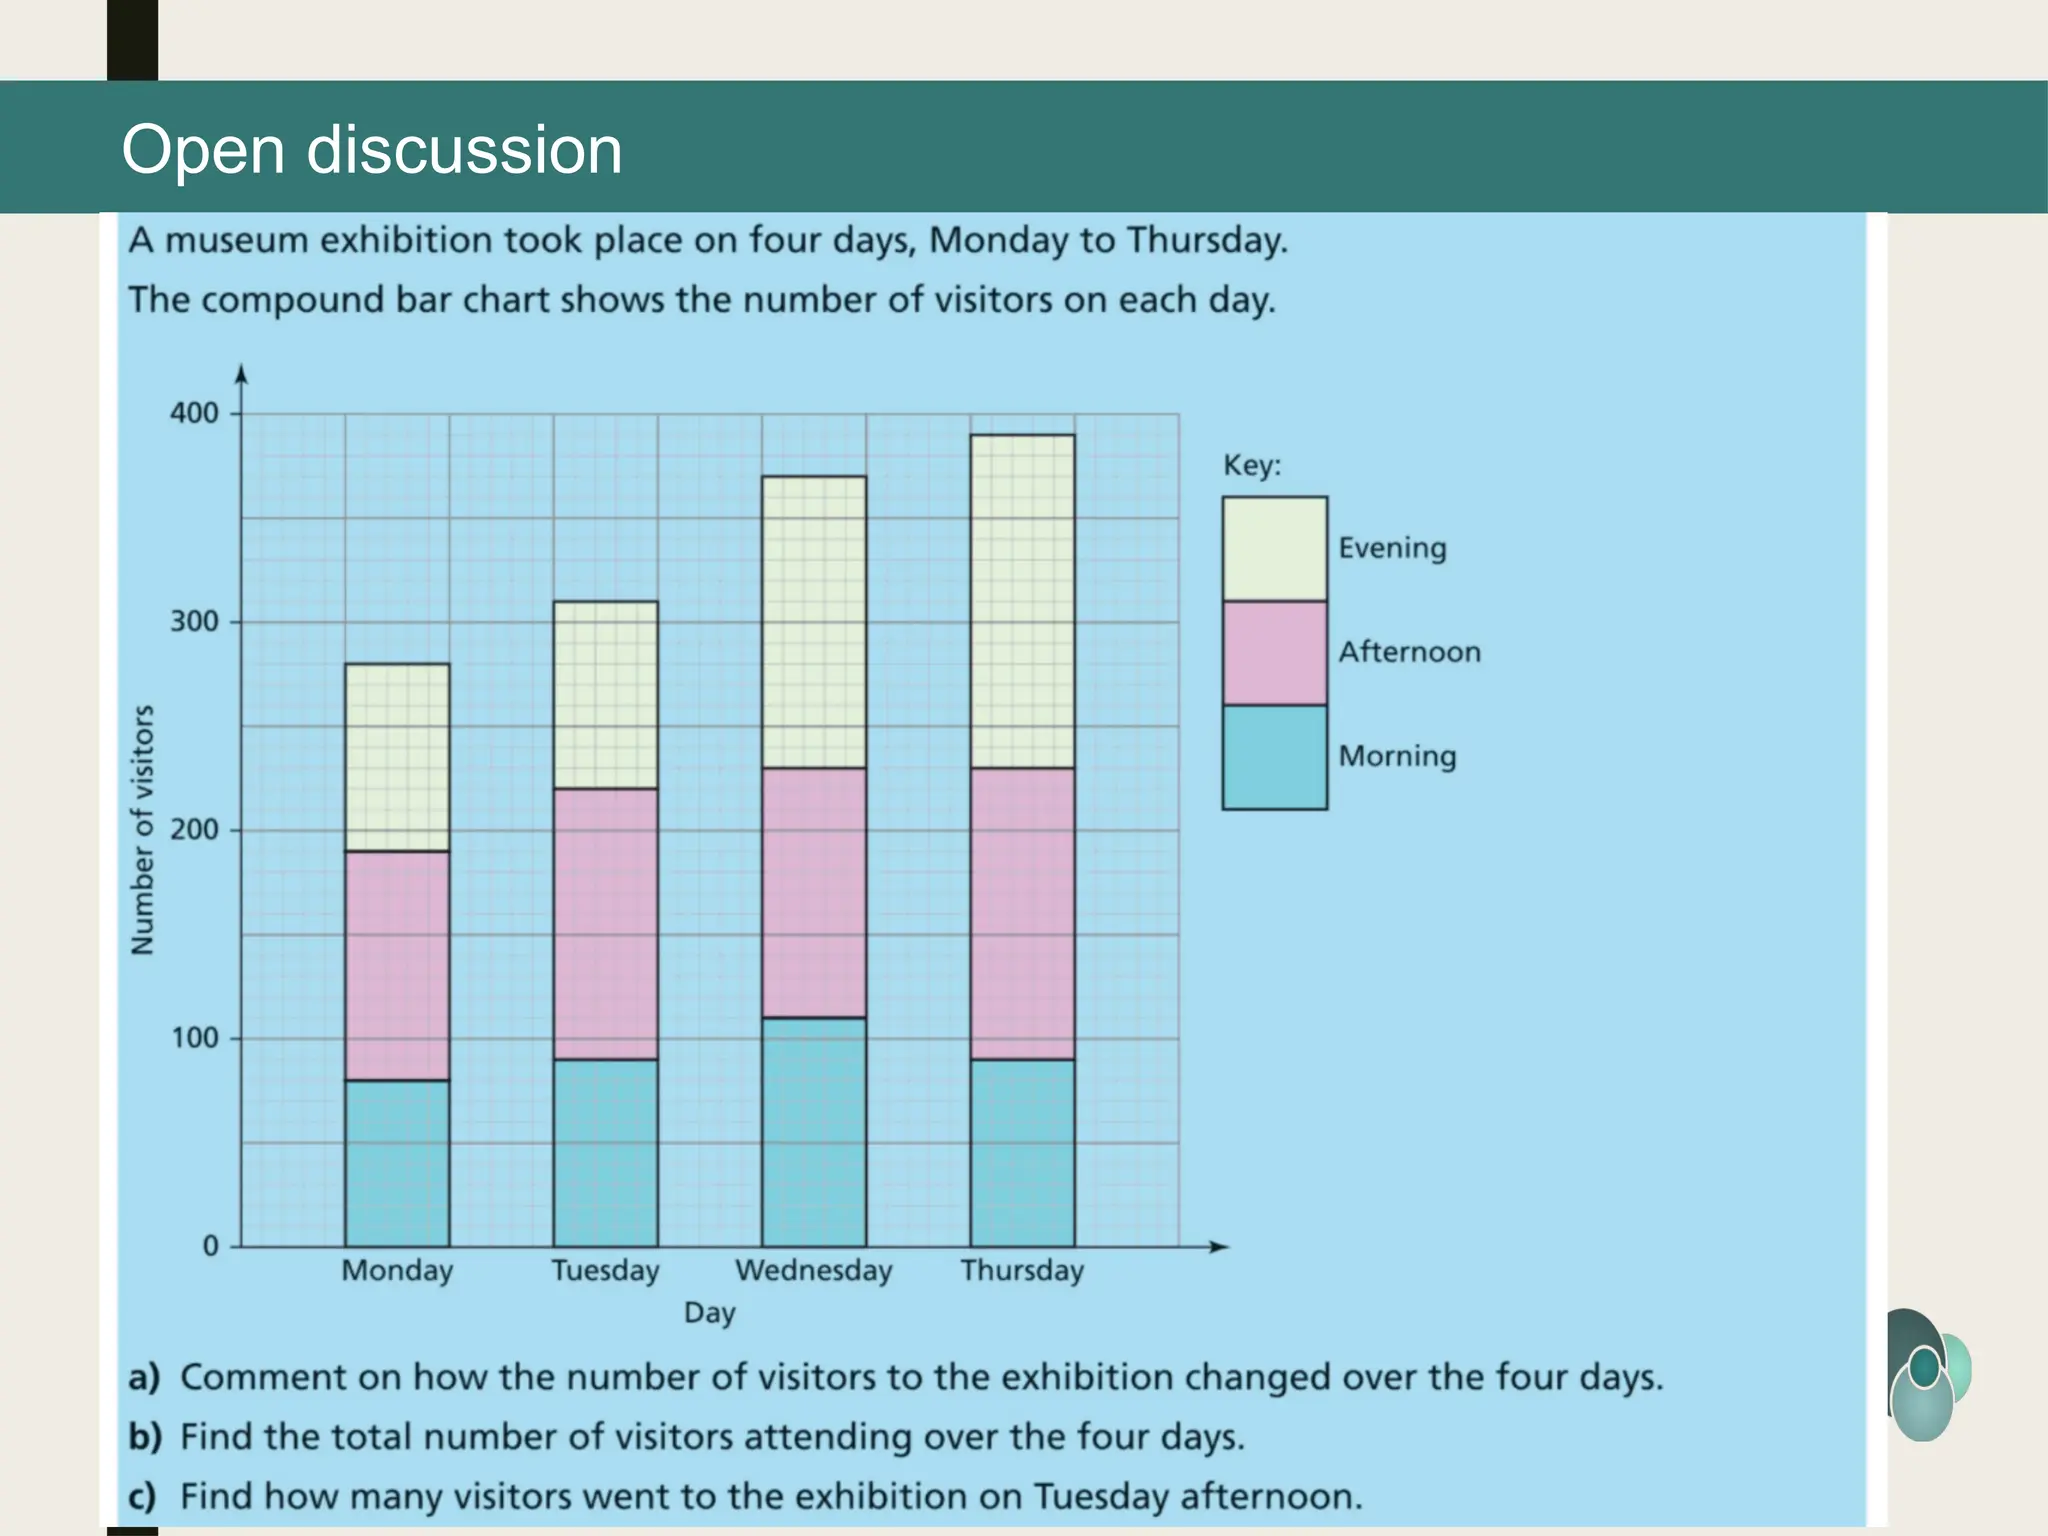
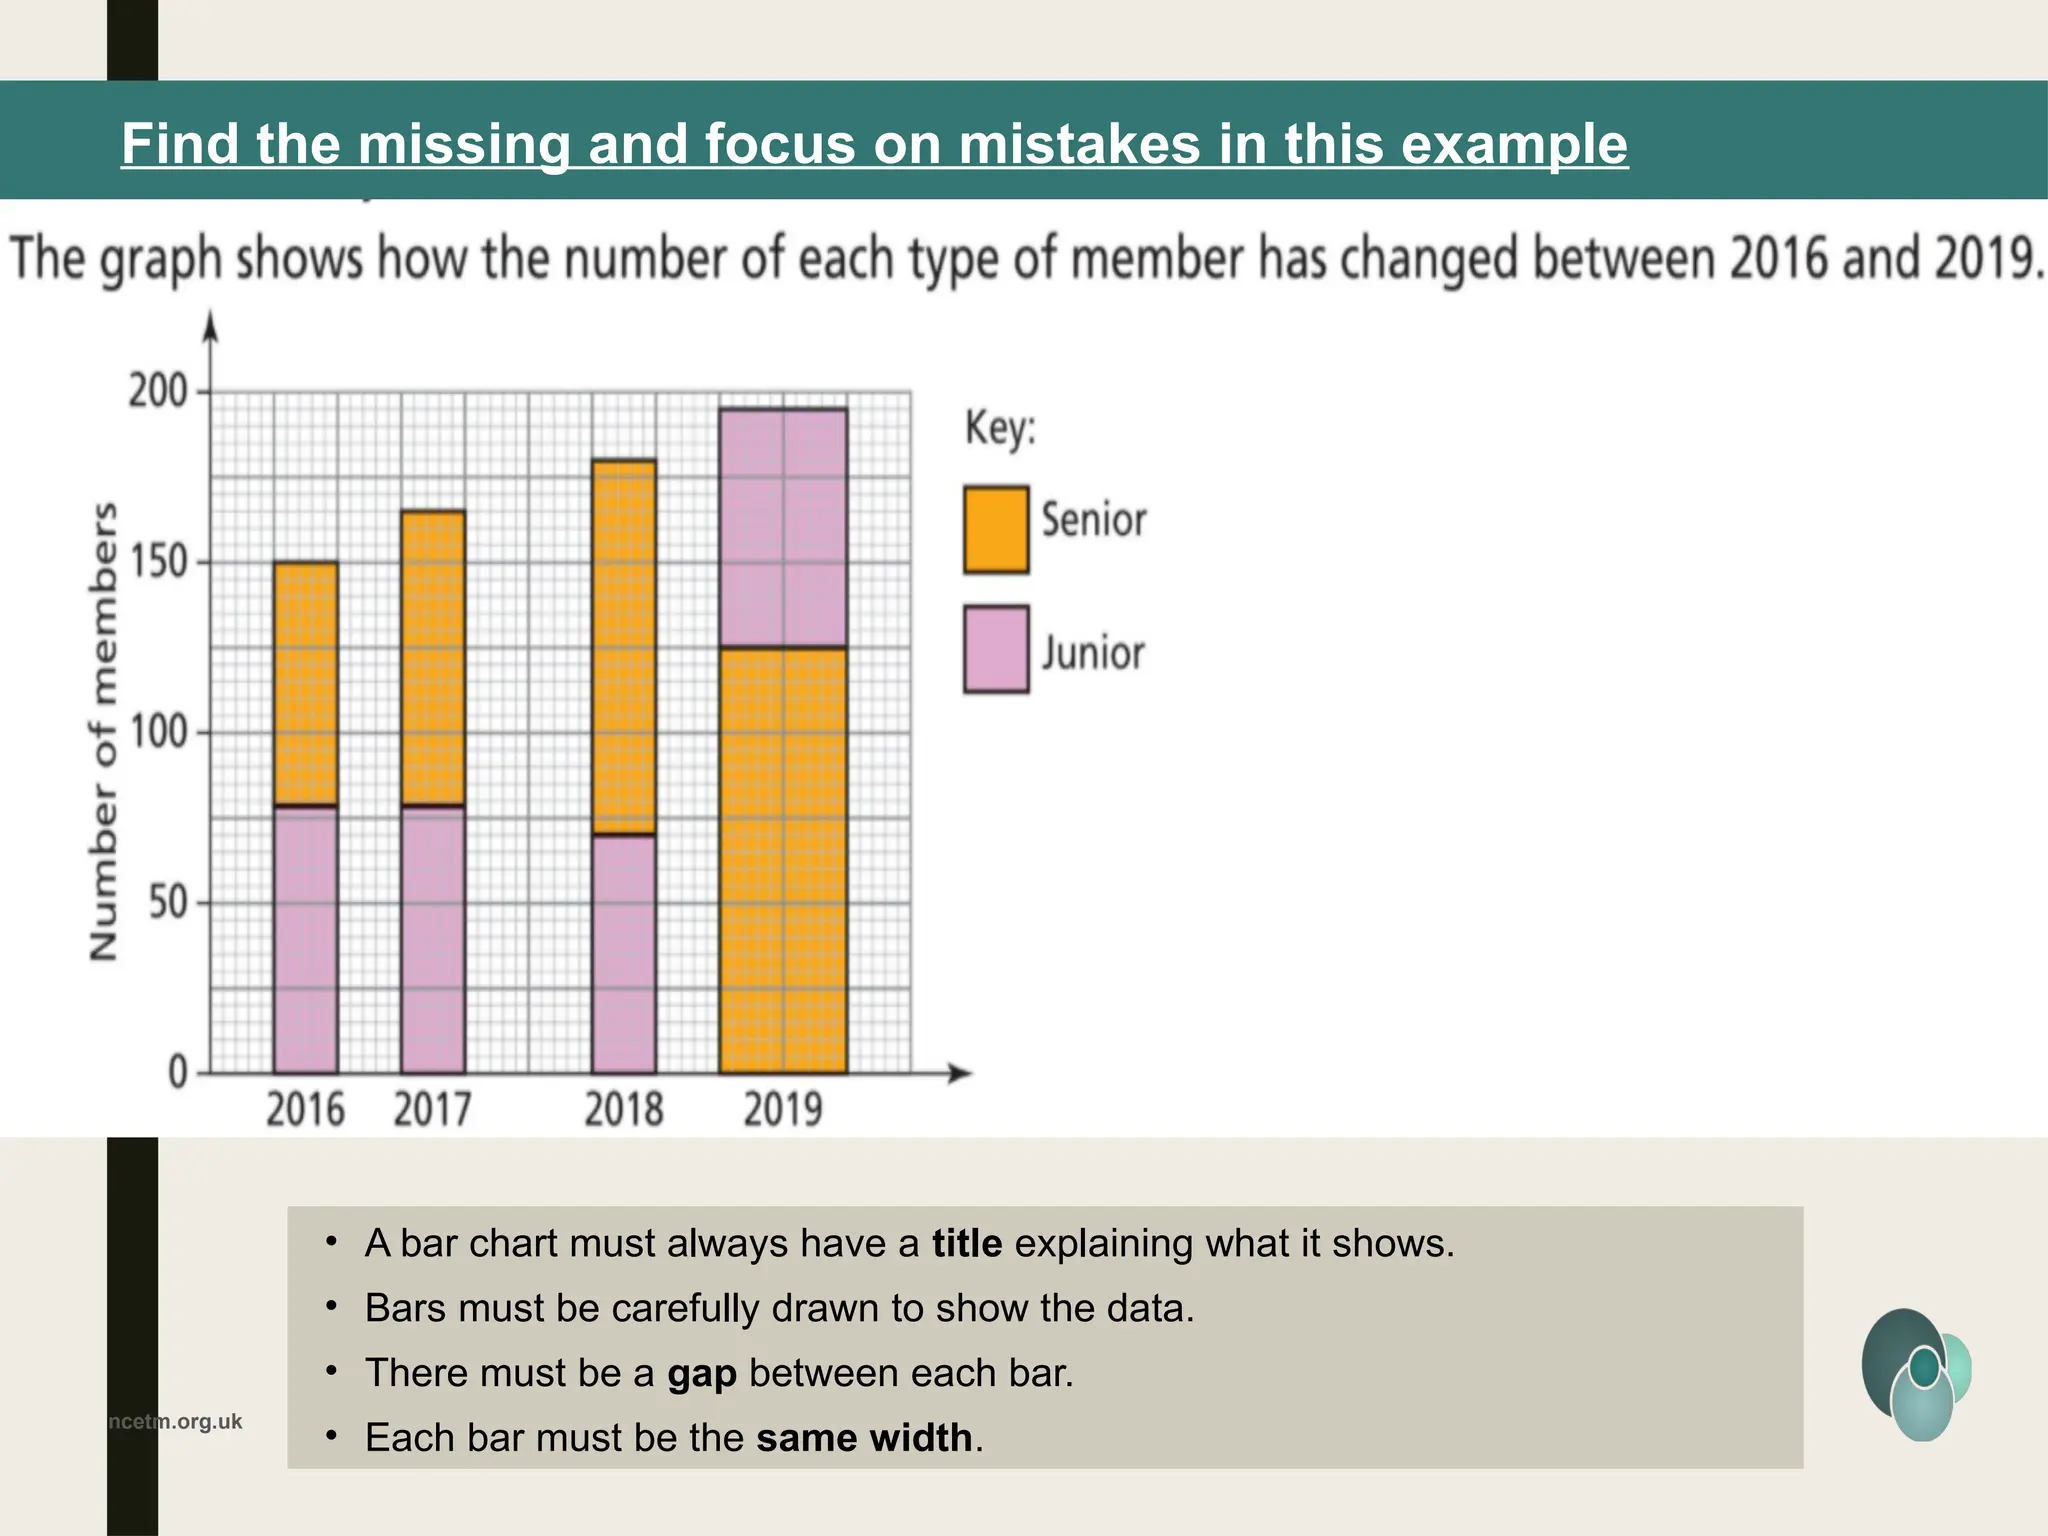
8.2
DUAL AND
COMPOUND
BAR CHARTS
Objectives
• Draw frequency diagrams dual and compound
bar charts and interpret data
ncetm.org.uk
Individual warm up (3 min)
Find missing
numbers on
the scales ?
How much
red is greater
than blue
one?
How much
blue is
greater than
red in the
second
Chart ?
ncetm.org.uk
Dual bar charts
Cat Dog Fish Rabbit Other
0
2
4
6
8
10
A Bar Chart to Show How
Many Pets Y6 Have
Number of Boys Number of Girls
Type of Pet
Number
of
Children
Cat Dog Fish Rabbit Other
0
2
4
6
8
10
12
14
16 A Bar Chart to Show
How Many Pets Y6 Have
Type of Pet
Number
of
Children
Pet Number of Children
Cat 12
Dog 14
Fish 7
Rabbit 5
Other 8
Pet
Number of
Boys
Number of
Girls
Cat 7 5
Dog 6 8
Fish 3 4
Rabbit 1 4
Other 2 6
ncetm.org.uk
Compound bar chart
Cat Dog Fish Rabbit Other
0
2
4
6
8
10
A Bar Chart to Show
How Many Pets Y6
Have
Number of Boys Number of Girls
Type of Pet
Number
of
Children
Pet Number of Boys
Number of
Girls
Cat 7 3
Dog 6 4
Fish 3 4
Rabbit 1 4
Other 2 6
Pet Number of Children
Cat 12
Dog 14
Fish 7
Rabbit 5
Other 8 Cat Dog Fish Rabbit Other
0
2
4
6
8
10
12
14
16
A Bar Chart to Show
How Many Pets Y6
Have
Type of Pet
Number
of
Children
a) What percentage of students in 8U received for effort?
b) Which tutor group received the highest percentage of their
marks for classwork?
c) Given 8D received a total of 200 marks, how many of these
were for classwork?
d) “More students in 8D received marks for home learning than in
8U”. Is this correct? Explain.
Percentage of each task in 8U ,8
%63
%87
%97
%68
%88
%99
%10 %11
ncetm.org.uk
Difference between the 2 charts
ncetm.org.uk
Open discussion
ncetm.org.uk
Find the missing and focus on mistakes in this example
• A bar chart must always have a title explaining what it shows.
• Bars must be carefully drawn to show the data.
• There must be a gap between each bar.
• Each bar must be the same width.
ncetm.org.uk
Individual Work *copybook *
student book ( p 89(
ncetm.org.uk
Check your answers
Classwork
P. (90 89)
Q. ( 3 to (6
30/11/2024
Dual and Compound bar charts
Lesson dual and compound bar charts.pptx

Lesson dual and compound bar charts.pptx

  • 1.
    8.2 DUAL AND COMPOUND BAR CHARTS Objectives •Draw frequency diagrams dual and compound bar charts and interpret data
  • 2.
    ncetm.org.uk Individual warm up(3 min) Find missing numbers on the scales ? How much red is greater than blue one? How much blue is greater than red in the second Chart ?
  • 3.
    ncetm.org.uk Dual bar charts CatDog Fish Rabbit Other 0 2 4 6 8 10 A Bar Chart to Show How Many Pets Y6 Have Number of Boys Number of Girls Type of Pet Number of Children Cat Dog Fish Rabbit Other 0 2 4 6 8 10 12 14 16 A Bar Chart to Show How Many Pets Y6 Have Type of Pet Number of Children Pet Number of Children Cat 12 Dog 14 Fish 7 Rabbit 5 Other 8 Pet Number of Boys Number of Girls Cat 7 5 Dog 6 8 Fish 3 4 Rabbit 1 4 Other 2 6
  • 4.
    ncetm.org.uk Compound bar chart CatDog Fish Rabbit Other 0 2 4 6 8 10 A Bar Chart to Show How Many Pets Y6 Have Number of Boys Number of Girls Type of Pet Number of Children Pet Number of Boys Number of Girls Cat 7 3 Dog 6 4 Fish 3 4 Rabbit 1 4 Other 2 6 Pet Number of Children Cat 12 Dog 14 Fish 7 Rabbit 5 Other 8 Cat Dog Fish Rabbit Other 0 2 4 6 8 10 12 14 16 A Bar Chart to Show How Many Pets Y6 Have Type of Pet Number of Children
  • 5.
    a) What percentageof students in 8U received for effort? b) Which tutor group received the highest percentage of their marks for classwork? c) Given 8D received a total of 200 marks, how many of these were for classwork? d) “More students in 8D received marks for home learning than in 8U”. Is this correct? Explain. Percentage of each task in 8U ,8 %63 %87 %97 %68 %88 %99 %10 %11
  • 6.
  • 7.
  • 8.
    ncetm.org.uk Find the missingand focus on mistakes in this example • A bar chart must always have a title explaining what it shows. • Bars must be carefully drawn to show the data. • There must be a gap between each bar. • Each bar must be the same width.
  • 9.
  • 10.
  • 11.
    Classwork P. (90 89) Q.( 3 to (6 30/11/2024 Dual and Compound bar charts