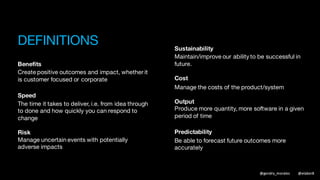
@gendry_morales @elabor8
“WITHOUT DATA YOU’RE
JUST ANOTHER PERSON
WITH AN OPINION”
W. EDWARDS DEMING
@gendry_morales @elabor8
* NOT JUST AGILE MATURITY
@gendry_morales @elabor8
BENEFITS
SUSTAINABILITYCOST
OUTPUT RISK
SPEED
PREDICTABILITY
7 DIMENSIONS
OF PRODUCT
DELIVERY
PERFORMANCE
@gendry_morales @elabor8
Benefits
Create positive outcomes and impact, whether it
is customer focused or corporate
Speed
The time it takes to deliver, i.e. from idea through
to done and how quickly you can respond to
change
Risk
Manage uncertain events with potentially adverse
impacts
Sustainability
Maintain/improve our ability to be successful in
future.
Cost
Manage the costs of the product/system
Output
Produce more quantity, more software in a given
period of time
Predictability
Be able to forecast future outcomes more
accurately
DEFINITIONS
@gendry_morales @elabor8
BENEFITS
SUSTAINABILITYCOST
OUTPUT RISK
SPEED
PREDICTABILITY
@gendry_morales @elabor8
START WITH A QUESTION
And look for the answer using data
@gendry_morales @elabor8
DEFINE THE DATA
Be specific
Pre-empt questions and concerns from others
Be clear on what’s in / what’s out
Be clear about the time slices
@gendry_morales @elabor8
REVIEW THE DATA QUALITY
Sample check the
details
Work with teams
Explore unusual
patterns
@gendry_morales @elabor8
A
QUESTION
“How long does it
take to deliver?”
@gendry_morales @elabor8
We’ll collect the
cycle time to find the
answer
@gendry_morales @elabor8
In
Progress
Ready
for SIT
“CYCLE TIME”
The duration from In Progress to Deployed
* Based on the lifecycle of a story
DATA
DEFINITION
Ready
for QA
QABacklog DeployedSIT
Ready to
deploy
start end
Measure
@gendry_morales @elabor8
THE ANSWER
USING A CYCLE TIME DISTRIBUTION
50% of the time it takes less
than 5 Days
80% of the time it takes less
than 10 days
0
1
2
3
4
5
6
7
0 5 10 15 20 25
COUNTOFCYCLETIME
CYCLE TIME IN DAYS
@gendry_morales @elabor8
A
QUESTION
“Why is it taking so
long to deliver?”
@gendry_morales @elabor8
THE ANSWER
TIME IN STATUS
CYCLE TIME AVERAGE:
14 DAYS
AVERAGE WAIT IN TO DO:
10 DAYS
10 5 2 1 2 2 2
0 5 10 15 20 25
TEAM 1
AVERAGE DAYS DURATION
To Do In Progress QA Ready for SIT QA SIT PASSED SIT Blocked
@gendry_morales @elabor8
A
QUESTION
“Are we on track for
delivery?”
@gendry_morales @elabor8
THE ANSWER
RISK BURNDOWN: ADAPTIVE RISK MANAGEMENT, FOCUS ON DAYS
33
31
32 32
22
32 32
28
33
30
28
25
23
20
18
15
13
10
8
5
3
00
5
10
15
20
25
30
35
13 12 11 10 9 8 7 6 5 4 3 2 1
RiskExposure(pastdate)
Days to go
Actual Risk Exposure Run Rate Required to meet deadline
@gendry_morales @elabor8
DATA GATHERING
STARTING WITH ESTIMATING YOUR TOP 4 RISKS, THEN RESTIMATE
EVERY X DAYS
RISKS PROBABILITY OF RISK SIZE OF LOSS (DAYS) RISK EXPOSURE
RISK 1 50% 40 20
RISK 2 25% 10 2.5
RISK 3 25% 20 5
RISK 4 25% 20 5
@gendry_morales @elabor8
FORECASTING
Making predictions of the future using
historical data
We use cycle time and the rate of
delivery to model scenarios that have
different probabilities
(using fancy Monte Carlo simulation spreadsheets)
@gendry_morales @elabor8
A
QUESTION
“When are we likely
to deliver this
initiative?”
* this initiative has 65 stories
@gendry_morales @elabor8
THE ANSWER
96% PROBABILTY OF DELIVERING 65 STORIES WITHIN 12 SPRINTS
* BASED ON THE HISTORICAL DATA FROM THIS TEAM
@gendry_morales @elabor8
A
QUESTION
“How much can we
deliver in 2 sprints?”
@gendry_morales @elabor8
THE ANSWER
96% PROBABILITY OF DELIVERING 11 STORIES
* BASED ON THE HISTORICAL DATA FROM THIS TEAM
@gendry_morales @elabor8
SWITCHING THE
AXIS AGAIN.
We ask ourselves
now, how predictable
is our delivery?
@gendry_morales @elabor8
PROBABILITY IN FOCUS
NUMBER OF STORIES IN 10 SPRINTS BY PROBABILITY
TEAM A
NUMBEROFSTORIES,SAMETIMEBOX
FORECAST PROBABILITY
100% 90% 80% 70% 60% 50% 40% 30% 20% 10%
PREDICTABILITY ACROSS TEAMS
DISTRIBUTION OF PROBABILITY BASED NUMBER OF STORIES IN 10 SPRINTS
TEAM A TEAM B TEAM C TEAM D TEAM E
NUMBEROFSTORIES,SAMETIMEBOX
FORECAST PROBABILITY
100% 90% 80% 70% 60% 50% 40% 30% 20% 10%
@gendry_morales @elabor8
A
QUESTION
“How much are we
delivering, is it more
or less than before?”
@gendry_morales @elabor8
THE ANSWER
TRACKING THROUGHPUT OVER TIME
@gendry_morales @elabor8
DATA WILL TALK
IF YOU’RE
WILLING TO
LISTEN
JIM BERGESON
@gendry_morales @elabor8
TO SOME
PEOPLE, DATA
HAS BECOME A
WEAPON OF
MATHS
DESTRUCTION
You don't trust
data, you find
ways to
undermine it and
generally avoid
using it
DATA
DENIAL
You might see
some data but
don't care what it
says and have no
need for it. You
prefer to go with
your gut
DATA
INDIFFERENT
You use data
sometimes, when it
supports your
opinions or decisions
you have already
made
DATA
INFORMED
You seek to find clarity by
searching for the data
first, it informs and
shapes the decisions you
make.
DATA
DRIVEN
Based on the work of Brent Dykes, Analytics Hero
@gendry_morales @elabor8
Conquer data undermining before it becomes
that
BUT…
@gendry_morales @elabor8
Conquer data undermining before it becomes
that“SUPREME EXCELLENCE
CONSISTS OF BREAKING THE
ENEMY’S RESISTANCE
WITHOUT FIGHTING”
SUN TZU,
THE ART OF WAR
@gendry_morales @elabor8
KNOW THE DETAIL
The detail must be understood first, the gory detail, the
assumptions, the formulas, the fields in the app where it comes
from
@gendry_morales @elabor8
FIND THE GOOD STUFF
The data is interesting once it resonates, test and learn until your
data does
@gendry_morales @elabor8
UNWANTED COMPETITION
Don’t use data as a performance weapon, be careful of playing
people off against each other by comparing teams.
WARNING:
Do not put data up on wall that compares people or teams
@gendry_morales @elabor8
ACCURACY
Reduce subjectivity
Build quality into important data collection through good process.
E.g. drop downs vs free text, mandatory fields
@gendry_morales @elabor8
✔️
✔️
✔️
@gendry_morales @elabor8
IN THE
BEGINNING
IT’S JUST
ONE DATA
NERD
SUPERHERO
DON’T
LET
BATMAN
GET
STUCK
IN
EXCEL
DATA NERD SUPERHERO TEAM
union all
select *
from your_organisation
where role in (data warehouse developer, bi
developer, data scientist, data
manager, knowledge manager)
and attitude = “willingness to help”
AND
select superheroes
from data_driven_culture_quest_team;
@gendry_morales @elabor8
DATA SOURCES DWH
BUSINESS
INTELLIGENCE
SWEET DATA
VISUALISATION,
DASHBOARDS &
REPORTING
@gendry_morales @elabor8
More people
More answers
More questions
@gendry_morales @elabor8
✔️
✔️
✔️
✔️
@gendry_morales @elabor8
MAKE IT SOMETHING
PEOPLE WANT TO
LOOK AT
@gendry_morales @elabor8
“WHAT.
SO WHAT.
NOW WHAT?”
LARRY MACCHERONE
@gendry_morales @elabor8
TEAM A TEAM B TEAM C TEAM D TEAM E
NUMBEROFSTORIES,SAMETIMEBOX
FORECAST PROBABILITY
100% 90% 80% 70% 60% 50% 40% 30% 20% 10%
THE WHAT.
LEVEL OF PREDICTABILITY
1.211.35 3.603.052.79 GRADIENT
@gendry_morales @elabor8
SO WHAT.
HOW IT AFFECTS % CONFIDENCE YOU CHOOSE TO FORECAST WITH
1.211.35 3.603.052.79 GRADIENT
Choose
higher %
Choose
lower %
Choose
lower %
Choose
highest %
Choose
highest %
@gendry_morales @elabor8
MAKING DECISIONS AROUND RISK, PREDICTABILITY AND BENEFITS.
NOW WHAT?
NOW WHAT?
RISK
REWARD
Higher predictability seems to stack the
risk / reward trade off more in your
favour.
PREDICTABILITY
@gendry_morales @elabor8
Bring the data to
where the decisions
are made
@gendry_morales @elabor8
“Data is neutral. It’s numbers. It’s unbiased
truth.
So when you’re passionate about data, you’re
passionate about clarity.
Data is the only honest measure of progress.”
Hugh MacLeod
@gendry_morales @elabor8
1. BE READY TO BE
WRONG
2. SEARCH FOR THE
TRUTH
3. CREATE MORE DATA
DRIVEN
CONVERSATION
@gendry_morales @elabor8

Less Talk, More Data Driven Conversation