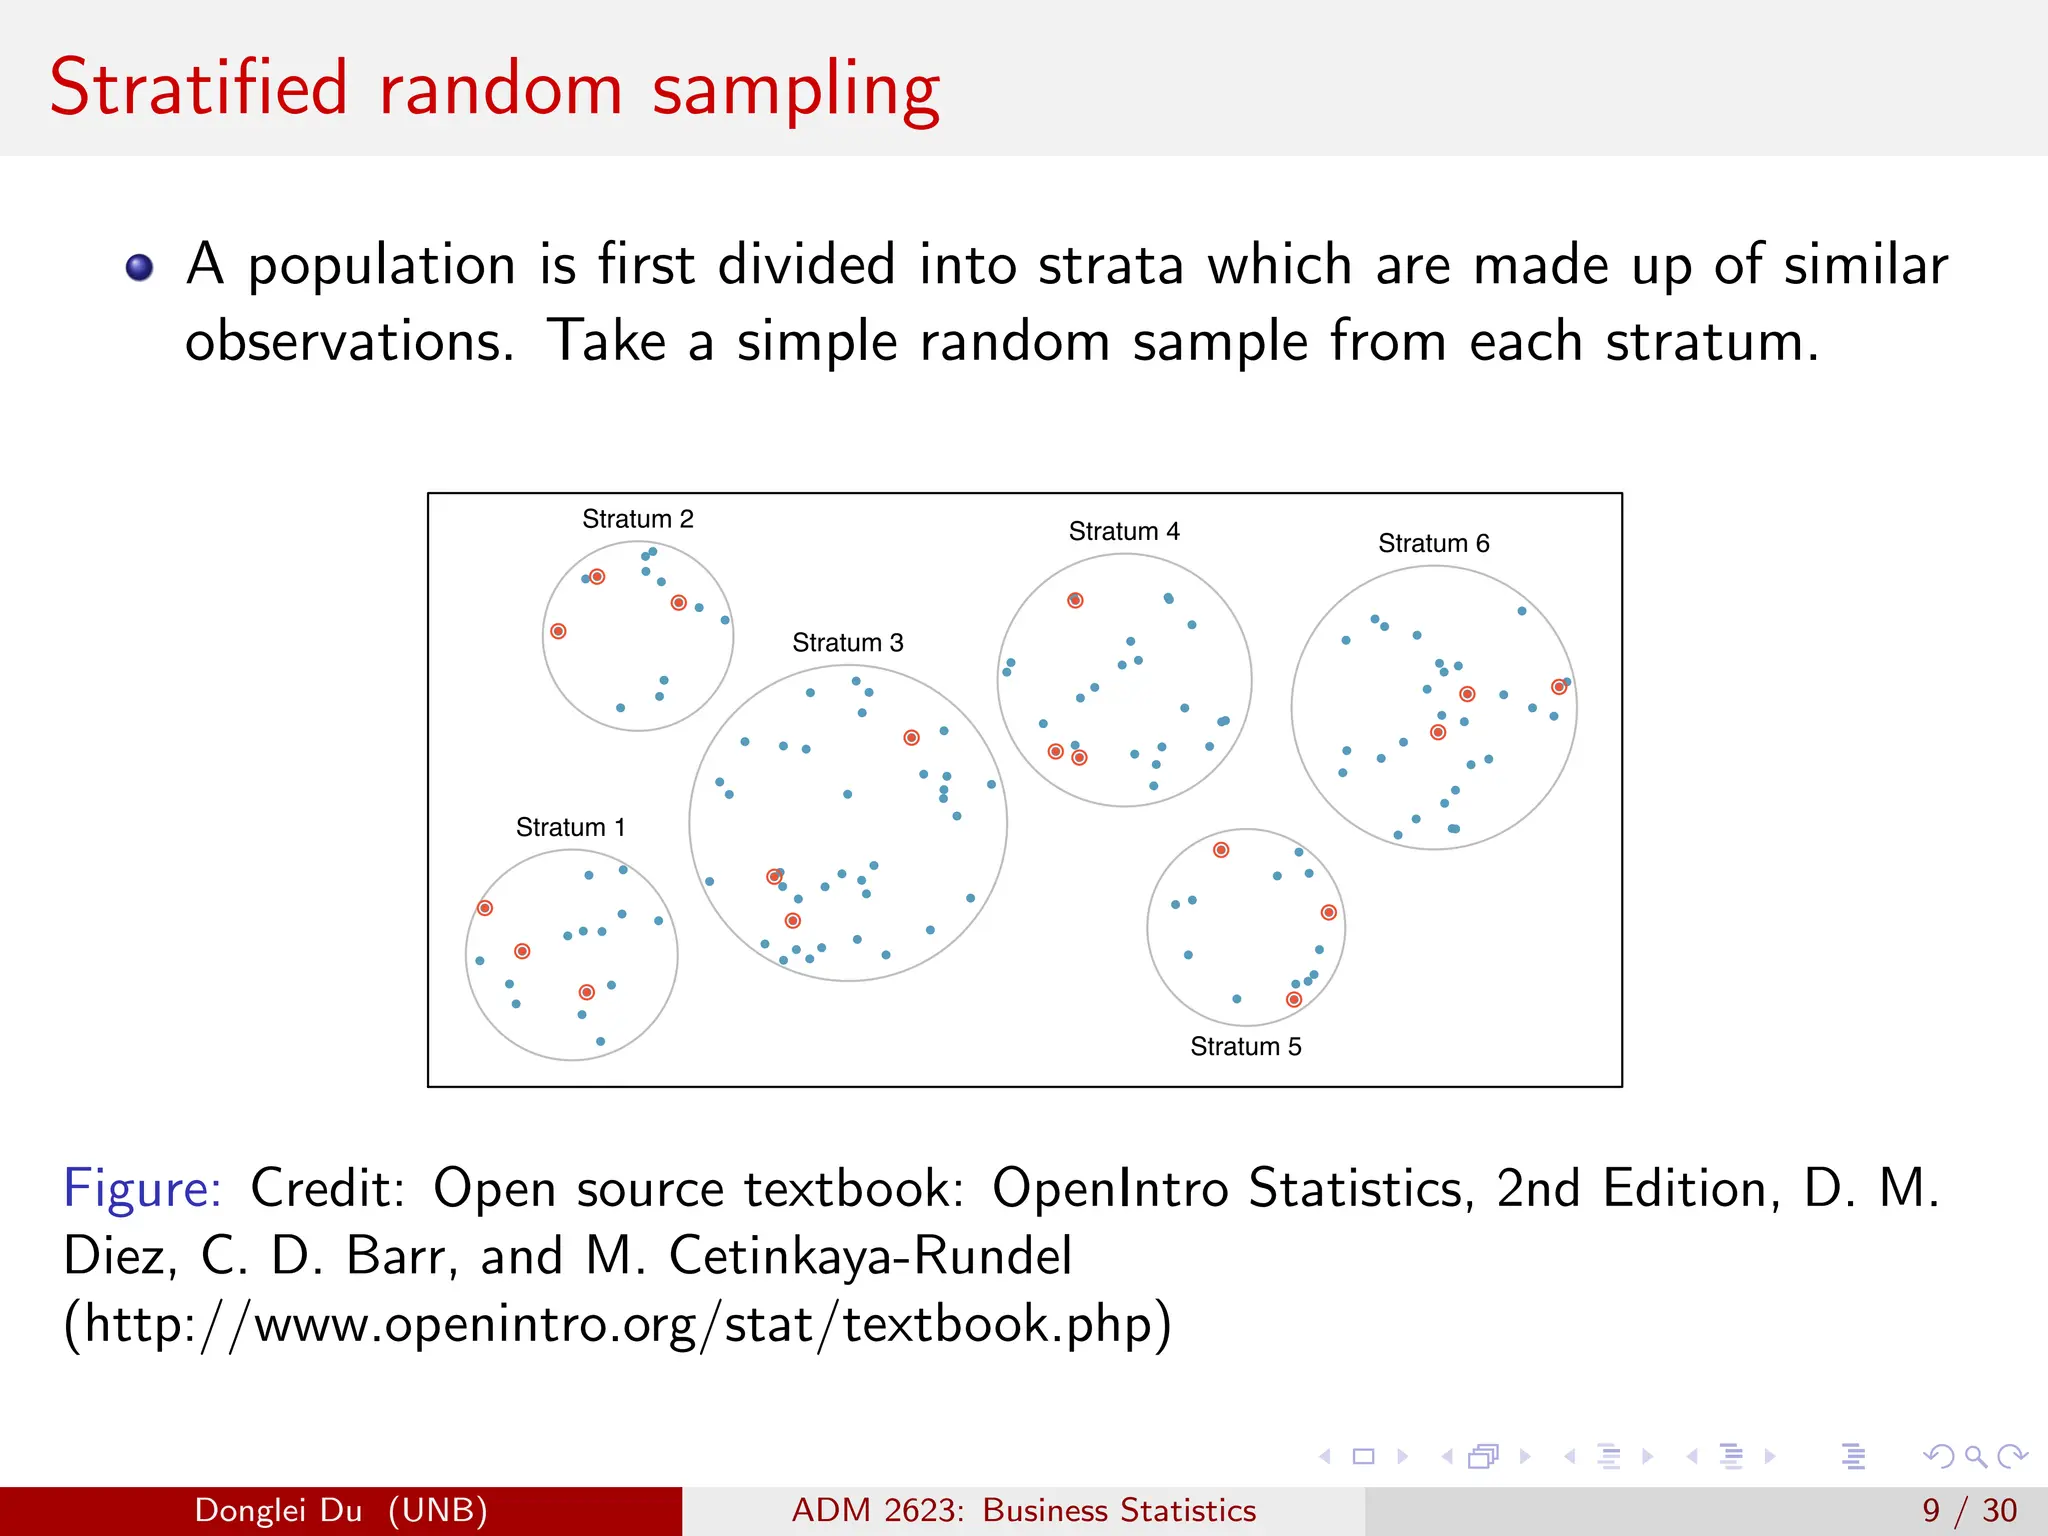
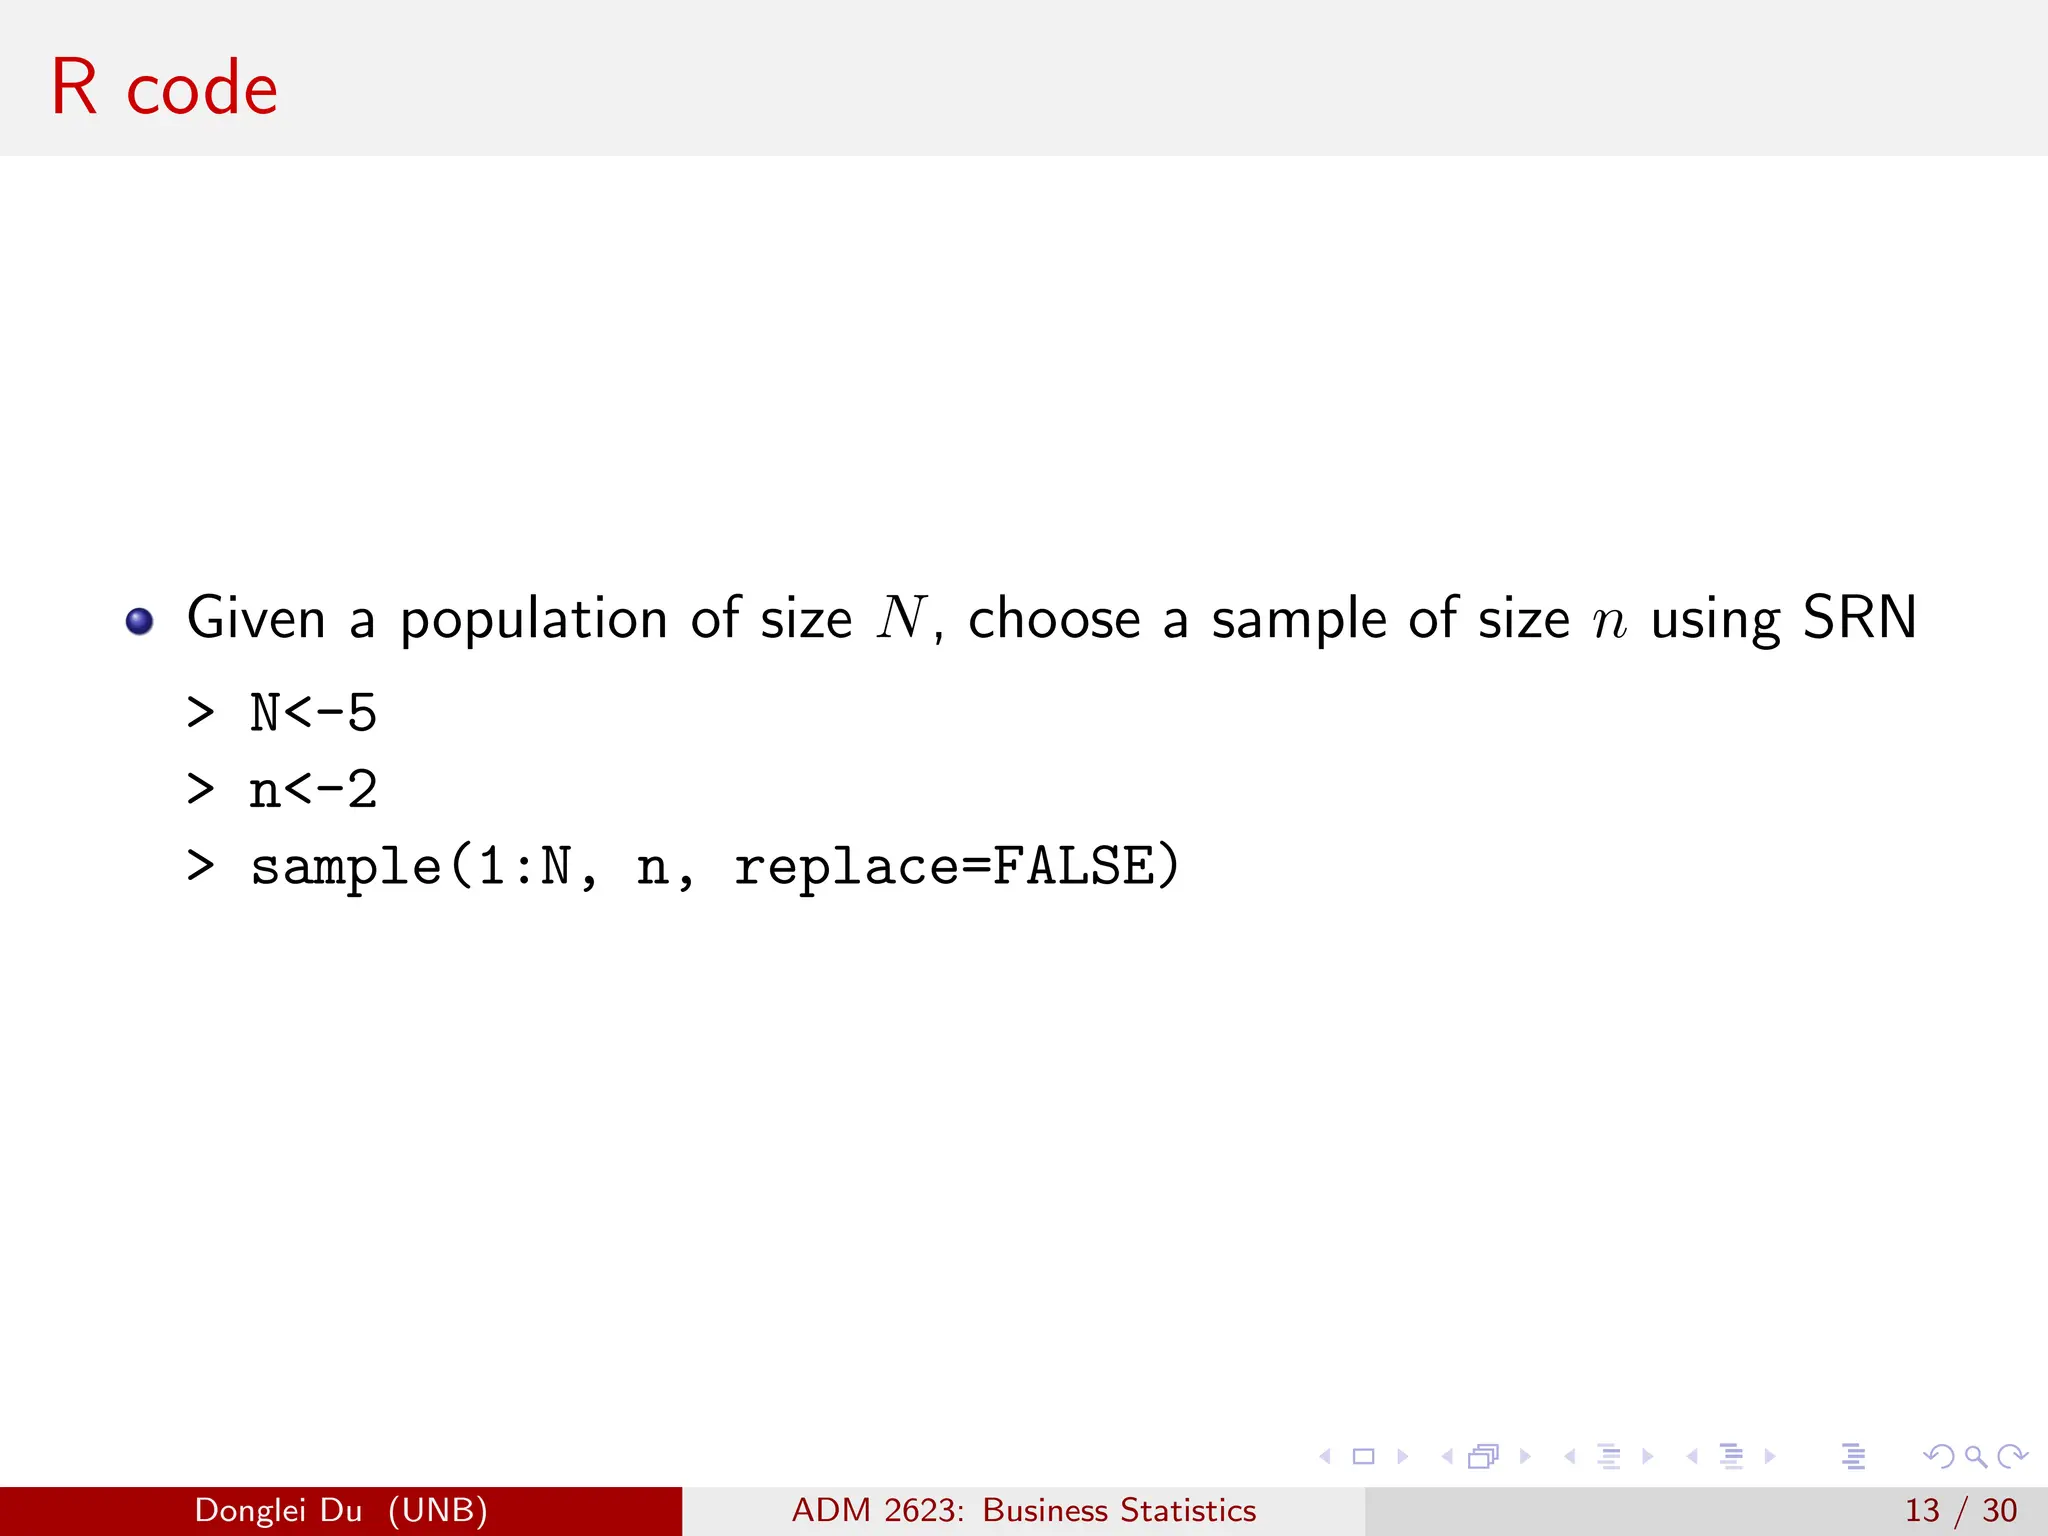
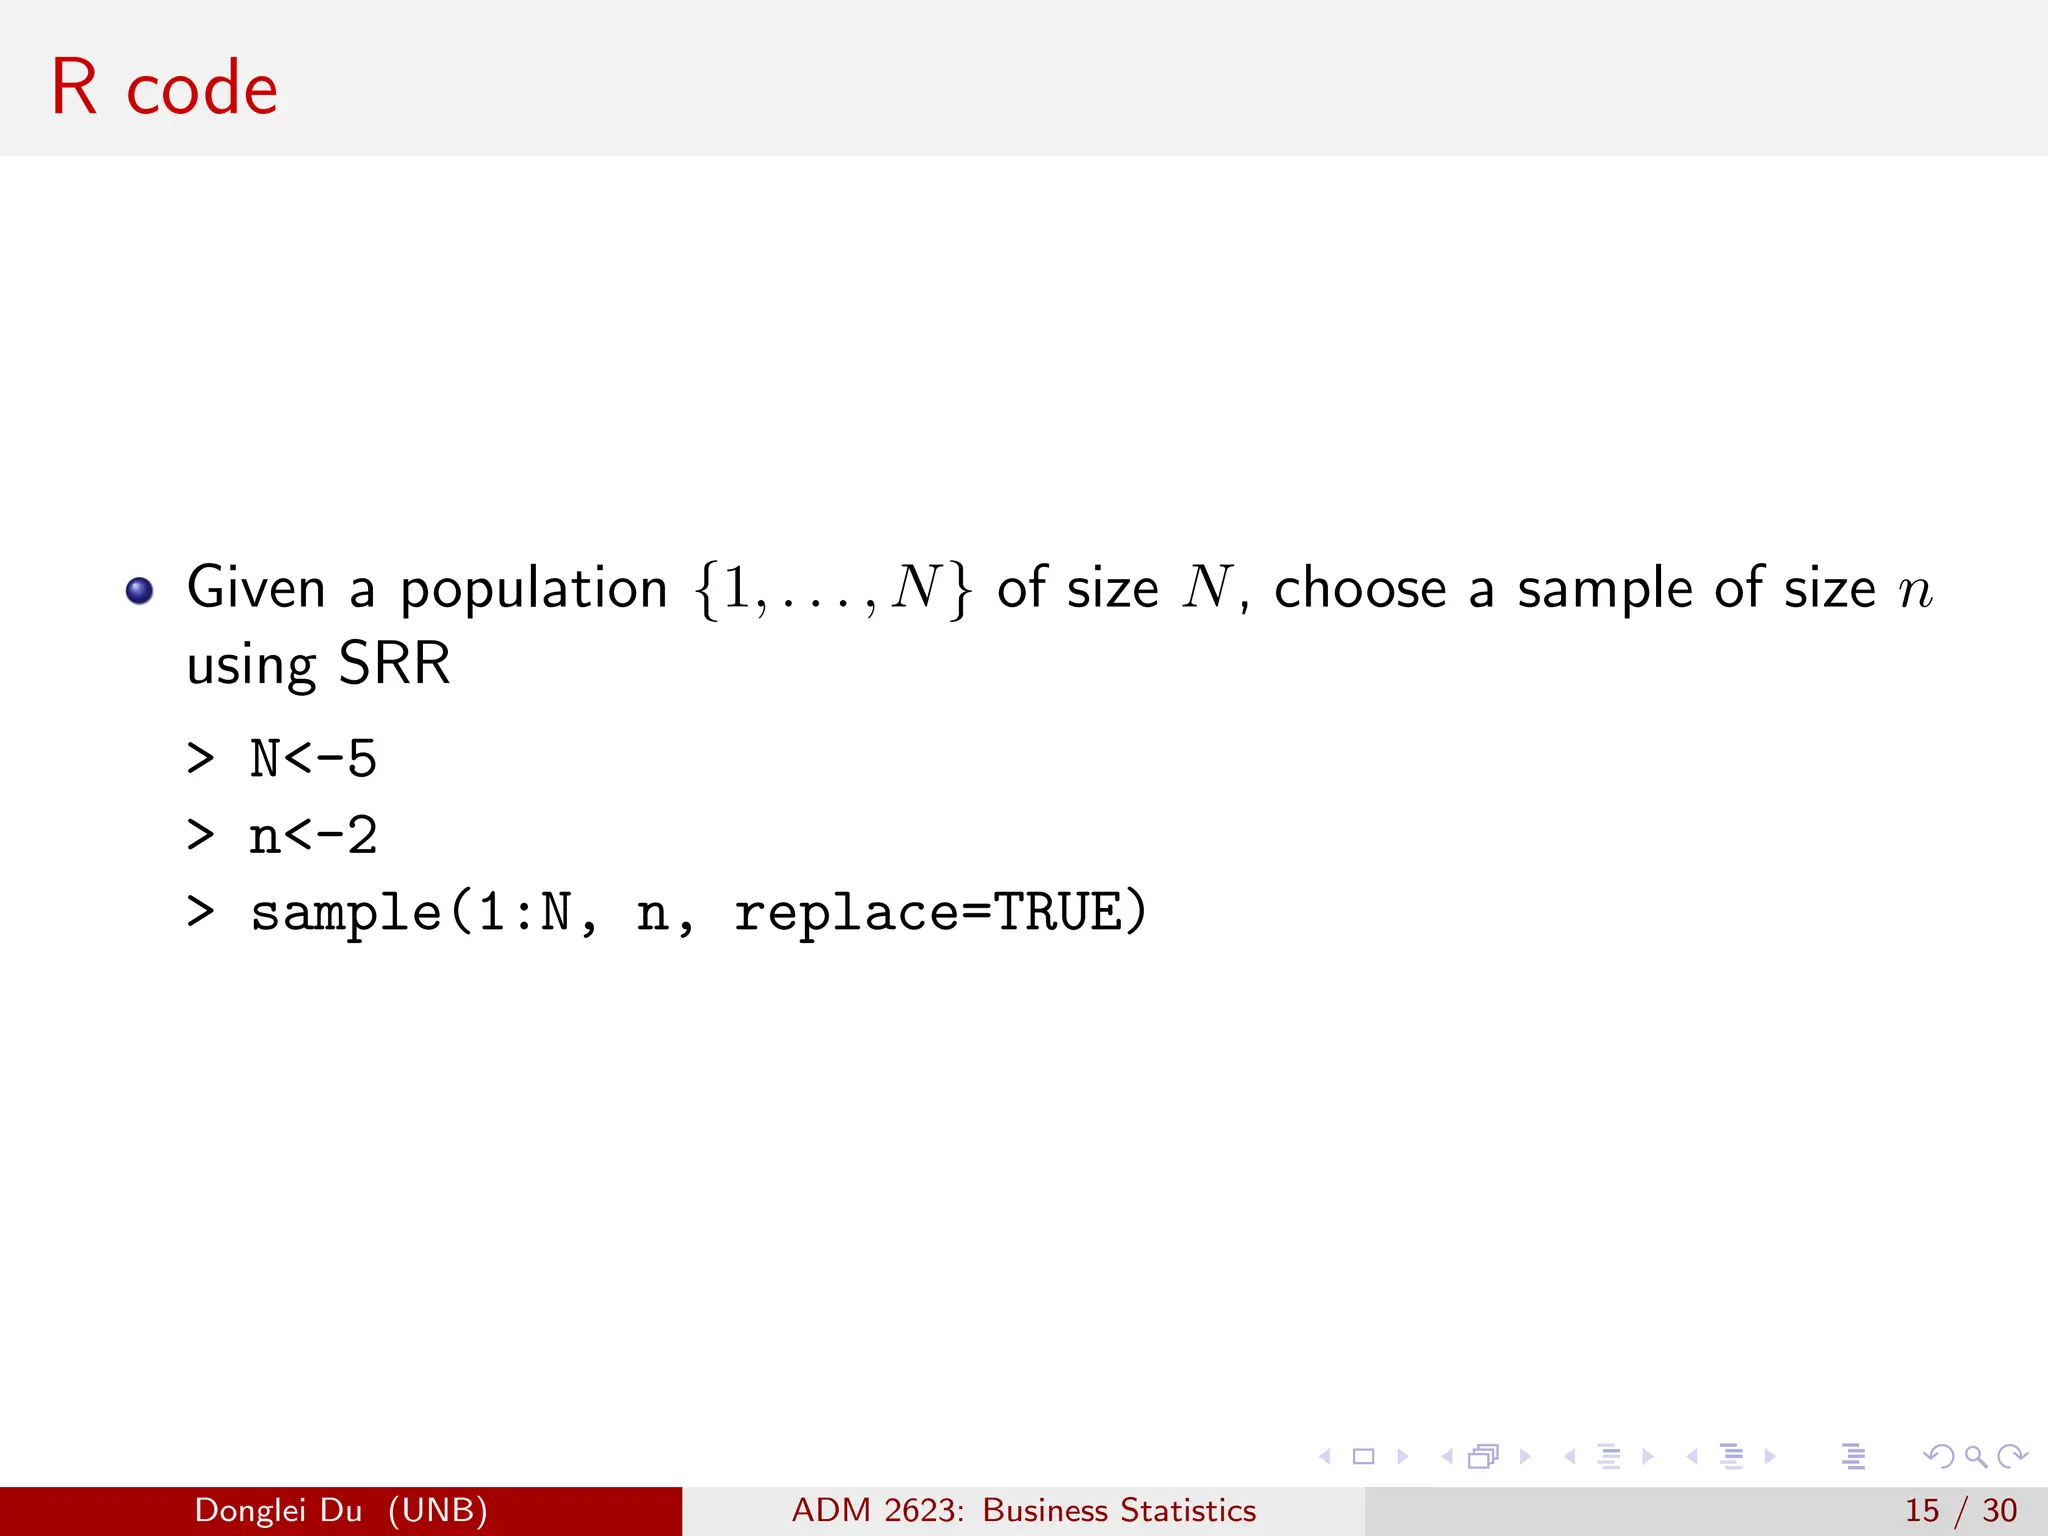
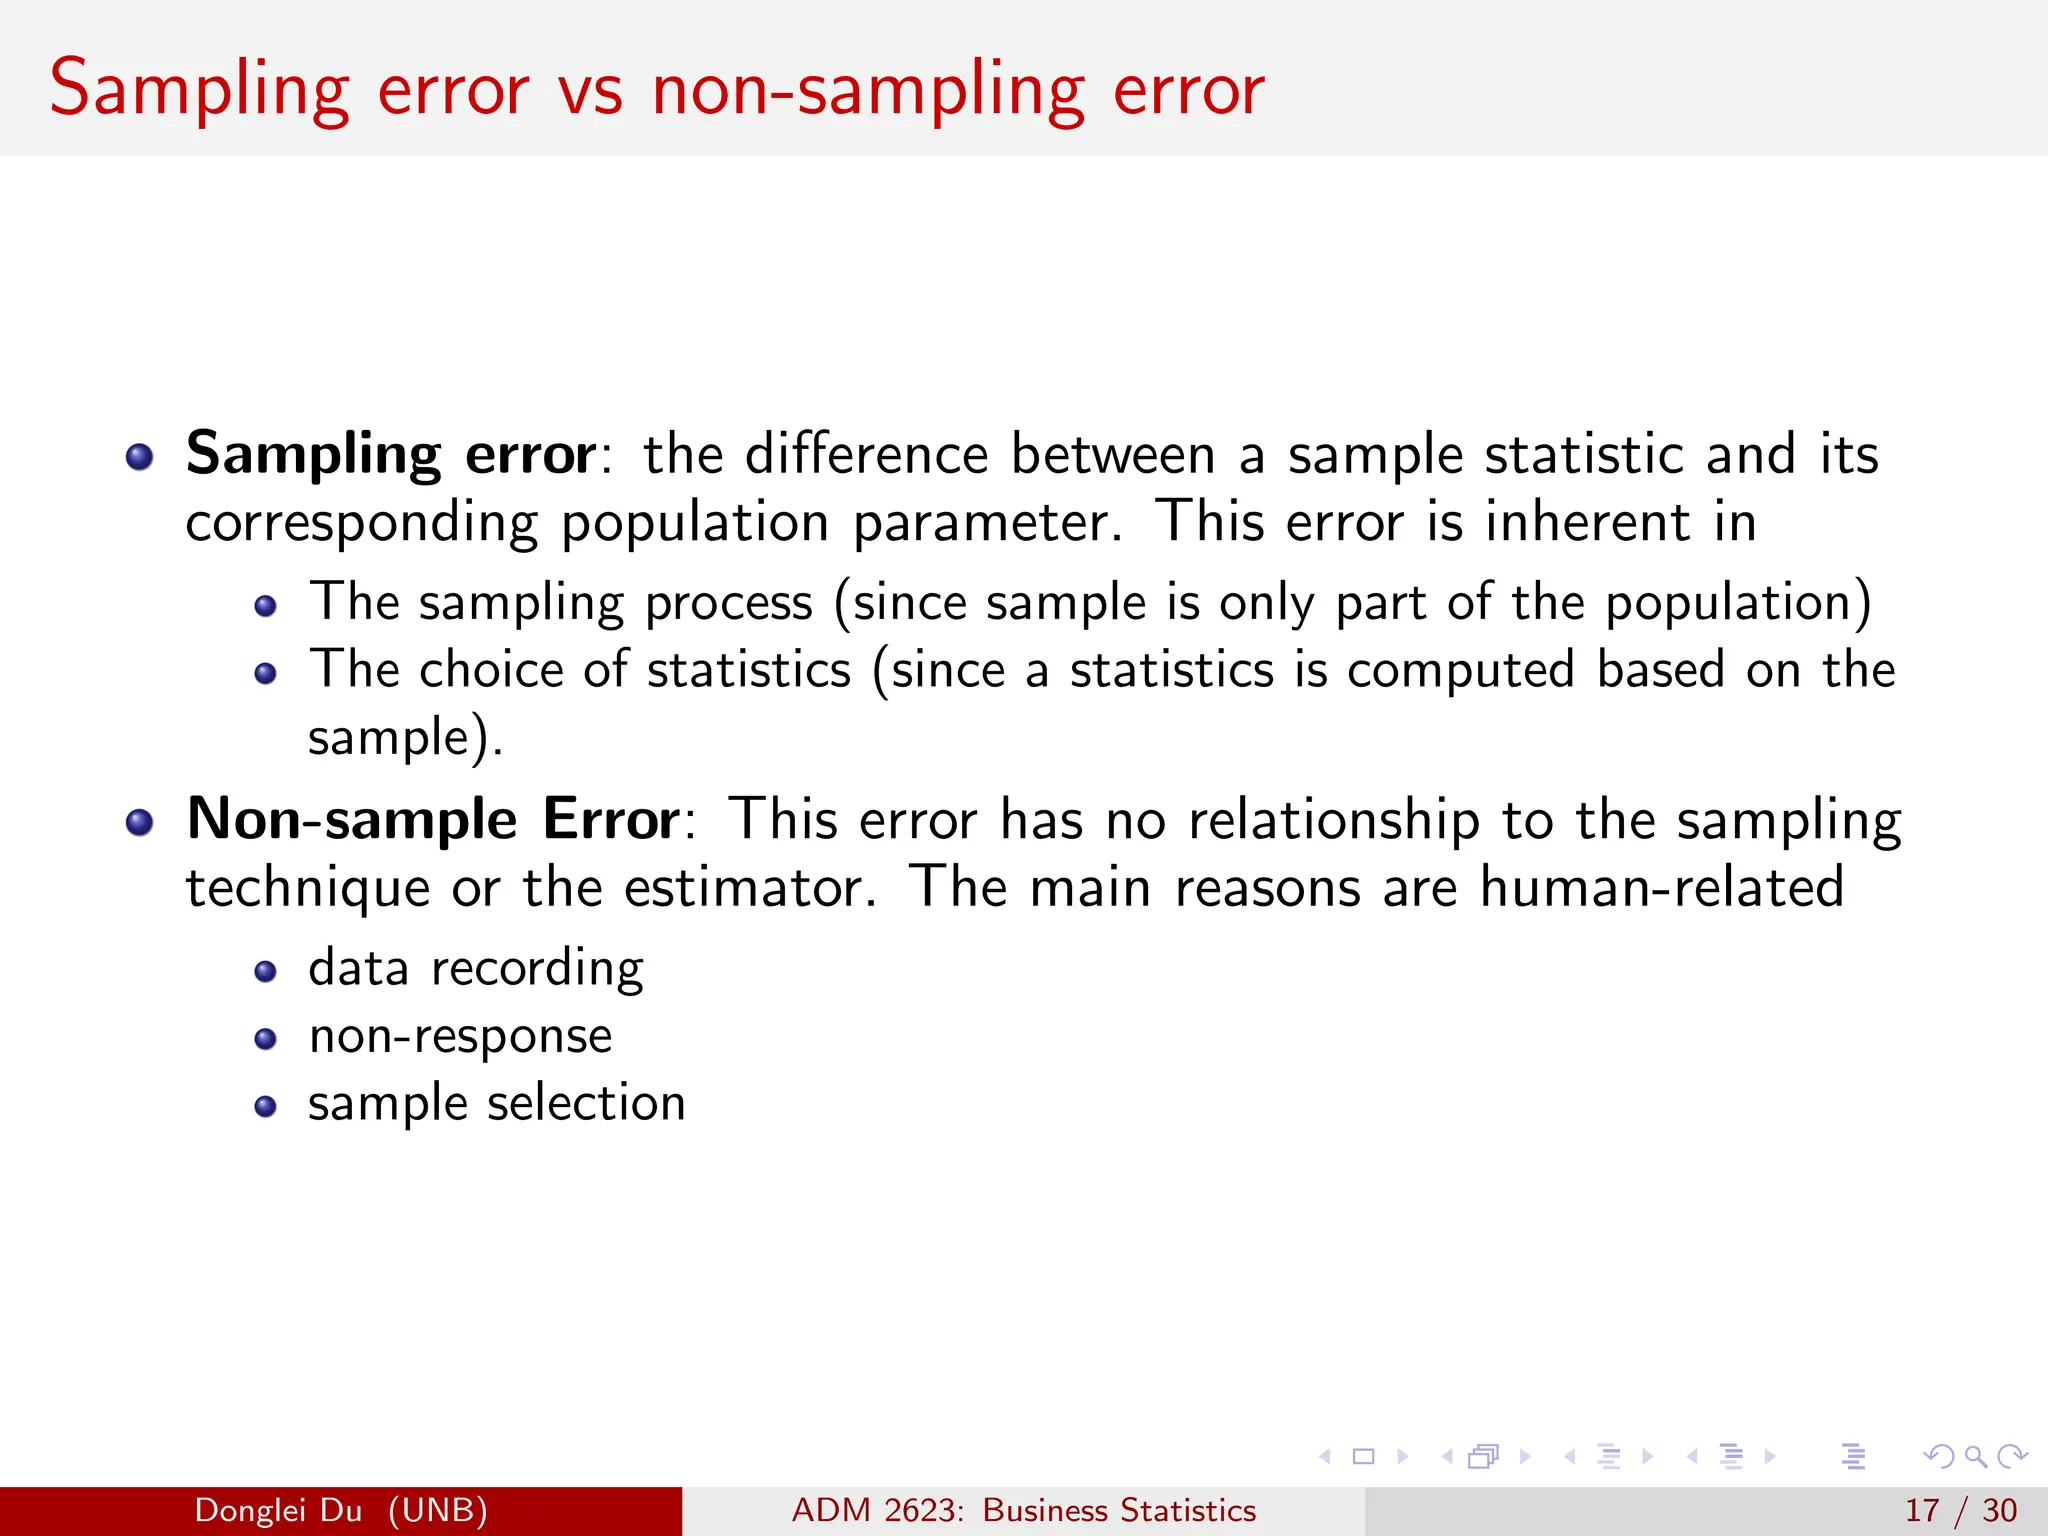
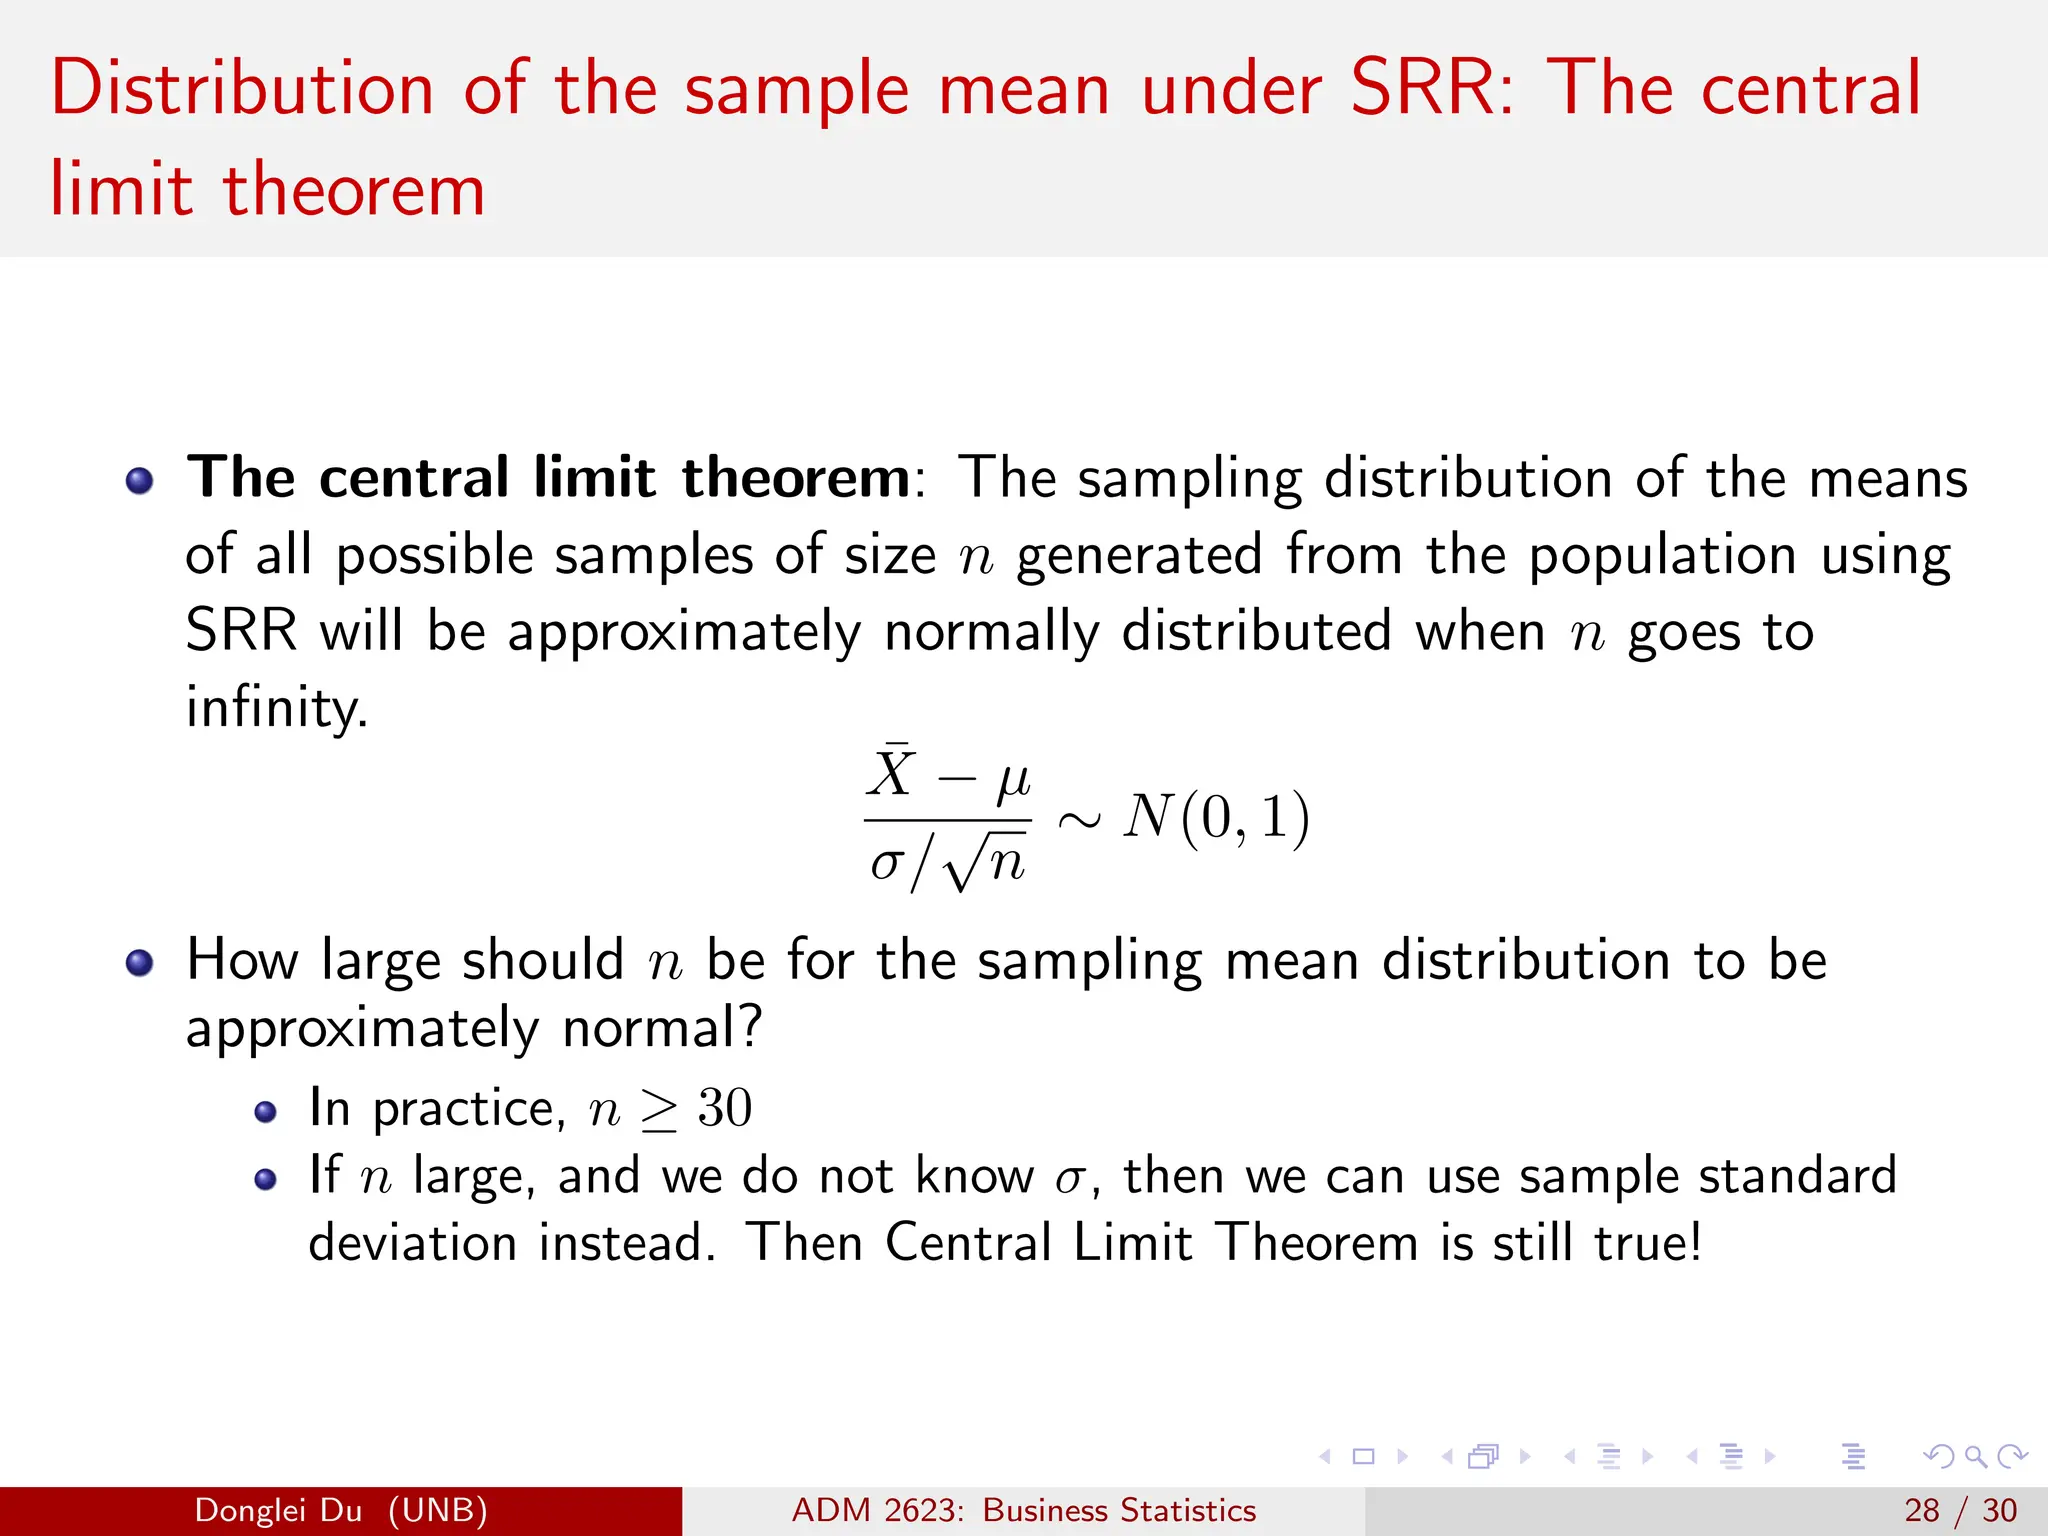
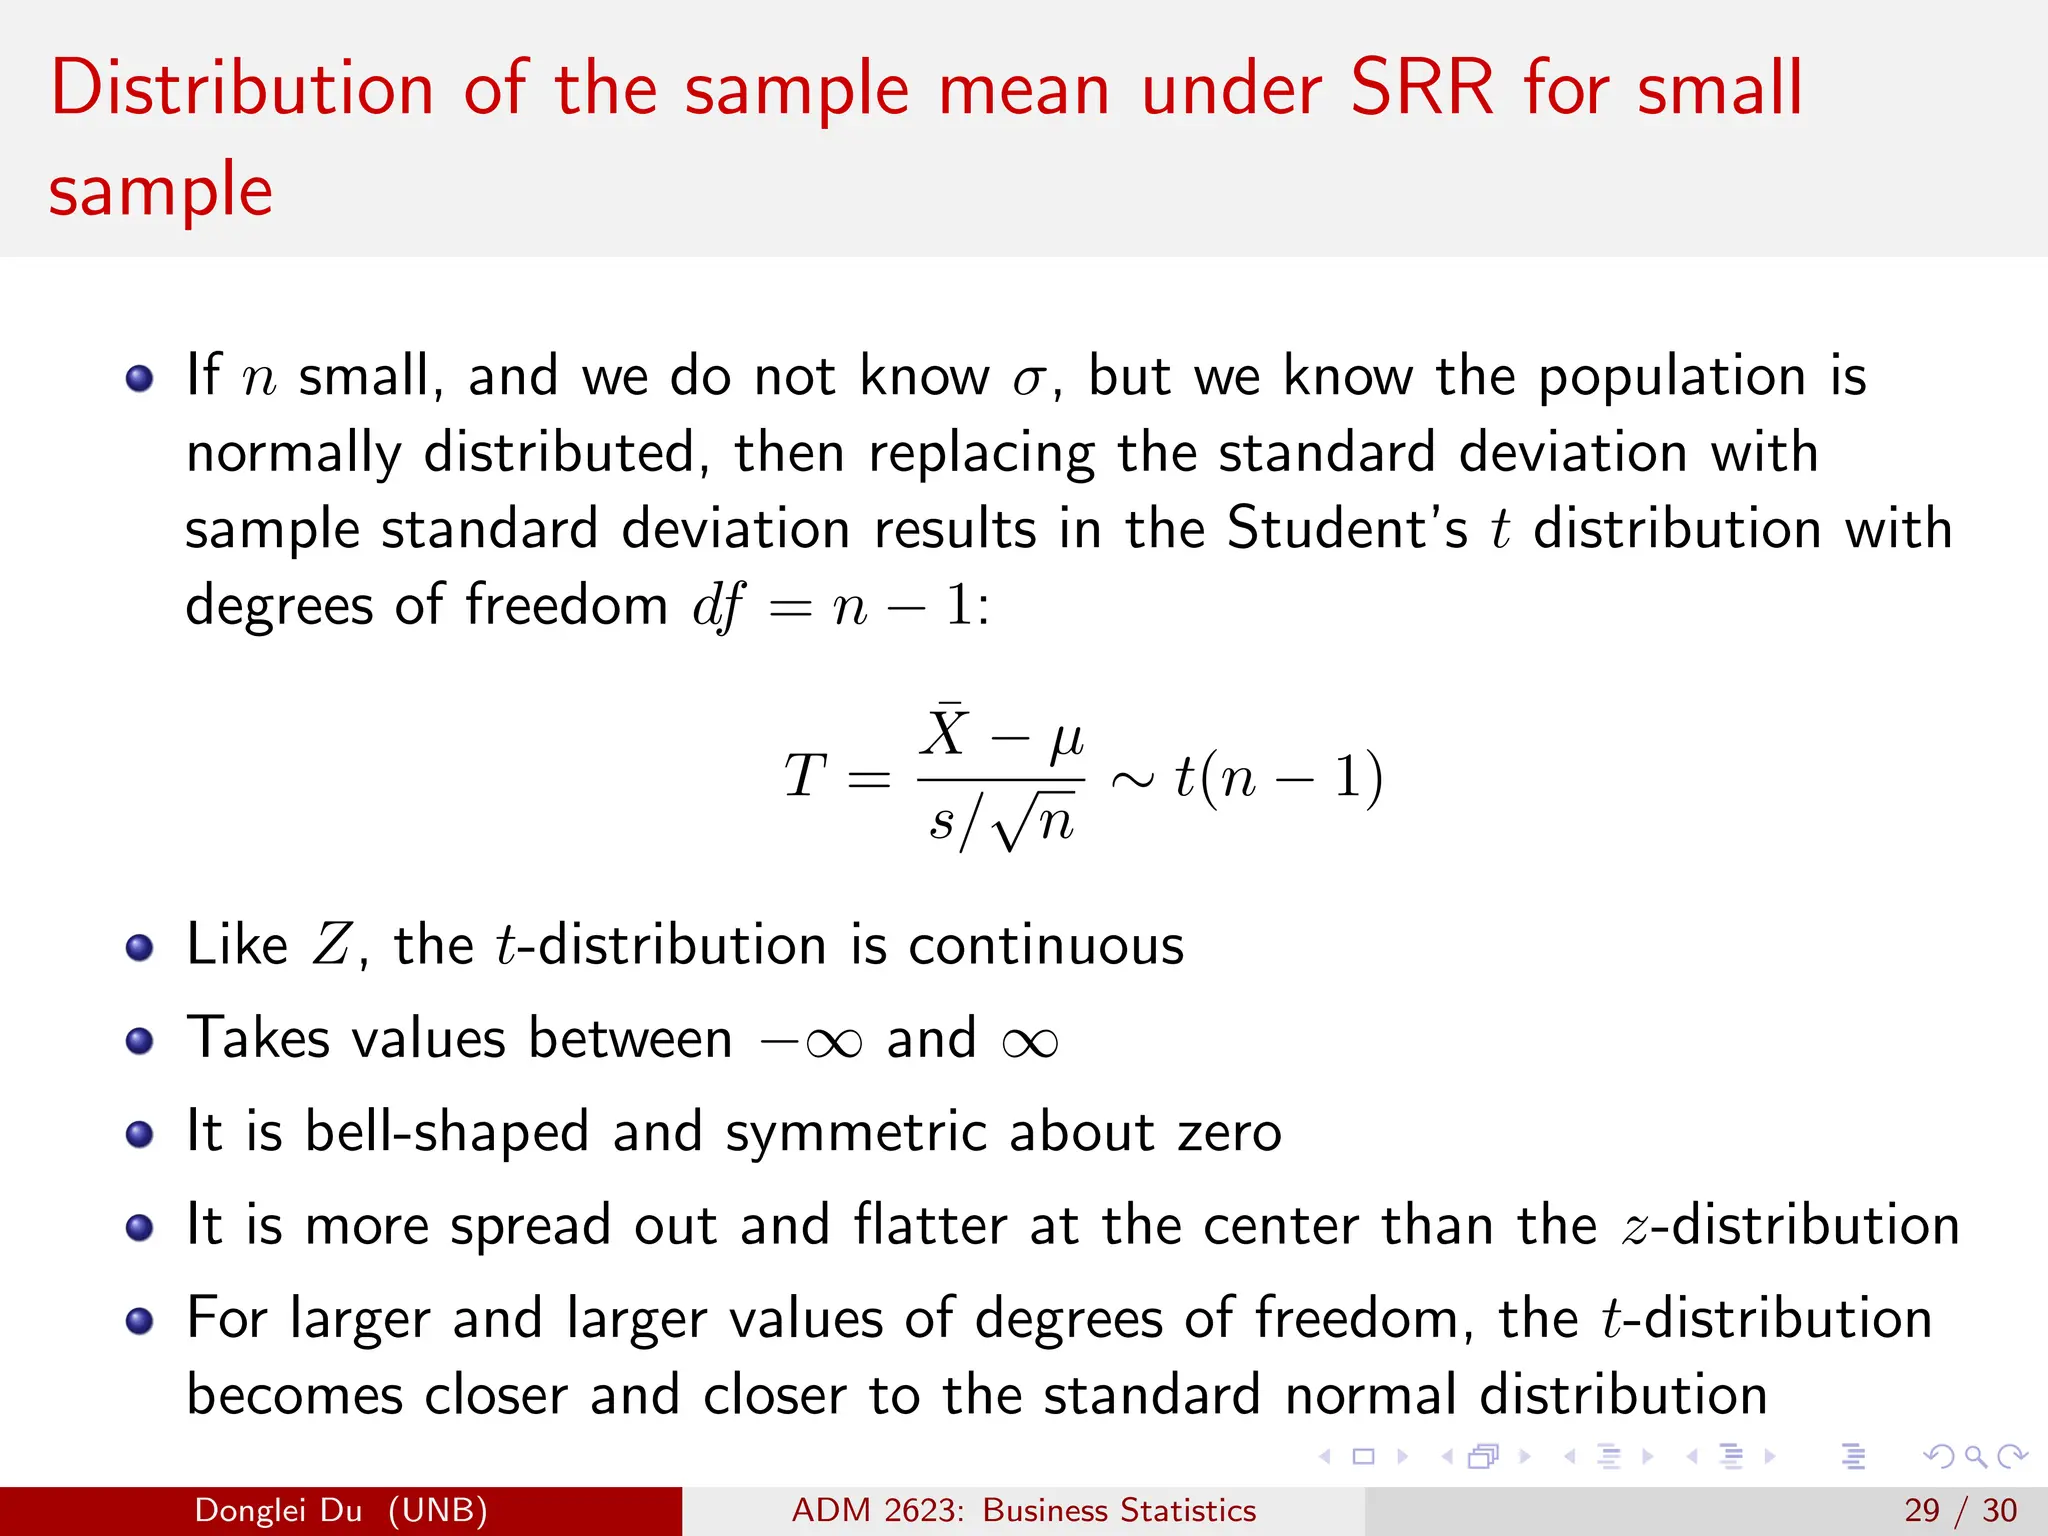
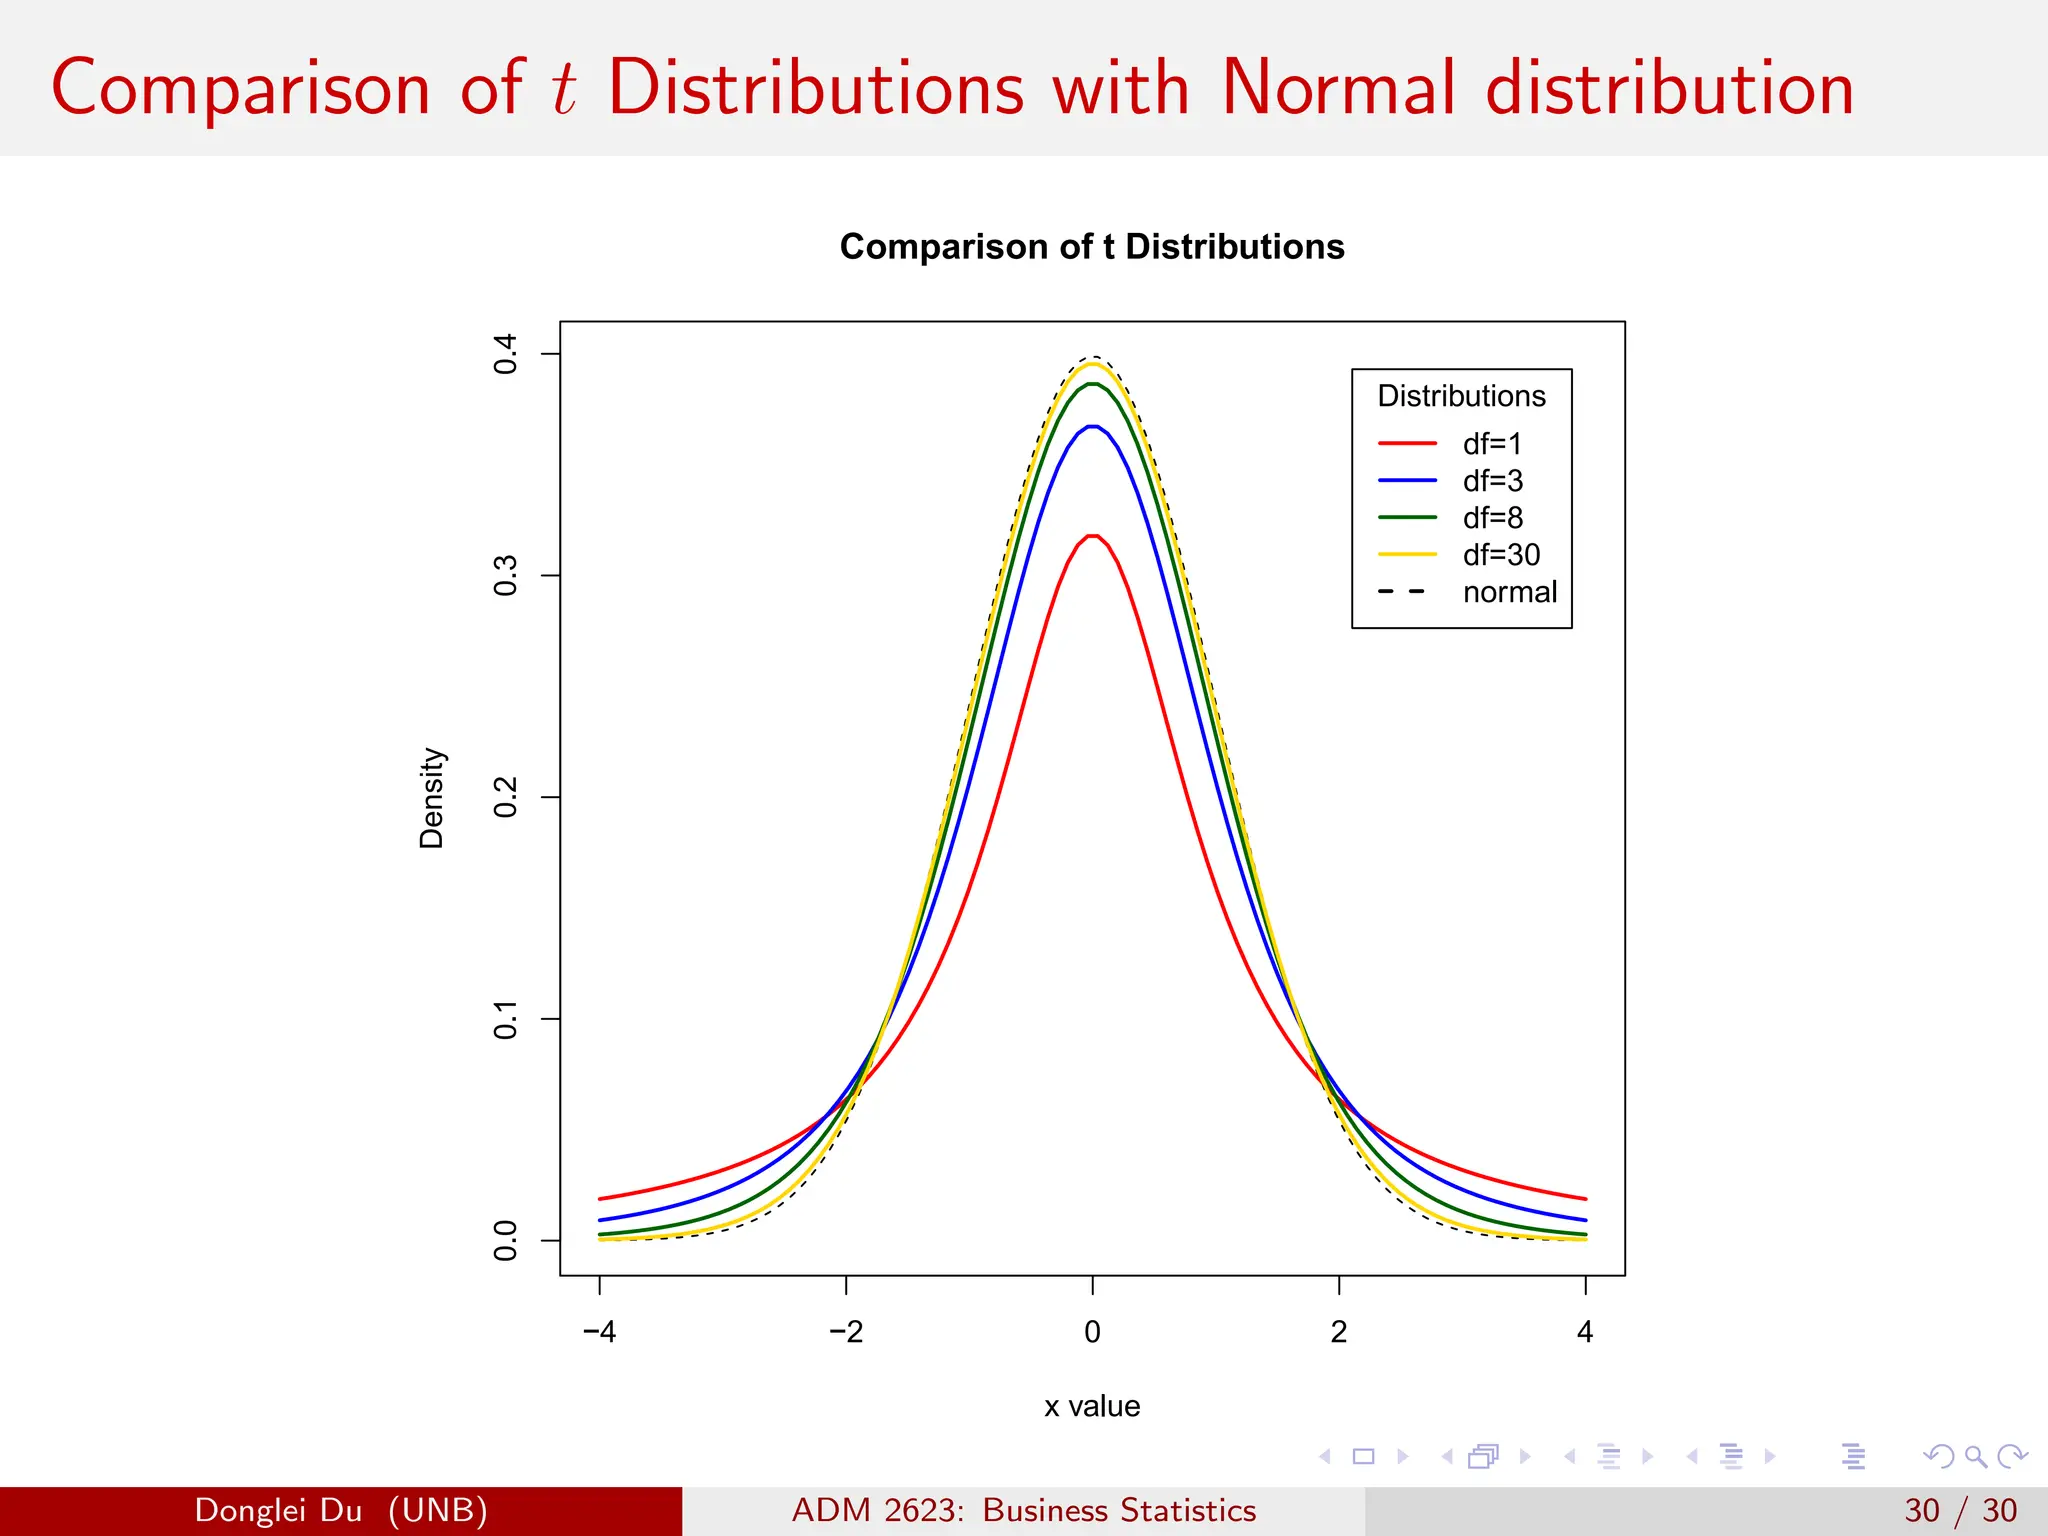
The document discusses various sampling methods used in statistics including probability and non-probability sampling, sampling with and without replacement, simple random sampling, stratified random sampling, and cluster random sampling. It provides examples of how to implement simple random sampling with and without replacement in R code. Key concepts covered include sampling error versus non-sampling error and the sampling distribution and central limit theorem as they apply to the sample mean under simple random sampling with replacement.
Data reduction: breaking down large sets of data into more-manageable groups or segments that provide better insight.
- Data sampling
- Data cleaning
- Data transformation
- Data segmentation
- Dimension reduction
Data reduction: breaking down large sets of data into more-manageable groups or segments that provide better insight.
- Data sampling
- Data cleaning
- Data transformation
- Data segmentation
- Dimension reduction
PREDICTING CLASS-IMBALANCED BUSINESS RISK USING RESAMPLING, REGULARIZATION, A...IJMIT JOURNAL
We aim at developing and improving the imbalanced business risk modeling via jointly using proper evaluation criteria, resampling, cross-validation, classifier regularization, and ensembling techniques. Area Under the Receiver Operating Characteristic Curve (AUC of ROC) is used for model comparison based on 10-fold cross validation. Two undersampling strategies including random undersampling (RUS) and cluster centroid undersampling (CCUS), as well as two oversampling methods including random oversampling (ROS) and Synthetic Minority Oversampling Technique (SMOTE), are applied. Three highly interpretable classifiers, including logistic regression without regularization (LR), L1-regularized LR (L1LR), and decision tree (DT) are implemented. Two ensembling techniques, including Bagging and Boosting, are applied on the DT classifier for further model improvement. The results show that, Boosting on DT by using the oversampled data containing 50% positives via SMOTE is the optimal model and it can achieve AUC, recall, and F1 score valued 0.8633, 0.9260, and 0.8907, respectively.
PREDICTING CLASS-IMBALANCED BUSINESS RISK USING RESAMPLING, REGULARIZATION, A...IJMIT JOURNAL
We aim at developing and improving the imbalanced business risk modeling via jointly using proper
evaluation criteria, resampling, cross-validation, classifier regularization, and ensembling techniques.
Area Under the Receiver Operating Characteristic Curve (AUC of ROC) is used for model comparison
based on 10-fold cross validation. Two undersampling strategies including random undersampling (RUS)
and cluster centroid undersampling (CCUS), as well as two oversampling methods including random
oversampling (ROS) and Synthetic Minority Oversampling Technique (SMOTE), are applied. Three highly
interpretable classifiers, including logistic regression without regularization (LR), L1-regularized LR
(L1LR), and decision tree (DT) are implemented. Two ensembling techniques, including Bagging and
Boosting, are applied on the DT classifier for further model improvement. The results show that, Boosting
on DT by using the oversampled data containing 50% positives via SMOTE is the optimal model and it can
achieve AUC, recall, and F1 score valued 0.8633, 0.9260, and 0.8907, respectively.
This PPT will give details about
Sampling Introduction
Types of Probability Sampling
Types of Non-Probability Sampling
Sampling Frame
Determination of Sample Size
Link for other units are provided below .Kindly check that also
Unit-I
https://www2.slideshare.net/ManojKumar730/research-methodology-unitiresearch-and-its-various-process
Unit-II
https://www2.slideshare.net/ManojKumar730/research-methodology-unit-iidata-collection
Unit-iii
https://www2.slideshare.net/ManojKumar730/research-methodlogy-unitiiisampling
Unit-IV
https://www2.slideshare.net/ManojKumar730/research-methodlogy-unitivmeasurement-and-data-preperationfor-bbabcommba-and-for-other-ug-and-pg-students
Unit-V
https://www2.slideshare.net/ManojKumar730/research-methodlogy-unitvreseach-report-for-bcom-bba-mba-and-other-ug-and-pg-courses
The European Unemployment Puzzle: implications from population agingGRAPE
We study the link between the evolving age structure of the working population and unemployment. We build a large new Keynesian OLG model with a realistic age structure, labor market frictions, sticky prices, and aggregate shocks. Once calibrated to the European economy, we quantify the extent to which demographic changes over the last three decades have contributed to the decline of the unemployment rate. Our findings yield important implications for the future evolution of unemployment given the anticipated further aging of the working population in Europe. We also quantify the implications for optimal monetary policy: lowering inflation volatility becomes less costly in terms of GDP and unemployment volatility, which hints that optimal monetary policy may be more hawkish in an aging society. Finally, our results also propose a partial reversal of the European-US unemployment puzzle due to the fact that the share of young workers is expected to remain robust in the US.
US Economic Outlook - Being Decided - M Capital Group August 2021.pdfpchutichetpong
The U.S. economy is continuing its impressive recovery from the COVID-19 pandemic and not slowing down despite re-occurring bumps. The U.S. savings rate reached its highest ever recorded level at 34% in April 2020 and Americans seem ready to spend. The sectors that had been hurt the most by the pandemic specifically reduced consumer spending, like retail, leisure, hospitality, and travel, are now experiencing massive growth in revenue and job openings.
Could this growth lead to a “Roaring Twenties”? As quickly as the U.S. economy contracted, experiencing a 9.1% drop in economic output relative to the business cycle in Q2 2020, the largest in recorded history, it has rebounded beyond expectations. This surprising growth seems to be fueled by the U.S. government’s aggressive fiscal and monetary policies, and an increase in consumer spending as mobility restrictions are lifted. Unemployment rates between June 2020 and June 2021 decreased by 5.2%, while the demand for labor is increasing, coupled with increasing wages to incentivize Americans to rejoin the labor force. Schools and businesses are expected to fully reopen soon. In parallel, vaccination rates across the country and the world continue to rise, with full vaccination rates of 50% and 14.8% respectively.
However, it is not completely smooth sailing from here. According to M Capital Group, the main risks that threaten the continued growth of the U.S. economy are inflation, unsettled trade relations, and another wave of Covid-19 mutations that could shut down the world again. Have we learned from the past year of COVID-19 and adapted our economy accordingly?
“In order for the U.S. economy to continue growing, whether there is another wave or not, the U.S. needs to focus on diversifying supply chains, supporting business investment, and maintaining consumer spending,” says Grace Feeley, a research analyst at M Capital Group.
While the economic indicators are positive, the risks are coming closer to manifesting and threatening such growth. The new variants spreading throughout the world, Delta, Lambda, and Gamma, are vaccine-resistant and muddy the predictions made about the economy and health of the country. These variants bring back the feeling of uncertainty that has wreaked havoc not only on the stock market but the mindset of people around the world. MCG provides unique insight on how to mitigate these risks to possibly ensure a bright economic future.
More Related Content
Similar to Lecture8_student.pdf kyjg; dfxzthnbmnuyjb
PREDICTING CLASS-IMBALANCED BUSINESS RISK USING RESAMPLING, REGULARIZATION, A...IJMIT JOURNAL
We aim at developing and improving the imbalanced business risk modeling via jointly using proper evaluation criteria, resampling, cross-validation, classifier regularization, and ensembling techniques. Area Under the Receiver Operating Characteristic Curve (AUC of ROC) is used for model comparison based on 10-fold cross validation. Two undersampling strategies including random undersampling (RUS) and cluster centroid undersampling (CCUS), as well as two oversampling methods including random oversampling (ROS) and Synthetic Minority Oversampling Technique (SMOTE), are applied. Three highly interpretable classifiers, including logistic regression without regularization (LR), L1-regularized LR (L1LR), and decision tree (DT) are implemented. Two ensembling techniques, including Bagging and Boosting, are applied on the DT classifier for further model improvement. The results show that, Boosting on DT by using the oversampled data containing 50% positives via SMOTE is the optimal model and it can achieve AUC, recall, and F1 score valued 0.8633, 0.9260, and 0.8907, respectively.
PREDICTING CLASS-IMBALANCED BUSINESS RISK USING RESAMPLING, REGULARIZATION, A...IJMIT JOURNAL
We aim at developing and improving the imbalanced business risk modeling via jointly using proper
evaluation criteria, resampling, cross-validation, classifier regularization, and ensembling techniques.
Area Under the Receiver Operating Characteristic Curve (AUC of ROC) is used for model comparison
based on 10-fold cross validation. Two undersampling strategies including random undersampling (RUS)
and cluster centroid undersampling (CCUS), as well as two oversampling methods including random
oversampling (ROS) and Synthetic Minority Oversampling Technique (SMOTE), are applied. Three highly
interpretable classifiers, including logistic regression without regularization (LR), L1-regularized LR
(L1LR), and decision tree (DT) are implemented. Two ensembling techniques, including Bagging and
Boosting, are applied on the DT classifier for further model improvement. The results show that, Boosting
on DT by using the oversampled data containing 50% positives via SMOTE is the optimal model and it can
achieve AUC, recall, and F1 score valued 0.8633, 0.9260, and 0.8907, respectively.
This PPT will give details about
Sampling Introduction
Types of Probability Sampling
Types of Non-Probability Sampling
Sampling Frame
Determination of Sample Size
Link for other units are provided below .Kindly check that also
Unit-I
https://www2.slideshare.net/ManojKumar730/research-methodology-unitiresearch-and-its-various-process
Unit-II
https://www2.slideshare.net/ManojKumar730/research-methodology-unit-iidata-collection
Unit-iii
https://www2.slideshare.net/ManojKumar730/research-methodlogy-unitiiisampling
Unit-IV
https://www2.slideshare.net/ManojKumar730/research-methodlogy-unitivmeasurement-and-data-preperationfor-bbabcommba-and-for-other-ug-and-pg-students
Unit-V
https://www2.slideshare.net/ManojKumar730/research-methodlogy-unitvreseach-report-for-bcom-bba-mba-and-other-ug-and-pg-courses
The European Unemployment Puzzle: implications from population agingGRAPE
We study the link between the evolving age structure of the working population and unemployment. We build a large new Keynesian OLG model with a realistic age structure, labor market frictions, sticky prices, and aggregate shocks. Once calibrated to the European economy, we quantify the extent to which demographic changes over the last three decades have contributed to the decline of the unemployment rate. Our findings yield important implications for the future evolution of unemployment given the anticipated further aging of the working population in Europe. We also quantify the implications for optimal monetary policy: lowering inflation volatility becomes less costly in terms of GDP and unemployment volatility, which hints that optimal monetary policy may be more hawkish in an aging society. Finally, our results also propose a partial reversal of the European-US unemployment puzzle due to the fact that the share of young workers is expected to remain robust in the US.
US Economic Outlook - Being Decided - M Capital Group August 2021.pdfpchutichetpong
The U.S. economy is continuing its impressive recovery from the COVID-19 pandemic and not slowing down despite re-occurring bumps. The U.S. savings rate reached its highest ever recorded level at 34% in April 2020 and Americans seem ready to spend. The sectors that had been hurt the most by the pandemic specifically reduced consumer spending, like retail, leisure, hospitality, and travel, are now experiencing massive growth in revenue and job openings.
Could this growth lead to a “Roaring Twenties”? As quickly as the U.S. economy contracted, experiencing a 9.1% drop in economic output relative to the business cycle in Q2 2020, the largest in recorded history, it has rebounded beyond expectations. This surprising growth seems to be fueled by the U.S. government’s aggressive fiscal and monetary policies, and an increase in consumer spending as mobility restrictions are lifted. Unemployment rates between June 2020 and June 2021 decreased by 5.2%, while the demand for labor is increasing, coupled with increasing wages to incentivize Americans to rejoin the labor force. Schools and businesses are expected to fully reopen soon. In parallel, vaccination rates across the country and the world continue to rise, with full vaccination rates of 50% and 14.8% respectively.
However, it is not completely smooth sailing from here. According to M Capital Group, the main risks that threaten the continued growth of the U.S. economy are inflation, unsettled trade relations, and another wave of Covid-19 mutations that could shut down the world again. Have we learned from the past year of COVID-19 and adapted our economy accordingly?
“In order for the U.S. economy to continue growing, whether there is another wave or not, the U.S. needs to focus on diversifying supply chains, supporting business investment, and maintaining consumer spending,” says Grace Feeley, a research analyst at M Capital Group.
While the economic indicators are positive, the risks are coming closer to manifesting and threatening such growth. The new variants spreading throughout the world, Delta, Lambda, and Gamma, are vaccine-resistant and muddy the predictions made about the economy and health of the country. These variants bring back the feeling of uncertainty that has wreaked havoc not only on the stock market but the mindset of people around the world. MCG provides unique insight on how to mitigate these risks to possibly ensure a bright economic future.
Empowering the Unbanked: The Vital Role of NBFCs in Promoting Financial Inclu...Vighnesh Shashtri
In India, financial inclusion remains a critical challenge, with a significant portion of the population still unbanked. Non-Banking Financial Companies (NBFCs) have emerged as key players in bridging this gap by providing financial services to those often overlooked by traditional banking institutions. This article delves into how NBFCs are fostering financial inclusion and empowering the unbanked.
how to sell pi coins in all Africa Countries.DOT TECH
Yes. You can sell your pi network for other cryptocurrencies like Bitcoin, usdt , Ethereum and other currencies And this is done easily with the help from a pi merchant.
What is a pi merchant ?
Since pi is not launched yet in any exchange. The only way you can sell right now is through merchants.
A verified Pi merchant is someone who buys pi network coins from miners and resell them to investors looking forward to hold massive quantities of pi coins before mainnet launch in 2026.
I will leave the telegram contact of my personal pi merchant to trade with.
@Pi_vendor_247
Poonawalla Fincorp and IndusInd Bank Introduce New Co-Branded Credit Cardnickysharmasucks
The unveiling of the IndusInd Bank Poonawalla Fincorp eLITE RuPay Platinum Credit Card marks a notable milestone in the Indian financial landscape, showcasing a successful partnership between two leading institutions, Poonawalla Fincorp and IndusInd Bank. This co-branded credit card not only offers users a plethora of benefits but also reflects a commitment to innovation and adaptation. With a focus on providing value-driven and customer-centric solutions, this launch represents more than just a new product—it signifies a step towards redefining the banking experience for millions. Promising convenience, rewards, and a touch of luxury in everyday financial transactions, this collaboration aims to cater to the evolving needs of customers and set new standards in the industry.
Turin Startup Ecosystem 2024 - Ricerca sulle Startup e il Sistema dell'Innov...Quotidiano Piemontese
Turin Startup Ecosystem 2024
Una ricerca de il Club degli Investitori, in collaborazione con ToTeM Torino Tech Map e con il supporto della ESCP Business School e di Growth Capital
Exploring Abhay Bhutada’s Views After Poonawalla Fincorp’s Collaboration With...beulahfernandes8
The financial landscape in India has witnessed a significant development with the recent collaboration between Poonawalla Fincorp and IndusInd Bank.
The launch of the co-branded credit card, the IndusInd Bank Poonawalla Fincorp eLITE RuPay Platinum Credit Card, marks a major milestone for both entities.
This strategic move aims to redefine and elevate the banking experience for customers.
Currently pi network is not tradable on binance or any other exchange because we are still in the enclosed mainnet.
Right now the only way to sell pi coins is by trading with a verified merchant.
What is a pi merchant?
A pi merchant is someone verified by pi network team and allowed to barter pi coins for goods and services.
Since pi network is not doing any pre-sale The only way exchanges like binance/huobi or crypto whales can get pi is by buying from miners. And a merchant stands in between the exchanges and the miners.
I will leave the telegram contact of my personal pi merchant. I and my friends has traded more than 6000pi coins successfully
Tele-gram
@Pi_vendor_247
where can I find a legit pi merchant onlineDOT TECH
Yes. This is very easy what you need is a recommendation from someone who has successfully traded pi coins before with a merchant.
Who is a pi merchant?
A pi merchant is someone who buys pi network coins and resell them to Investors looking forward to hold thousands of pi coins before the open mainnet.
I will leave the telegram contact of my personal pi merchant to trade with
@Pi_vendor_247
how to sell pi coins at high rate quickly.DOT TECH
Where can I sell my pi coins at a high rate.
Pi is not launched yet on any exchange. But one can easily sell his or her pi coins to investors who want to hold pi till mainnet launch.
This means crypto whales want to hold pi. And you can get a good rate for selling pi to them. I will leave the telegram contact of my personal pi vendor below.
A vendor is someone who buys from a miner and resell it to a holder or crypto whale.
Here is the telegram contact of my vendor:
@Pi_vendor_247
What price will pi network be listed on exchangesDOT TECH
The rate at which pi will be listed is practically unknown. But due to speculations surrounding it the predicted rate is tends to be from 30$ — 50$.
So if you are interested in selling your pi network coins at a high rate tho. Or you can't wait till the mainnet launch in 2026. You can easily trade your pi coins with a merchant.
A merchant is someone who buys pi coins from miners and resell them to Investors looking forward to hold massive quantities till mainnet launch.
I will leave the telegram contact of my personal pi vendor to trade with.
@Pi_vendor_247
Webinar Exploring DORA for Fintechs - Simont Braun
Lecture8_student.pdf kyjg; dfxzthnbmnuyjb
1. Lecture 8: Sampling Methods
Donglei Du
(ddu@unb.edu)
Faculty of Business Administration, University of New Brunswick, NB Canada Fredericton
E3B 9Y2
Donglei Du (UNB) ADM 2623: Business Statistics 1 / 30
2. Table of contents
1 Sampling Methods
Why Sampling
Probability vs non-probability sampling methods
Sampling with replacement vs without replacement
Random Sampling Methods
2 Simple random sampling with and without replacement
Simple random sampling without replacement
Simple random sampling with replacement
3 Sampling error vs non-sampling error
4 Sampling distribution of sample statistic
Histogram of the sample mean under SRR
5 Distribution of the sample mean under SRR: The central limit theorem
Donglei Du (UNB) ADM 2623: Business Statistics 2 / 30
3. Layout
1 Sampling Methods
Why Sampling
Probability vs non-probability sampling methods
Sampling with replacement vs without replacement
Random Sampling Methods
2 Simple random sampling with and without replacement
Simple random sampling without replacement
Simple random sampling with replacement
3 Sampling error vs non-sampling error
4 Sampling distribution of sample statistic
Histogram of the sample mean under SRR
5 Distribution of the sample mean under SRR: The central limit theorem
Donglei Du (UNB) ADM 2623: Business Statistics 3 / 30
4. Why sampling?
The physical impossibility of checking all items in the population,
and, also, it would be too time-consuming
The studying of all the items in a population would not be cost
effective
The sample results are usually adequate
The destructive nature of certain tests
Donglei Du (UNB) ADM 2623: Business Statistics 4 / 30
5. Sampling Methods
Probability Sampling: Each data unit in the population has a known
likelihood of being included in the sample.
Non-probability Sampling: Does not involve random selection;
inclusion of an item is based on convenience
Donglei Du (UNB) ADM 2623: Business Statistics 5 / 30
6. Sampling Methods
Sampling with replacement: Each data unit in the population is
allowed to appear in the sample more than once.
Sampling without replacement: Each data unit in the population is
allowed to appear in the sample no more than once.
Donglei Du (UNB) ADM 2623: Business Statistics 6 / 30
7. Random Sampling Methods
Most commonly used probability/random sampling techniques are
Simple random sampling
Stratified random sampling
Cluster random sampling
Donglei Du (UNB) ADM 2623: Business Statistics 7 / 30
11. Layout
1 Sampling Methods
Why Sampling
Probability vs non-probability sampling methods
Sampling with replacement vs without replacement
Random Sampling Methods
2 Simple random sampling with and without replacement
Simple random sampling without replacement
Simple random sampling with replacement
3 Sampling error vs non-sampling error
4 Sampling distribution of sample statistic
Histogram of the sample mean under SRR
5 Distribution of the sample mean under SRR: The central limit theorem
Donglei Du (UNB) ADM 2623: Business Statistics 11 / 30
12. Simple random sampling without replacement (SRN)
Repeat the following process until the requested sample is obtained:
Randomly (with equal probability) select an item, record it, and discard
it
Example: draw cards one by one from a deck without replacement.
This technique is the simplest and most often used sampling
technique in practice.
Donglei Du (UNB) ADM 2623: Business Statistics 12 / 30
13. R code
Given a population of size N, choose a sample of size n using SRN
> N<-5
> n<-2
> sample(1:N, n, replace=FALSE)
Donglei Du (UNB) ADM 2623: Business Statistics 13 / 30
14. Simple random sampling with replacement (SRR)
Repeat the following process until the requested sample is obtained:
Randomly (with equal probability) select an item, record it, and replace
it
Example: draw cards one by one from a deck with replacement.
This is rarely used in practice, since there is no meaning to include
the same item more than once.
However, it is preferred from a theoretical point of view, since
It is easy to analyze mathematically.
Moreover, SRR is a very good approximation for SRN when N is large.
Donglei Du (UNB) ADM 2623: Business Statistics 14 / 30
15. R code
Given a population {1, . . . , N} of size N, choose a sample of size n
using SRR
> N<-5
> n<-2
> sample(1:N, n, replace=TRUE)
Donglei Du (UNB) ADM 2623: Business Statistics 15 / 30
16. Layout
1 Sampling Methods
Why Sampling
Probability vs non-probability sampling methods
Sampling with replacement vs without replacement
Random Sampling Methods
2 Simple random sampling with and without replacement
Simple random sampling without replacement
Simple random sampling with replacement
3 Sampling error vs non-sampling error
4 Sampling distribution of sample statistic
Histogram of the sample mean under SRR
5 Distribution of the sample mean under SRR: The central limit theorem
Donglei Du (UNB) ADM 2623: Business Statistics 16 / 30
17. Sampling error vs non-sampling error
Sampling error: the difference between a sample statistic and its
corresponding population parameter. This error is inherent in
The sampling process (since sample is only part of the population)
The choice of statistics (since a statistics is computed based on the
sample).
Non-sample Error: This error has no relationship to the sampling
technique or the estimator. The main reasons are human-related
data recording
non-response
sample selection
Donglei Du (UNB) ADM 2623: Business Statistics 17 / 30
18. Layout
1 Sampling Methods
Why Sampling
Probability vs non-probability sampling methods
Sampling with replacement vs without replacement
Random Sampling Methods
2 Simple random sampling with and without replacement
Simple random sampling without replacement
Simple random sampling with replacement
3 Sampling error vs non-sampling error
4 Sampling distribution of sample statistic
Histogram of the sample mean under SRR
5 Distribution of the sample mean under SRR: The central limit theorem
Donglei Du (UNB) ADM 2623: Business Statistics 18 / 30
19. Sampling distribution of sample statistic
Sampling distribution of sample statistic: The probability distribution
consisting of all possible sample statistics of a given sample size
selected from a population using one probability sampling.
Example: we can consider the sampling distribution of the sample
mean, sample variance etc.
Donglei Du (UNB) ADM 2623: Business Statistics 19 / 30
20. An example of the sampling distribution of sample mean
under SRR
Consider a small population {1, 2, 3, 4, 5} with size N = 5. Let us
randomly choose a sample of size n = 2 via SRR.
It is understood that sample is ordered. Then there are
Nn = 52 = 25 possible samples; namely
sample x̄ sample x̄ sample x̄ sample x̄ sample x̄
(1,1) 1 (2,1) 1.5 (3,1) 2 (4,1) 2.5 (5,1) 3
(1,2) 1.5 (2,2) 2 (3,2) 2.5 (4,2) 3 (5,2) 3.5
(1,3) 2 (2,3) 2.5 (3,3) 3 (4,3) 3.5 (5,1) 4
(1,4) 2.5 (2,4) 3 (3,4) 3.5 (4,4) 4 (5,1) 4.5
(1,5) 3 (2,5) 3.5 (3,5) 4 (4,5) 4.5 (5,1) 5
Donglei Du (UNB) ADM 2623: Business Statistics 20 / 30
21. An example of the sampling distribution of sample mean
under SRR
Let us find the sampling distribution of the sample mean:
X̄ Probability
1 1/25
1.5 2/25
2 3/25
2.5 4/25
3 5/25
3.5 4/25
4 3/25
4.5 2/25
5 1/25
Donglei Du (UNB) ADM 2623: Business Statistics 21 / 30
22. The mean and variance of the sample mean under SRR
Let us find the mean and variance of the sampling distribution of the
sample mean:
X̄ P(X̄) X̄P(X̄) X̄2P(X̄)
1 1/25 1/25 1/25
1.5 2/25 3/25 4.5/25
2 3/25 6/25 12/25
2.5 4/25 10/25 25/25
3 5/25 15/25 45/25
3.5 4/25 14/25 49/25
4 3/25 12/25 48/25
4.5 2/25 9/25 40.5/25
5 1/25 5/25 25/25
75/25=3 250/25=10
Donglei Du (UNB) ADM 2623: Business Statistics 22 / 30
23. The mean and variance of the sample mean under SRR
So the mean and variance of the sample mean are given as
x̄ = 3
s2
= 10 − 32
= 1
On the other hand, the population mean and variance are given as
µ =
1 + 2 . . . + 5
5
= 3
σ2
=
55 − 152
5
5
= 2
Donglei Du (UNB) ADM 2623: Business Statistics 23 / 30
24. Relationship between sample and population mean and
variance under SRR
So from this example
x̄ = µ = 3
s2
=
σ2
2
=
2
2
= 1
The above relationship is true for any population of size N and
sample of size n
x̄ = µ
s2
=
σ2
n
Donglei Du (UNB) ADM 2623: Business Statistics 24 / 30
25. Distribution of the sample mean under SRR
Let us look the histogram of the sample mean in the above example.
Histogram of x
x
Frequency
1 2 3 4 5
0
1
2
3
4
5
Donglei Du (UNB) ADM 2623: Business Statistics 25 / 30
26. Distribution of the sample mean under SRR for various
population
Let us look the histogram of the sample mean for various population.
Donglei Du (UNB) ADM 2623: Business Statistics 26 / 30
27. Layout
1 Sampling Methods
Why Sampling
Probability vs non-probability sampling methods
Sampling with replacement vs without replacement
Random Sampling Methods
2 Simple random sampling with and without replacement
Simple random sampling without replacement
Simple random sampling with replacement
3 Sampling error vs non-sampling error
4 Sampling distribution of sample statistic
Histogram of the sample mean under SRR
5 Distribution of the sample mean under SRR: The central limit theorem
Donglei Du (UNB) ADM 2623: Business Statistics 27 / 30
28. Distribution of the sample mean under SRR: The central
limit theorem
The central limit theorem: The sampling distribution of the means
of all possible samples of size n generated from the population using
SRR will be approximately normally distributed when n goes to
infinity.
X̄ − µ
σ/
√
n
∼ N(0, 1)
How large should n be for the sampling mean distribution to be
approximately normal?
In practice, n ≥ 30
If n large, and we do not know σ, then we can use sample standard
deviation instead. Then Central Limit Theorem is still true!
Donglei Du (UNB) ADM 2623: Business Statistics 28 / 30
29. Distribution of the sample mean under SRR for small
sample
If n small, and we do not know σ, but we know the population is
normally distributed, then replacing the standard deviation with
sample standard deviation results in the Student’s t distribution with
degrees of freedom df = n − 1:
T =
X̄ − µ
s/
√
n
∼ t(n − 1)
Like Z, the t-distribution is continuous
Takes values between −∞ and ∞
It is bell-shaped and symmetric about zero
It is more spread out and flatter at the center than the z-distribution
For larger and larger values of degrees of freedom, the t-distribution
becomes closer and closer to the standard normal distribution
Donglei Du (UNB) ADM 2623: Business Statistics 29 / 30
30. Comparison of t Distributions with Normal distribution
−4 −2 0 2 4
0.0
0.1
0.2
0.3
0.4
Comparison of t Distributions
x value
Density
Distributions
df=1
df=3
df=8
df=30
normal
Donglei Du (UNB) ADM 2623: Business Statistics 30 / 30