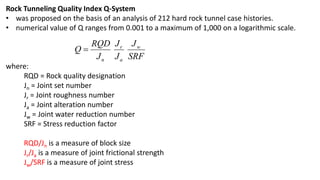
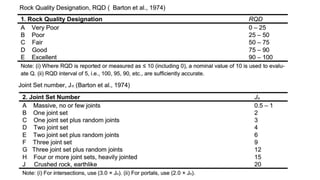
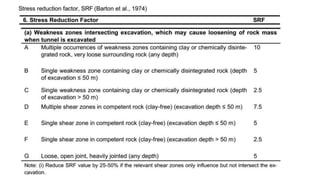
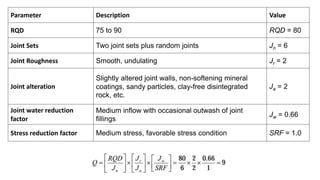
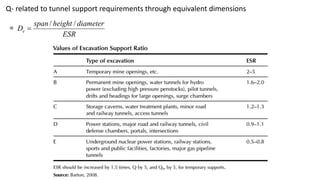
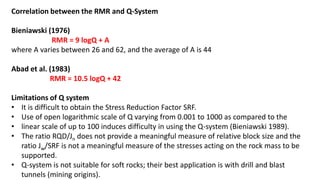
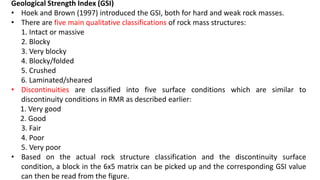
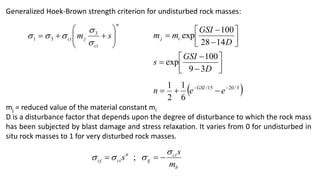
Rock Mechanics Subject Code: CE6130
Lecture
Rock Mass Classification
Intact Rock Classification
• Geological Classification
• Engineering Classification
• Deer-Miller Classification
Rock Mass Classification
• Terzaghi rock load classification (1946)
• Stand up time classification (1958)
• Rock Quality Designation (1964)
Engineering classification for rock masses
• Rock Structure Rating, 1972 (RSR)
• Rock Mass rating (RMR)
• Q-System
• Classification System for design of tunnels
• Geological Strength Index (GSI)
Rock Tunneling Quality Index Q-System
• was proposed on the basis of an analysis of 212 hard rock tunnel case histories.
• numerical value of Q ranges from 0.001 to a maximum of 1,000 on a logarithmic scale.
where:
RQD = Rock quality designation
Jn = Joint set number
Jr = Joint roughness number
Ja = Joint alteration number
Jw = Joint water reduction number
SRF = Stress reduction factor
RQD/Jn is a measure of block size
Jr/Ja is a measure of joint frictional strength
Jw/SRF is a measure of joint stress
SRF
J
J
J
J
RQD
Q w
a
r
n

Parameter Description Value
RQD 75 to 90 RQD = 80
Joint Sets Two joint sets plus random joints Jn = 6
Joint Roughness Smooth, undulating Jr = 2
Joint alteration
Slightly altered joint walls, non-softening mineral
coatings, sandy particles, clay-free disintegrated
rock, etc.
Ja = 2
Joint water reduction
factor
Medium inflow with occasional outwash of joint
fillings
Jw = 0.66
Stress reduction factor Medium stress, favorable stress condition SRF = 1.0
Application of Q-System
• Empirical correlations
= ultimate roof pressure (MPa)
= ultimate wall support pressure (MPa)
where:
Qw = wall factor
= 5 Q --------Q > 10
= 2.5 Q --------0.1 < Q < 10
= Q --------Q < 0.1
3
1
2
.
0 








 Q
J
P
r
v
3
1
2
.
0 








 w
r
h Q
J
P
Q- related to tunnel support requirements through equivalent dimensions
=
ESR
diameter
height
span
De
/
/

Correlation between the RMR and Q-System
Bieniawski (1976)
RMR = 9 logQ + A
where A varies between 26 and 62, and the average of A is 44
Abad et al. (1983)
RMR = 10.5 logQ + 42
Limitations of Q system
• It is difficult to obtain the Stress Reduction Factor SRF.
• Use of open logarithmic scale of Q varying from 0.001 to 1000 as compared to the
• linear scale of up to 100 induces difficulty in using the Q-system (Bieniawski 1989).
• The ratio RQD/Jn does not provide a meaningful measure of relative block size and the
ratio Jw/SRF is not a meaningful measure of the stresses acting on the rock mass to be
supported.
• Q-system is not suitable for soft rocks; their best application is with drill and blast
tunnels (mining origins).
Geological Strength Index (GSI)
• Hoek and Brown (1997) introduced the GSI, both for hard and weak rock masses.
• There are five main qualitative classifications of rock mass structures:
1. Intact or massive
2. Blocky
3. Very blocky
4. Blocky/folded
5. Crushed
6. Laminated/sheared
• Discontinuities are classified into five surface conditions which are similar to
discontinuity conditions in RMR as described earlier:
1. Very good
2. Good
3. Fair
4. Poor
5. Very poor
• Based on the actual rock structure classification and the discontinuity surface
condition, a block in the 6x5 matrix can be picked up and the corresponding GSI value
can then be read from the figure.
Generalized Hoek-Brown strength criterion for undisturbed rock masses:
mj = reduced value of the material constant mi
D is a disturbance factor that depends upon the degree of disturbance to which the rock mass
has been subjected by blast damage and stress relaxation. It varies from 0 for undisturbed in
situ rock masses to 1 for very disturbed rock masses.
n
ci
j
ci s
m 














 3
3
1 








D
GSI
m
m i
j
14
28
100
exp









D
GSI
s
3
9
100
exp
 
3
/
20
15
/
6
1
2
1 



 e
e
n GSI
b
ci
tj
n
ci
cj
m
s
s



 

 ;
Lecture21_Rock Classification_06_feb2024.pptx

Lecture21_Rock Classification_06_feb2024.pptx

  • 1.
    Rock Mechanics SubjectCode: CE6130 Lecture Rock Mass Classification
  • 2.
    Intact Rock Classification •Geological Classification • Engineering Classification • Deer-Miller Classification Rock Mass Classification • Terzaghi rock load classification (1946) • Stand up time classification (1958) • Rock Quality Designation (1964) Engineering classification for rock masses • Rock Structure Rating, 1972 (RSR) • Rock Mass rating (RMR) • Q-System • Classification System for design of tunnels • Geological Strength Index (GSI)
  • 3.
    Rock Tunneling QualityIndex Q-System • was proposed on the basis of an analysis of 212 hard rock tunnel case histories. • numerical value of Q ranges from 0.001 to a maximum of 1,000 on a logarithmic scale. where: RQD = Rock quality designation Jn = Joint set number Jr = Joint roughness number Ja = Joint alteration number Jw = Joint water reduction number SRF = Stress reduction factor RQD/Jn is a measure of block size Jr/Ja is a measure of joint frictional strength Jw/SRF is a measure of joint stress SRF J J J J RQD Q w a r n 
  • 12.
    Parameter Description Value RQD75 to 90 RQD = 80 Joint Sets Two joint sets plus random joints Jn = 6 Joint Roughness Smooth, undulating Jr = 2 Joint alteration Slightly altered joint walls, non-softening mineral coatings, sandy particles, clay-free disintegrated rock, etc. Ja = 2 Joint water reduction factor Medium inflow with occasional outwash of joint fillings Jw = 0.66 Stress reduction factor Medium stress, favorable stress condition SRF = 1.0
  • 13.
    Application of Q-System •Empirical correlations = ultimate roof pressure (MPa) = ultimate wall support pressure (MPa) where: Qw = wall factor = 5 Q --------Q > 10 = 2.5 Q --------0.1 < Q < 10 = Q --------Q < 0.1 3 1 2 . 0           Q J P r v 3 1 2 . 0           w r h Q J P
  • 15.
    Q- related totunnel support requirements through equivalent dimensions = ESR diameter height span De / / 
  • 17.
    Correlation between theRMR and Q-System Bieniawski (1976) RMR = 9 logQ + A where A varies between 26 and 62, and the average of A is 44 Abad et al. (1983) RMR = 10.5 logQ + 42 Limitations of Q system • It is difficult to obtain the Stress Reduction Factor SRF. • Use of open logarithmic scale of Q varying from 0.001 to 1000 as compared to the • linear scale of up to 100 induces difficulty in using the Q-system (Bieniawski 1989). • The ratio RQD/Jn does not provide a meaningful measure of relative block size and the ratio Jw/SRF is not a meaningful measure of the stresses acting on the rock mass to be supported. • Q-system is not suitable for soft rocks; their best application is with drill and blast tunnels (mining origins).
  • 18.
    Geological Strength Index(GSI) • Hoek and Brown (1997) introduced the GSI, both for hard and weak rock masses. • There are five main qualitative classifications of rock mass structures: 1. Intact or massive 2. Blocky 3. Very blocky 4. Blocky/folded 5. Crushed 6. Laminated/sheared • Discontinuities are classified into five surface conditions which are similar to discontinuity conditions in RMR as described earlier: 1. Very good 2. Good 3. Fair 4. Poor 5. Very poor • Based on the actual rock structure classification and the discontinuity surface condition, a block in the 6x5 matrix can be picked up and the corresponding GSI value can then be read from the figure.
  • 26.
    Generalized Hoek-Brown strengthcriterion for undisturbed rock masses: mj = reduced value of the material constant mi D is a disturbance factor that depends upon the degree of disturbance to which the rock mass has been subjected by blast damage and stress relaxation. It varies from 0 for undisturbed in situ rock masses to 1 for very disturbed rock masses. n ci j ci s m                 3 3 1          D GSI m m i j 14 28 100 exp          D GSI s 3 9 100 exp   3 / 20 15 / 6 1 2 1      e e n GSI b ci tj n ci cj m s s        ;