Chapter 1: introduction
Overview:
•Network core: internet structure
• Performance: loss, delay, throughput
• Protocol layers, service models
Introduction: 1-2
3.
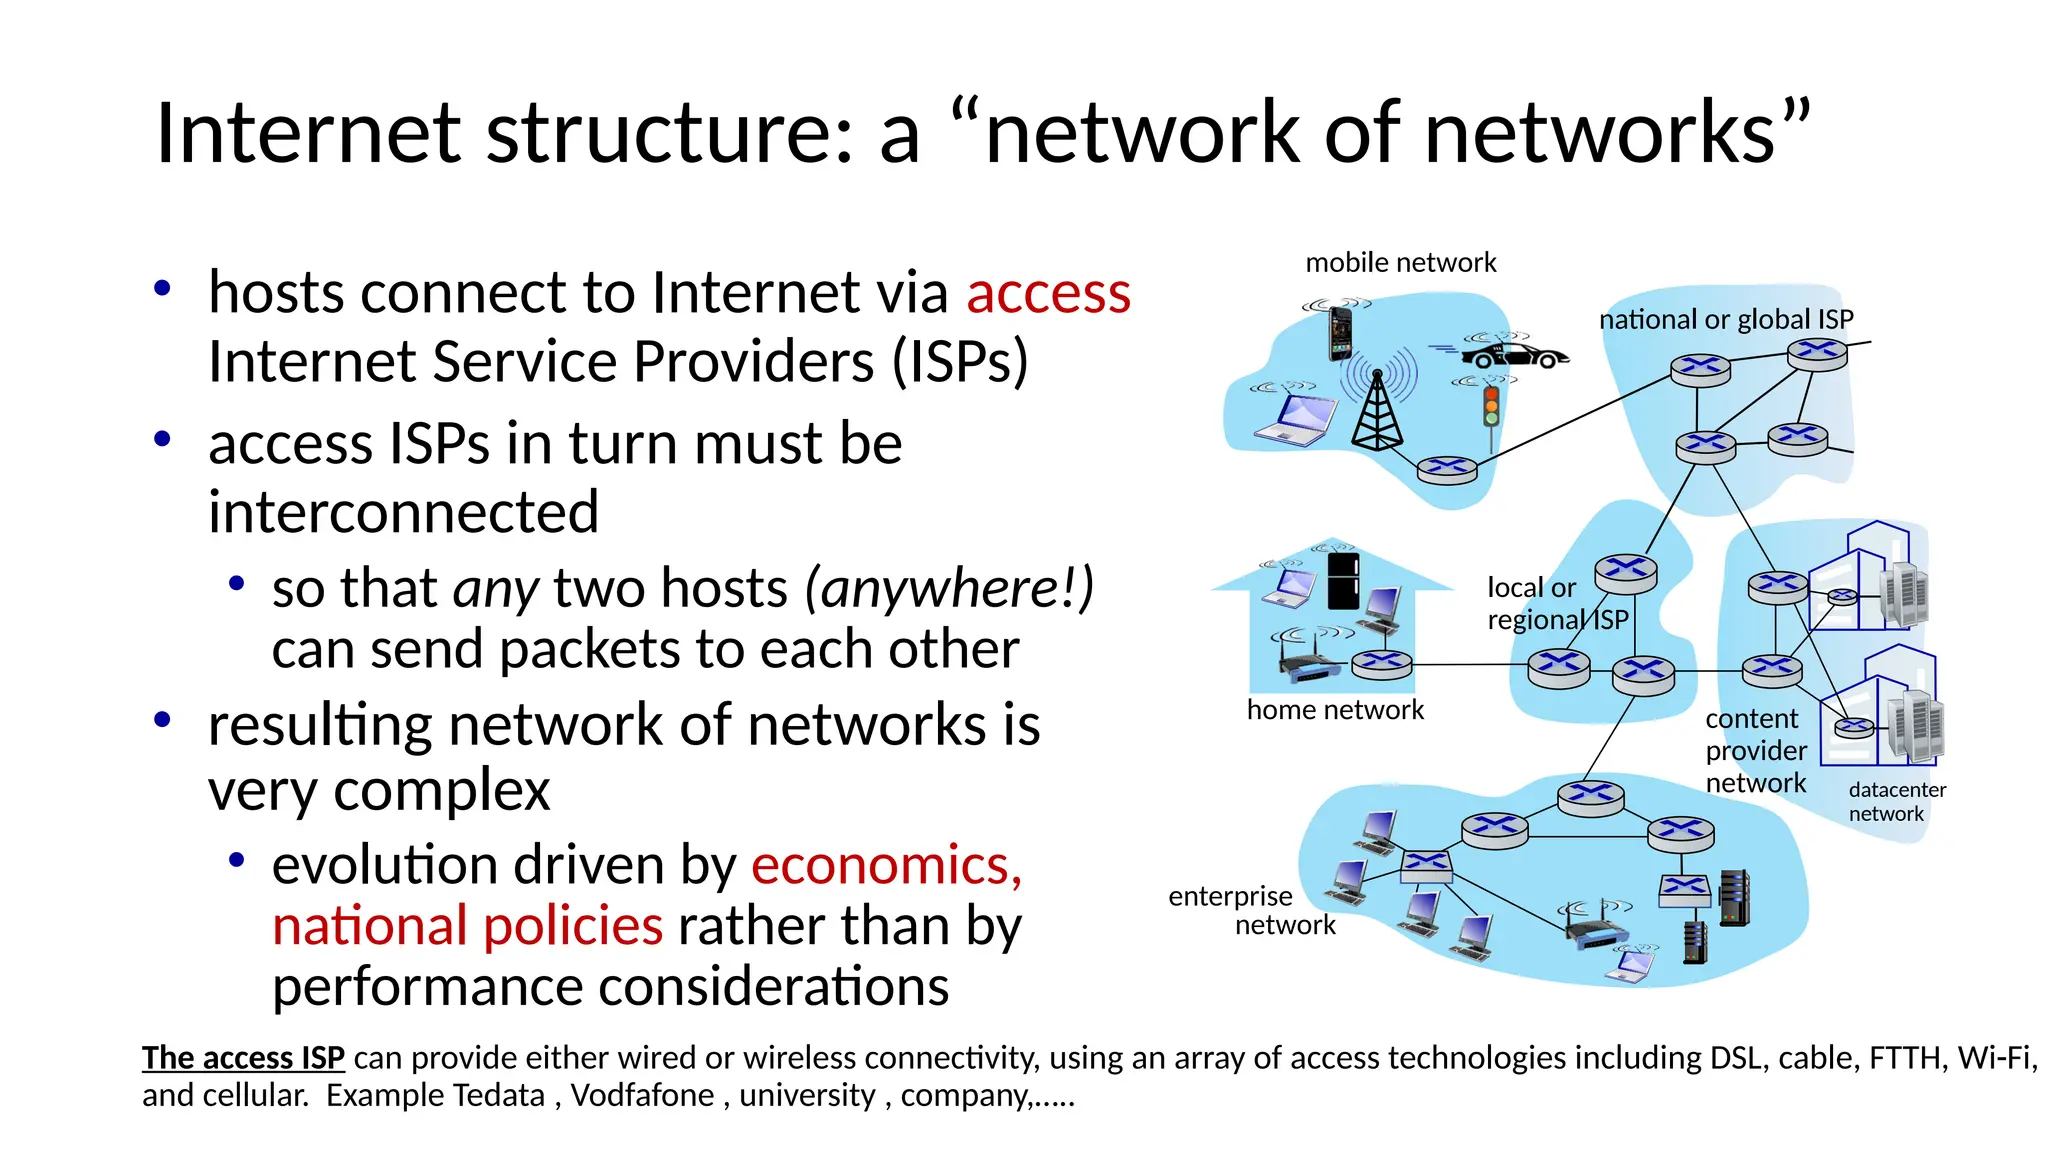
Internet structure: a“network of networks”
• hosts connect to Internet via access
Internet Service Providers (ISPs)
• access ISPs in turn must be
interconnected
• so that any two hosts (anywhere!)
can send packets to each other
• resulting network of networks is
very complex
• evolution driven by economics,
national policies rather than by
performance considerations
The access ISP can provide either wired or wireless connectivity, using an array of access technologies including DSL, cable, FTTH, Wi-Fi,
and cellular. Example Tedata , Vodfafone , university , company,…..
mobile network
home network
enterprise
network
national or global ISP
local or
regional ISP
datacenter
network
content
provider
network
4.
Internet structure: a“network of networks”
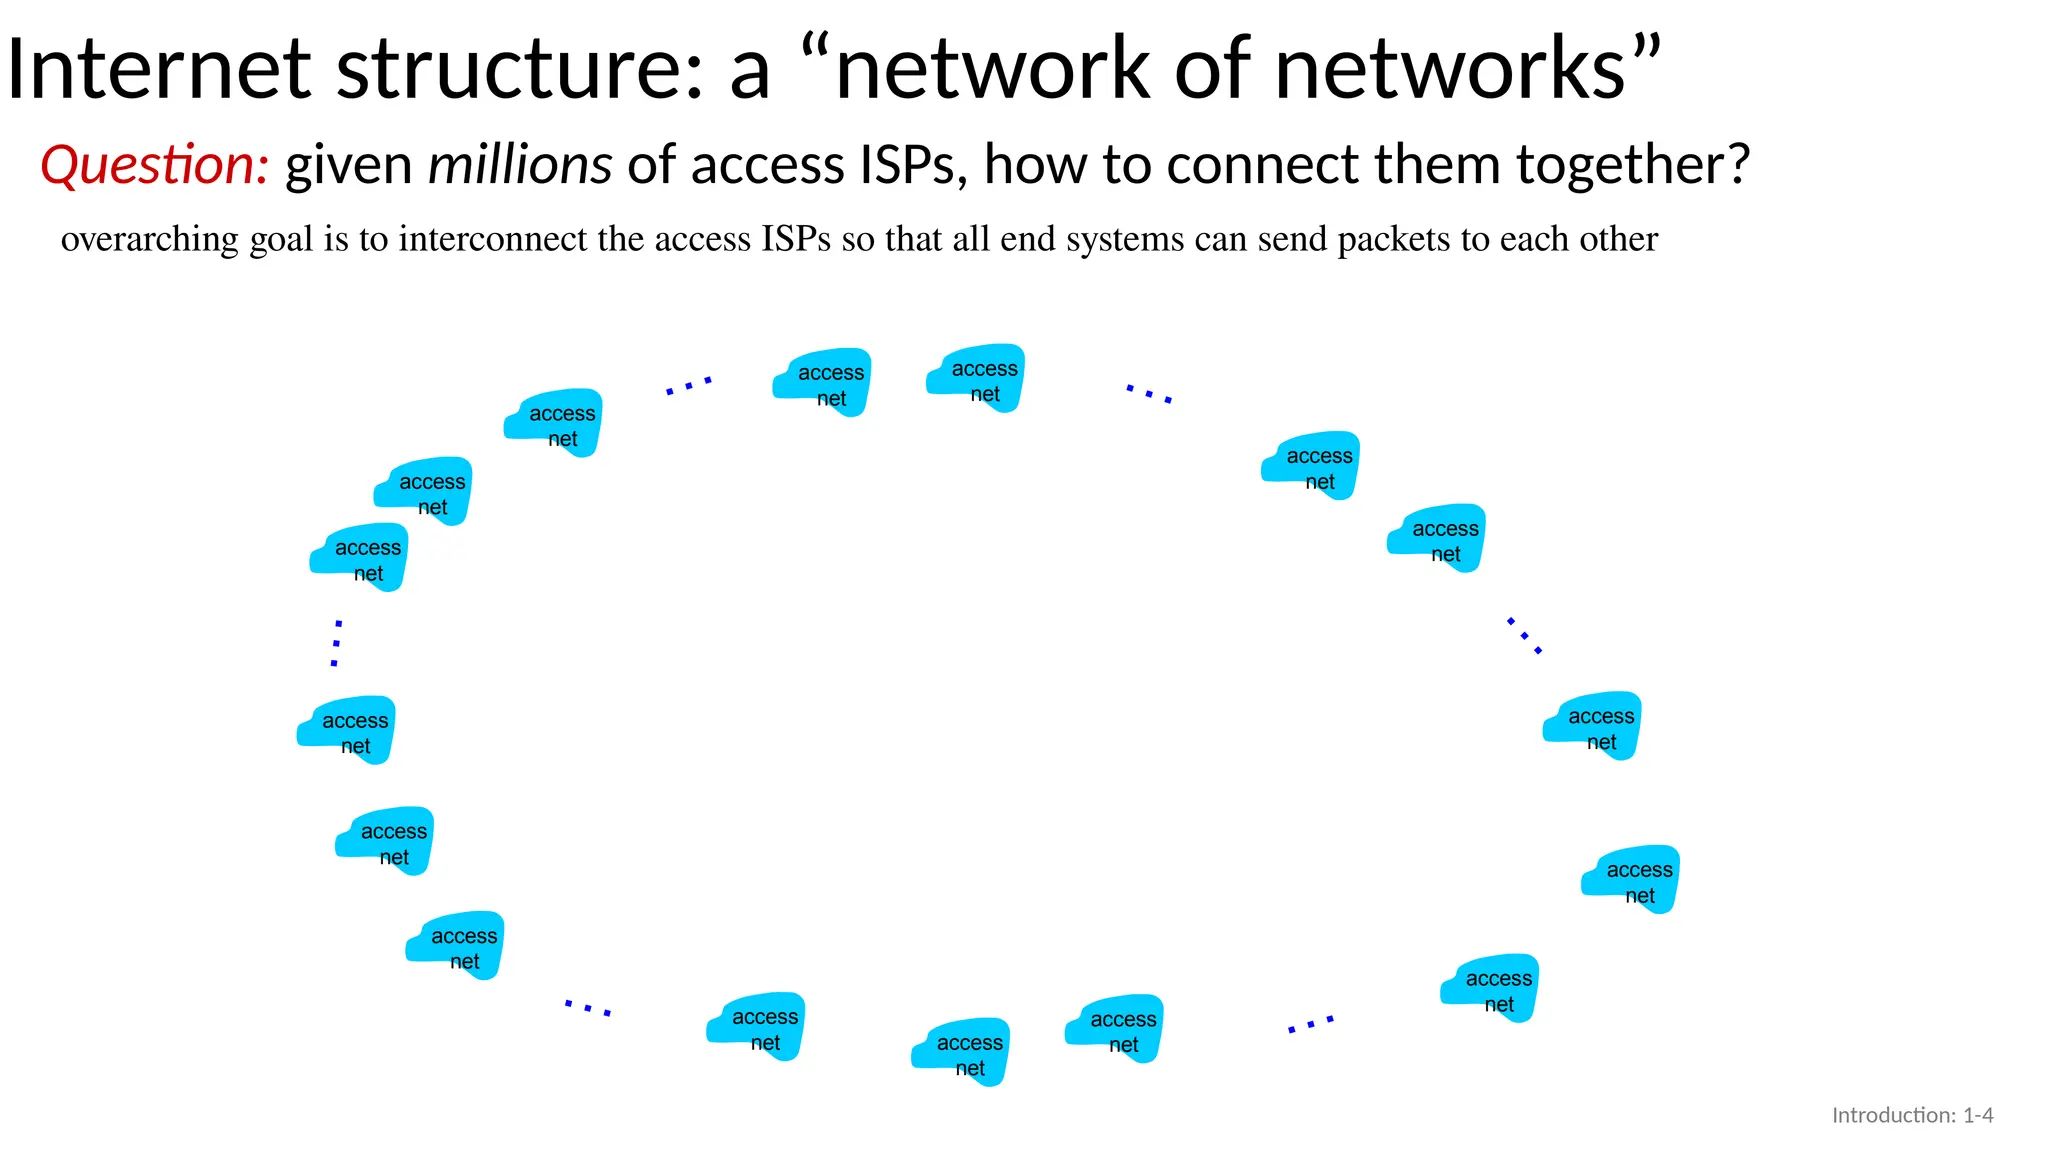
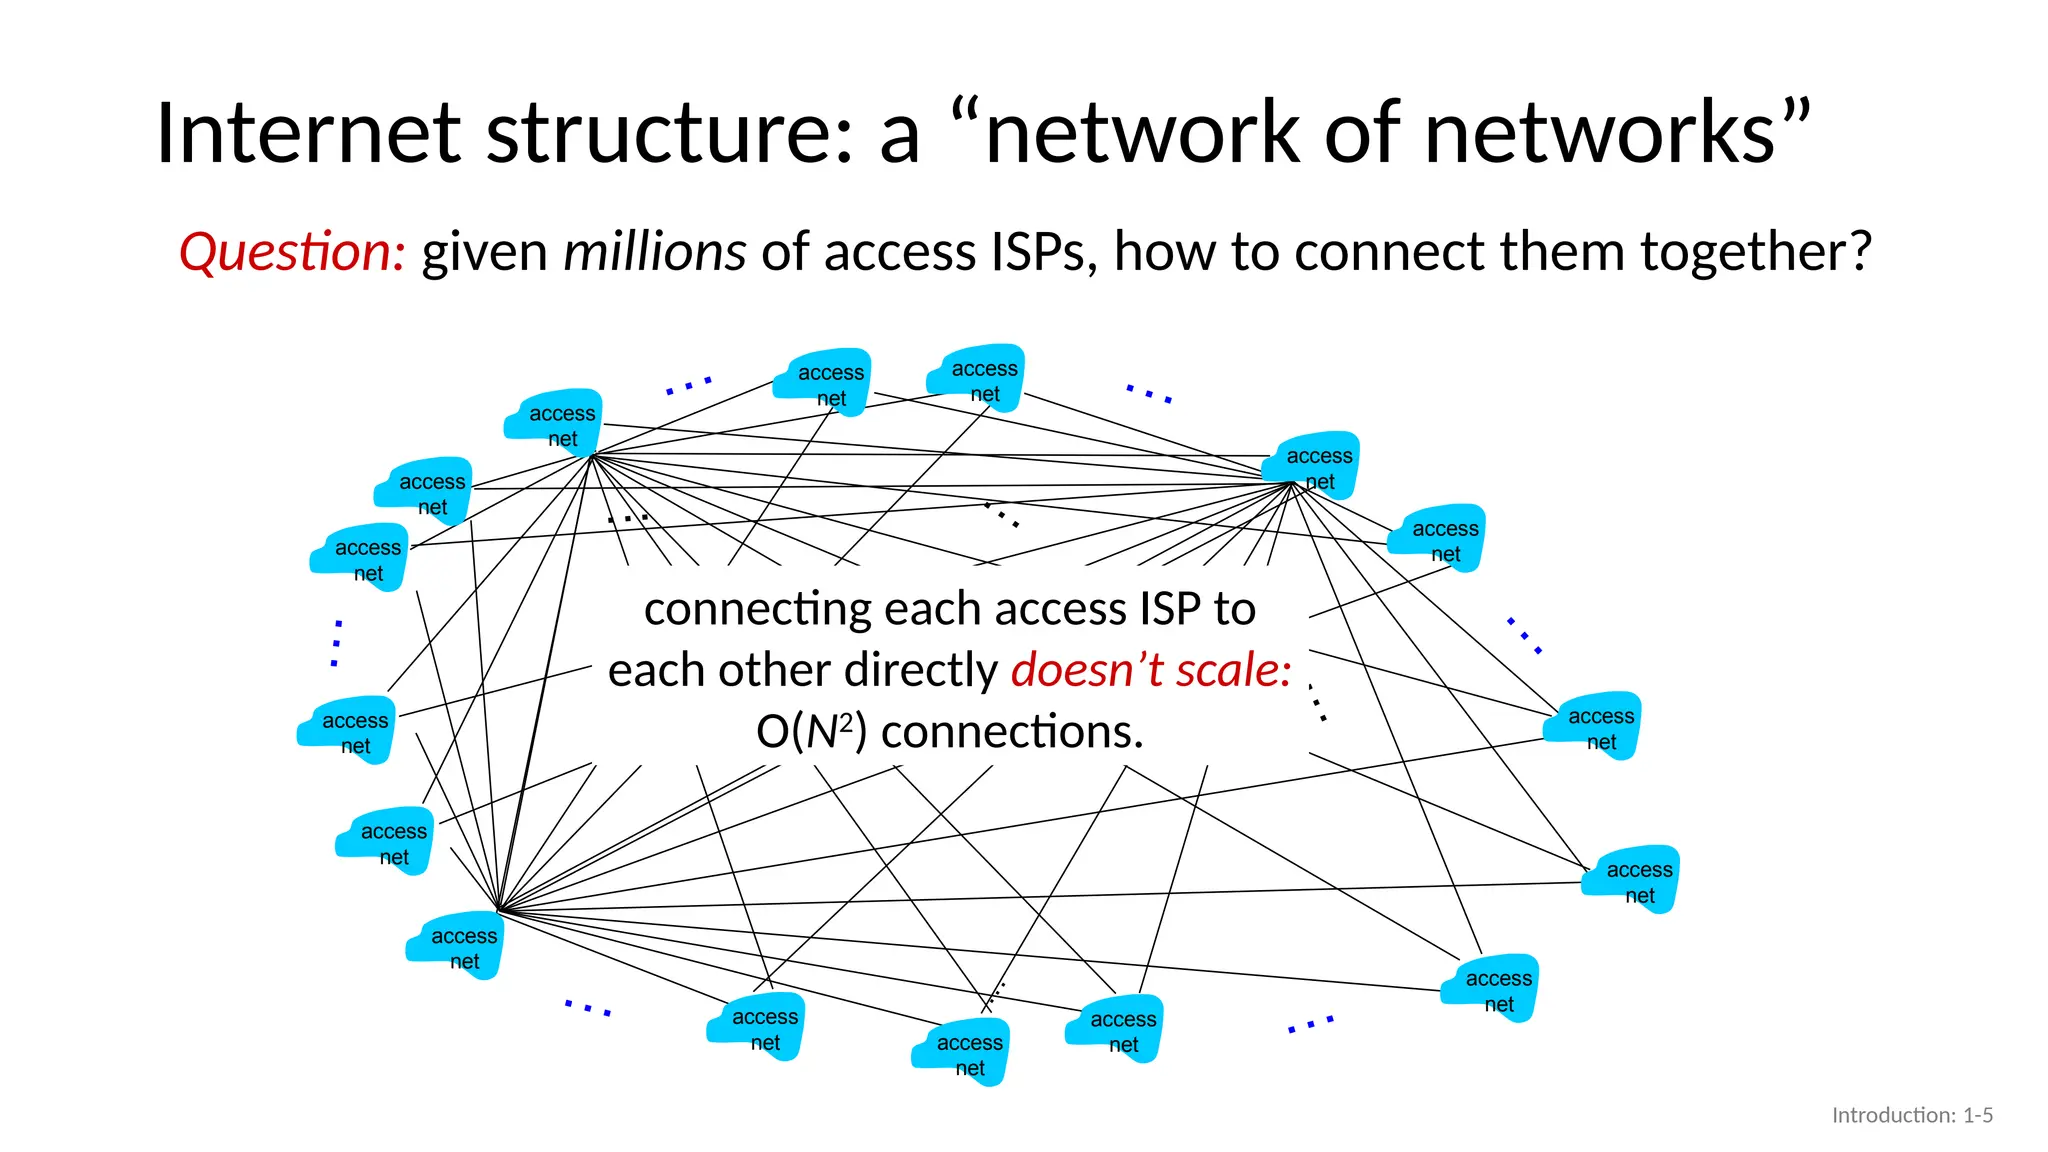
Question: given millions of access ISPs, how to connect them together?
overarching goal is to interconnect the access ISPs so that all end systems can send packets to each other
access
net
access
net
access
net
access
net
access
net
access
net
access
net
access
net
access
net
access
net
access
net
access
net
access
net
access
net
access
net
access
net
…
…
…
…
…
…
Introduction: 1-4
5.
…
…
…
…
…
Internet structure: a“network of networks”
Question: given millions of access ISPs, how to connect them together?
access
net
access
net
access
net
access
net
access
net
access
net
access
net
access
net
access
net
access
net
access
net
access
net
access
net
access
net
access
net
access
net
…
…
…
…
…
…
connecting each access ISP to
each other directly doesn’t scale:
O(N2
) connections.
Introduction: 1-5
6.
Internet structure: a“network of networks”
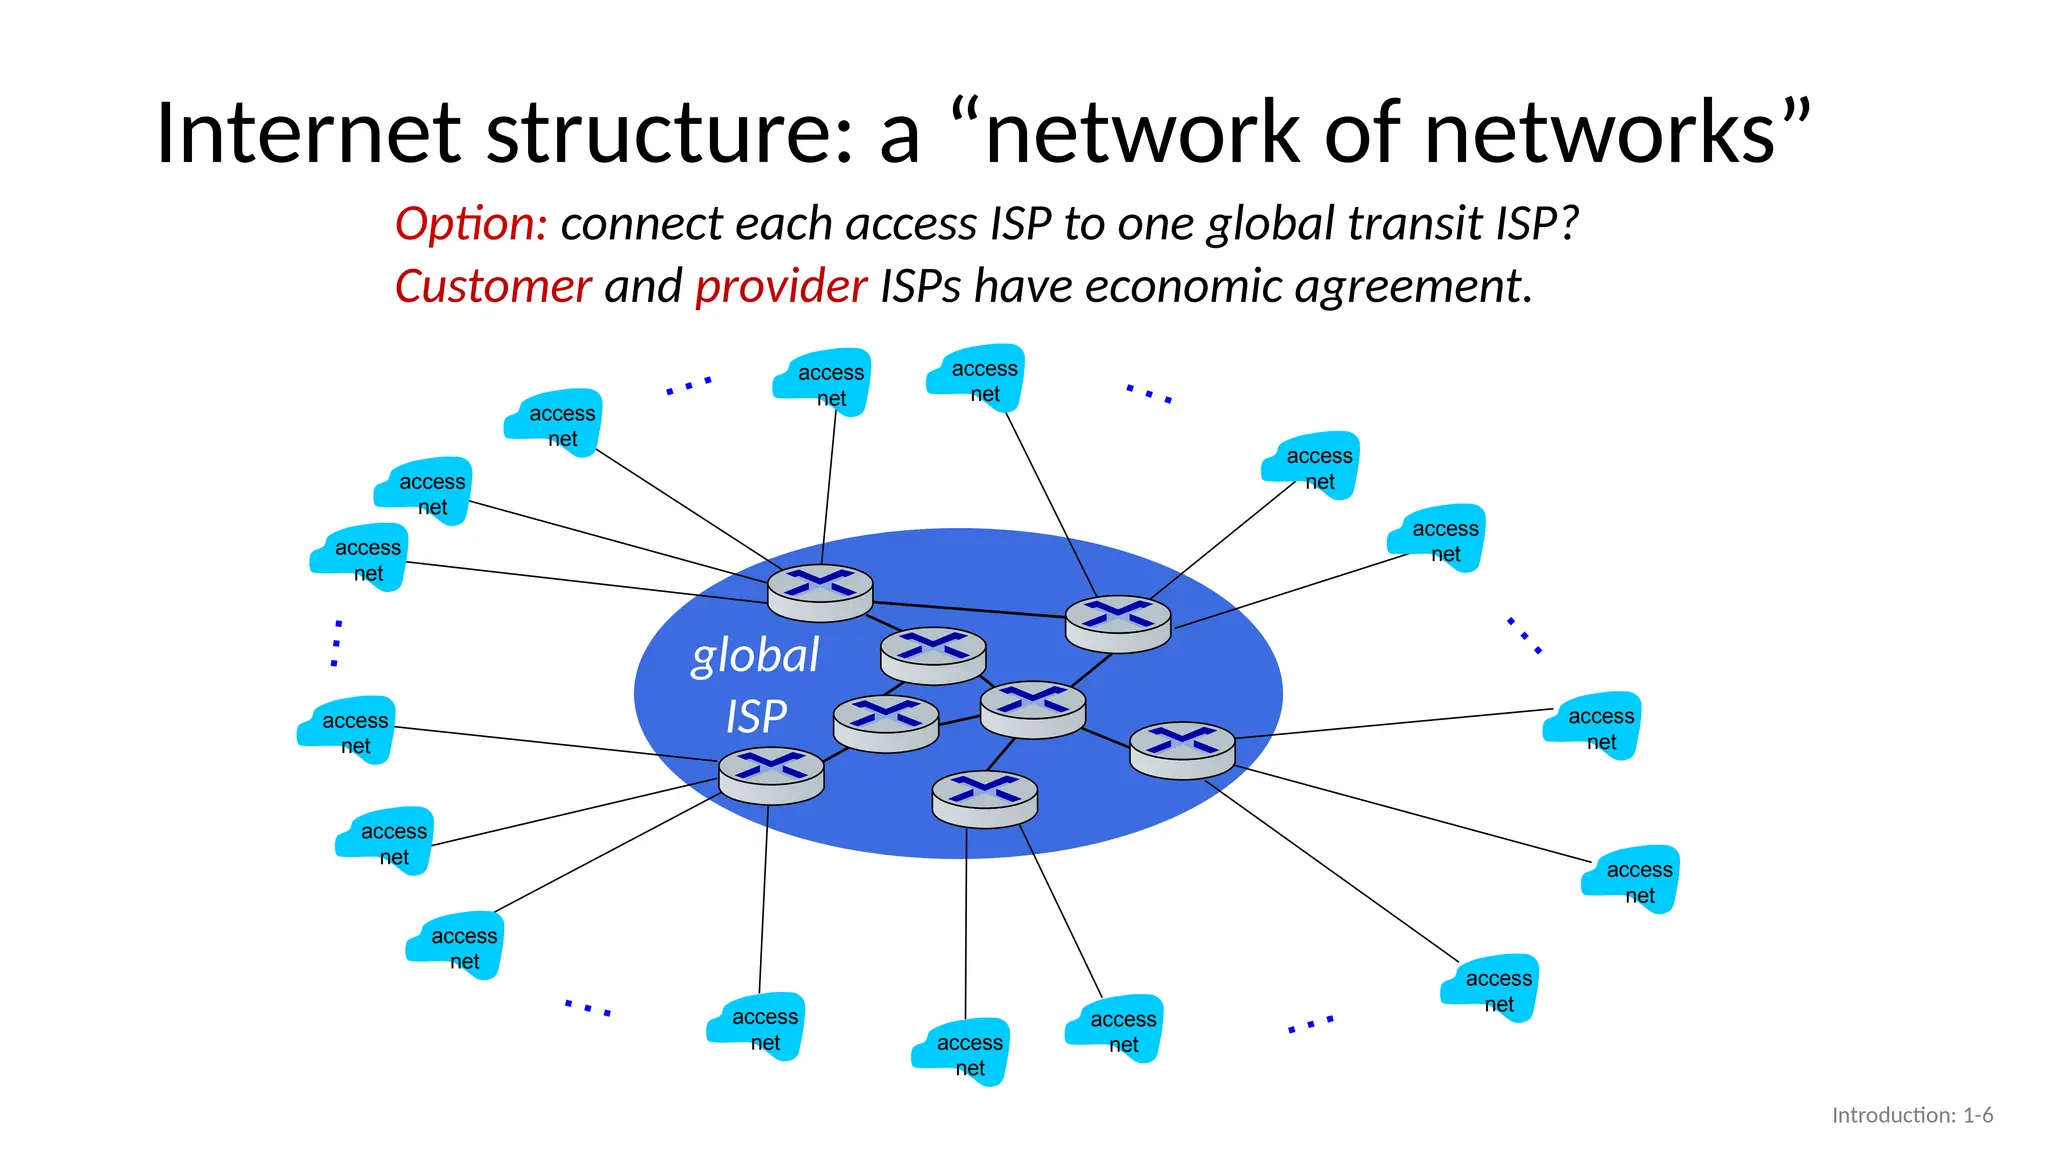
Option: connect each access ISP to one global transit ISP?
Customer and provider ISPs have economic agreement.
global
ISP
access
net
access
net
access
net
access
net
access
net
access
net
access
net
access
net
access
net
access
net
access
net
access
net
access
net
access
net
access
net
access
net
…
…
…
…
…
…
Introduction: 1-6
7.
ISP A
ISP C
ISPB
Internet structure: a “network of networks”
access
net
access
net
access
net
access
net
access
net
access
net
access
net
access
net
access
net
access
net
access
net
access
net
access
net
access
net
access
net
access
net
…
…
…
…
…
…
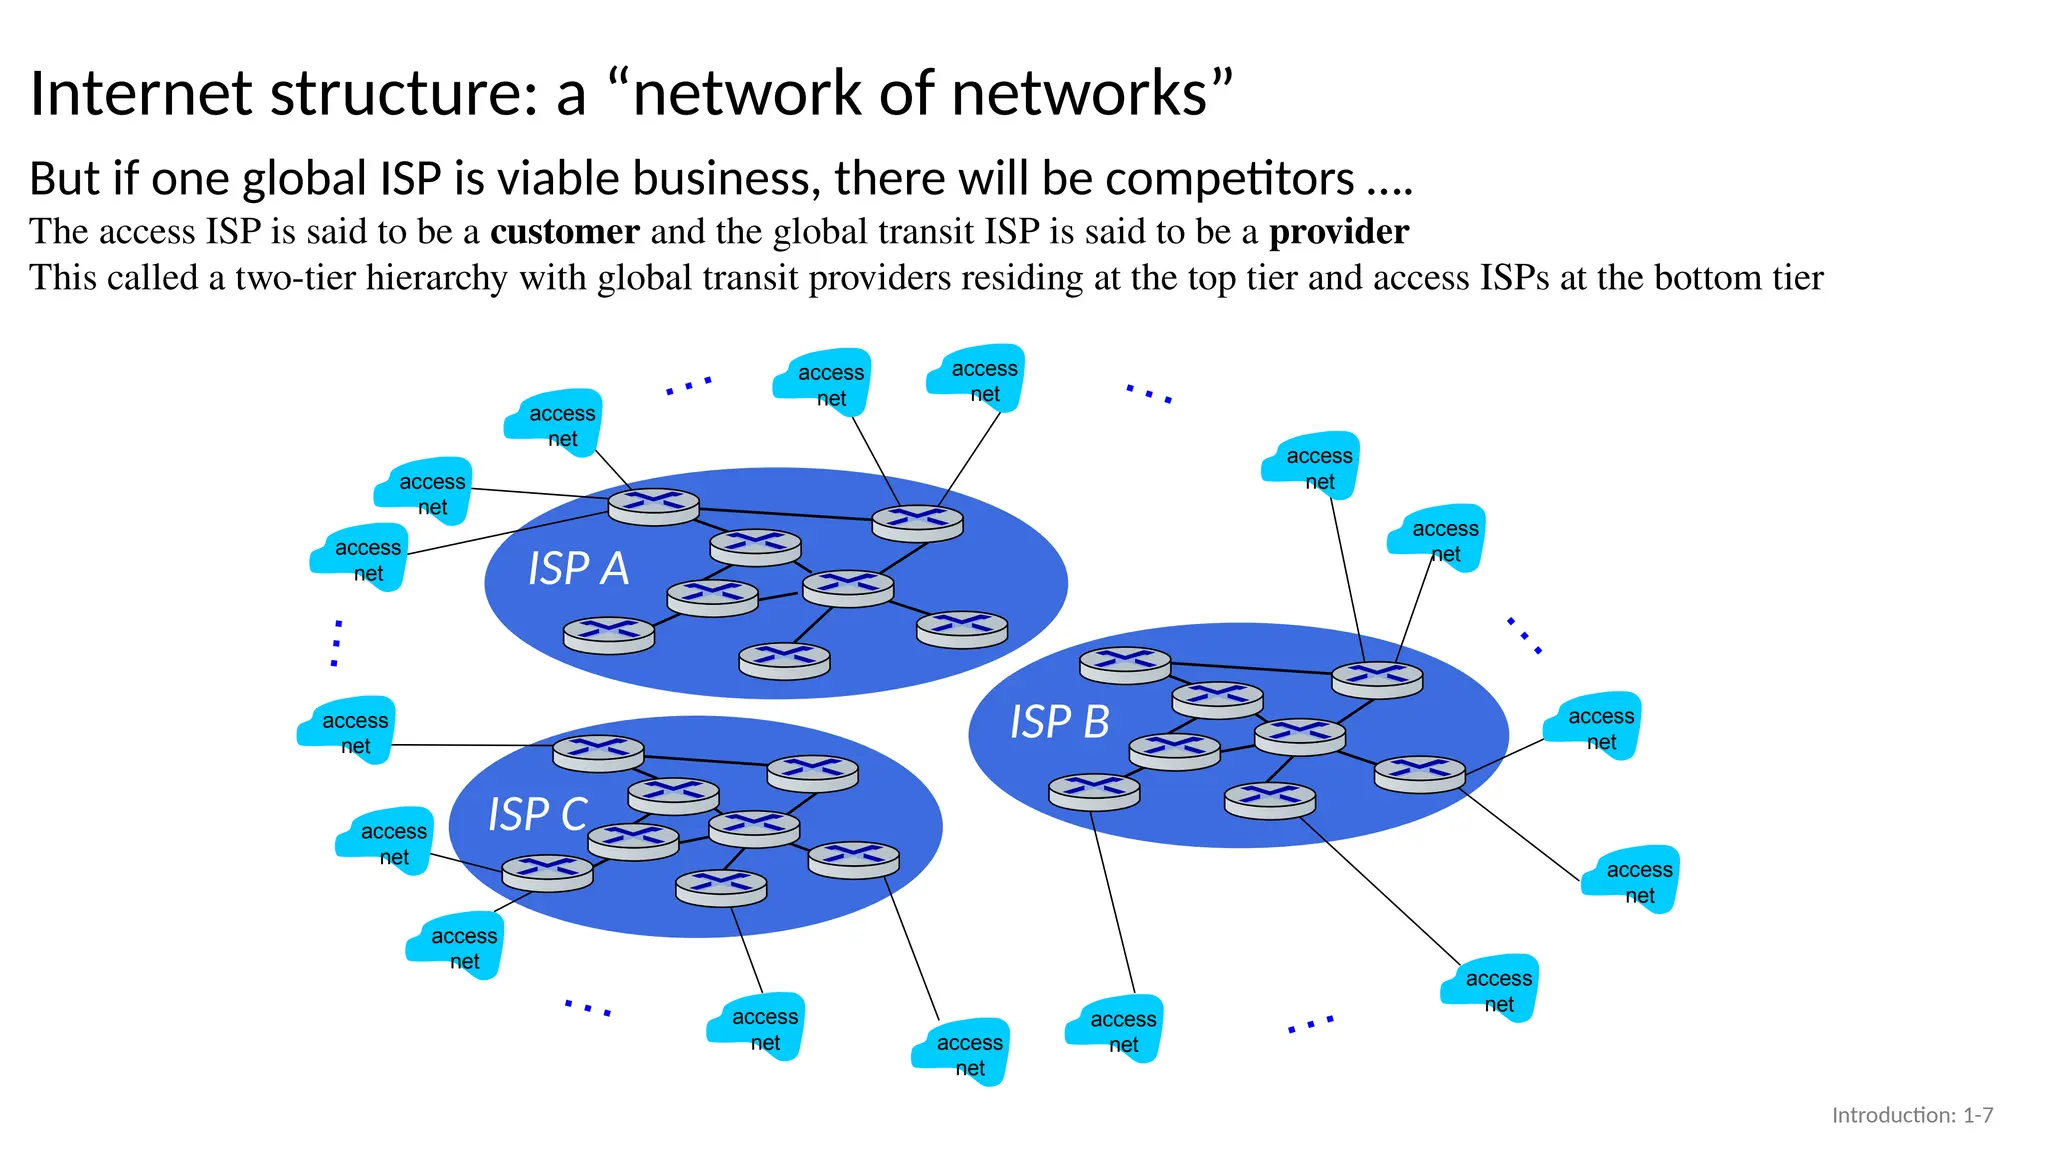
But if one global ISP is viable business, there will be competitors ….
The access ISP is said to be a customer and the global transit ISP is said to be a provider
This called a two-tier hierarchy with global transit providers residing at the top tier and access ISPs at the bottom tier
Introduction: 1-7
8.
ISP A
ISP C
ISPB
Internet structure: a “network of networks”
access
net
access
net
access
net
access
net
access
net
access
net
access
net
access
net
access
net
access
net
access
net
access
net
access
net
access
net
access
net
access
net
…
…
…
…
…
…
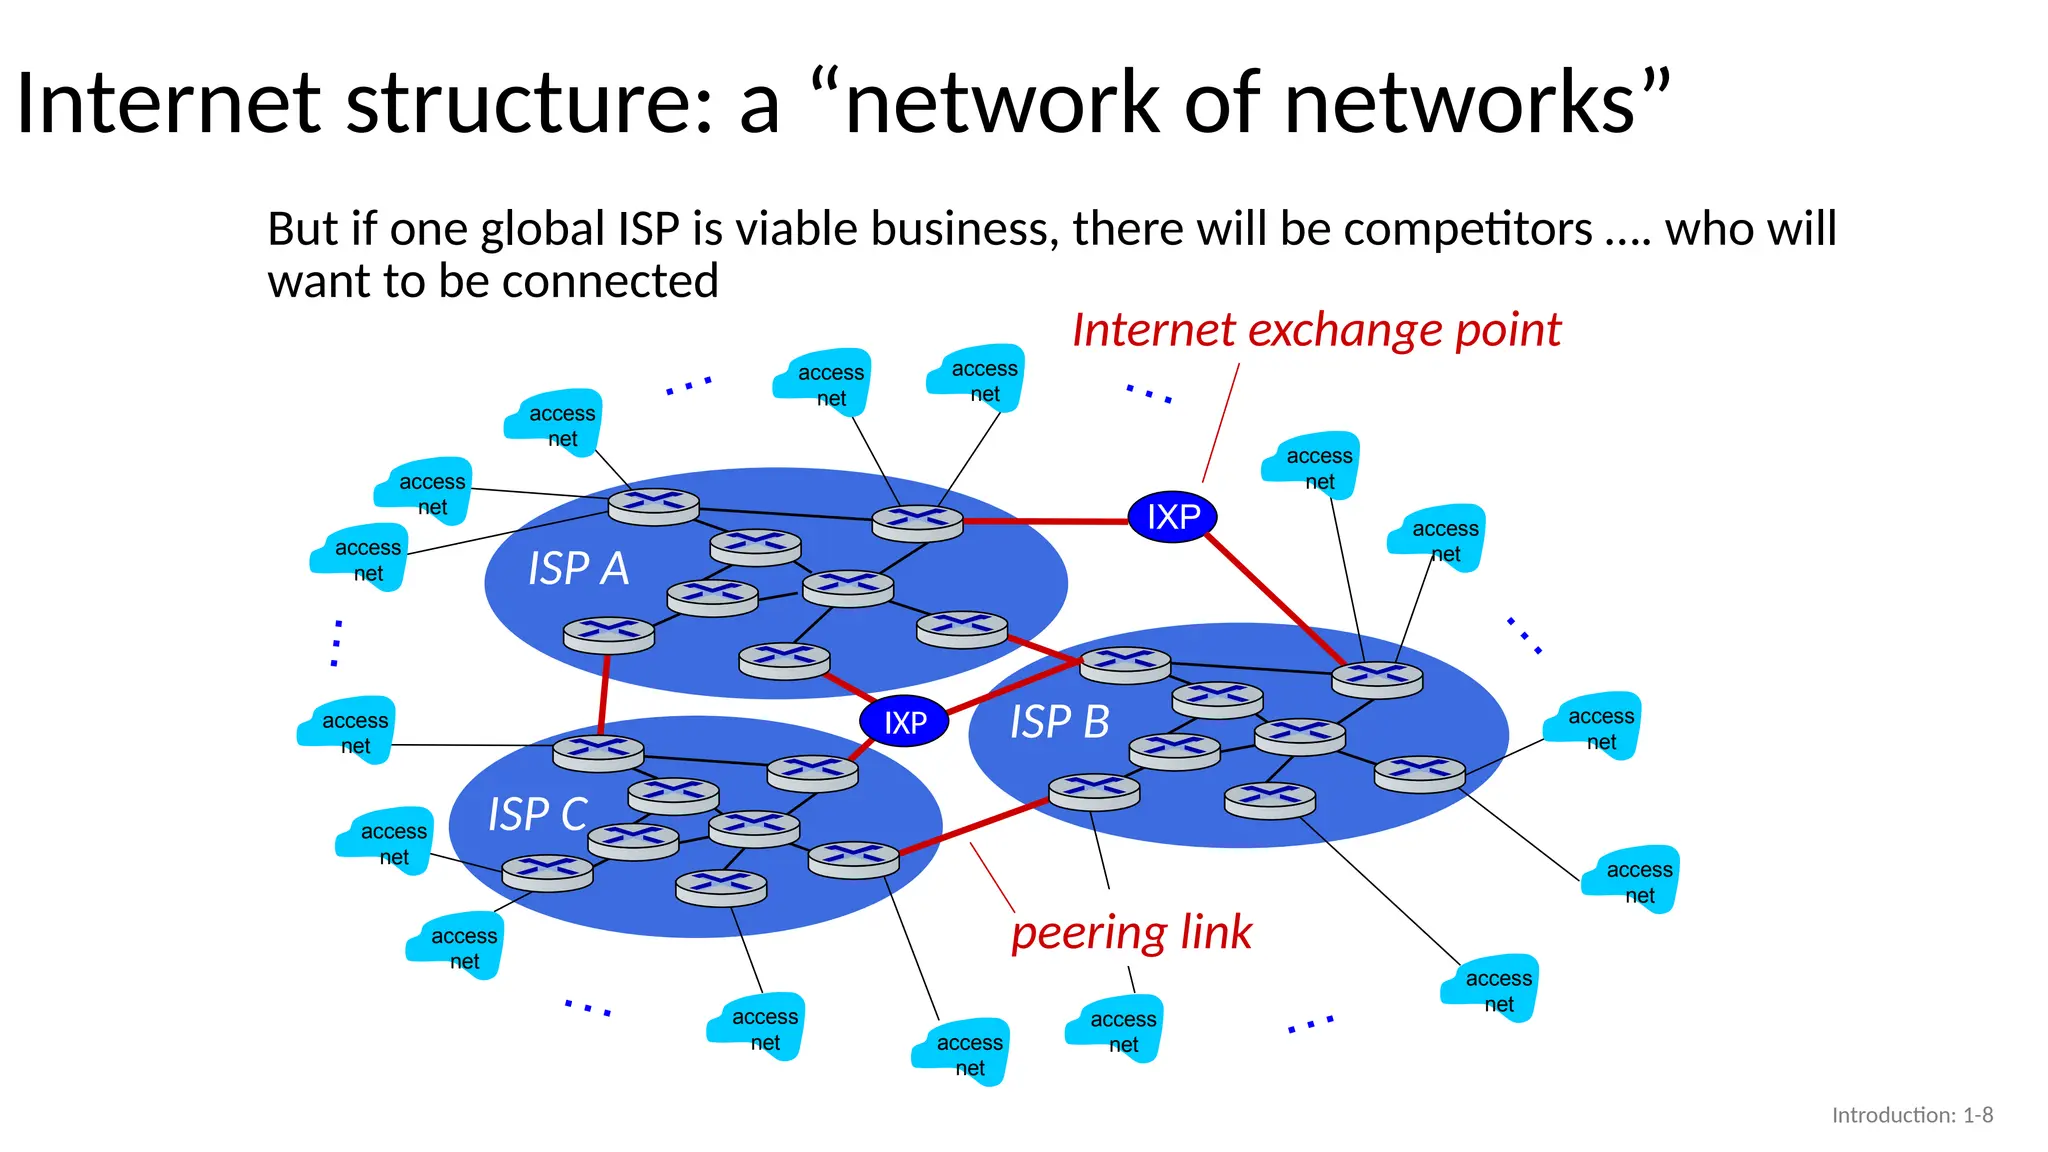
But if one global ISP is viable business, there will be competitors …. who will
want to be connected
IXP
peering link
Internet exchange point
IXP
Introduction: 1-8
9.
ISP A
ISP C
ISPB
Internet structure: a “network of networks”
access
net
access
net
access
net
access
net
access
net
access
net
access
net
access
net
access
net
access
net
access
net
…
…
…
…
…
…
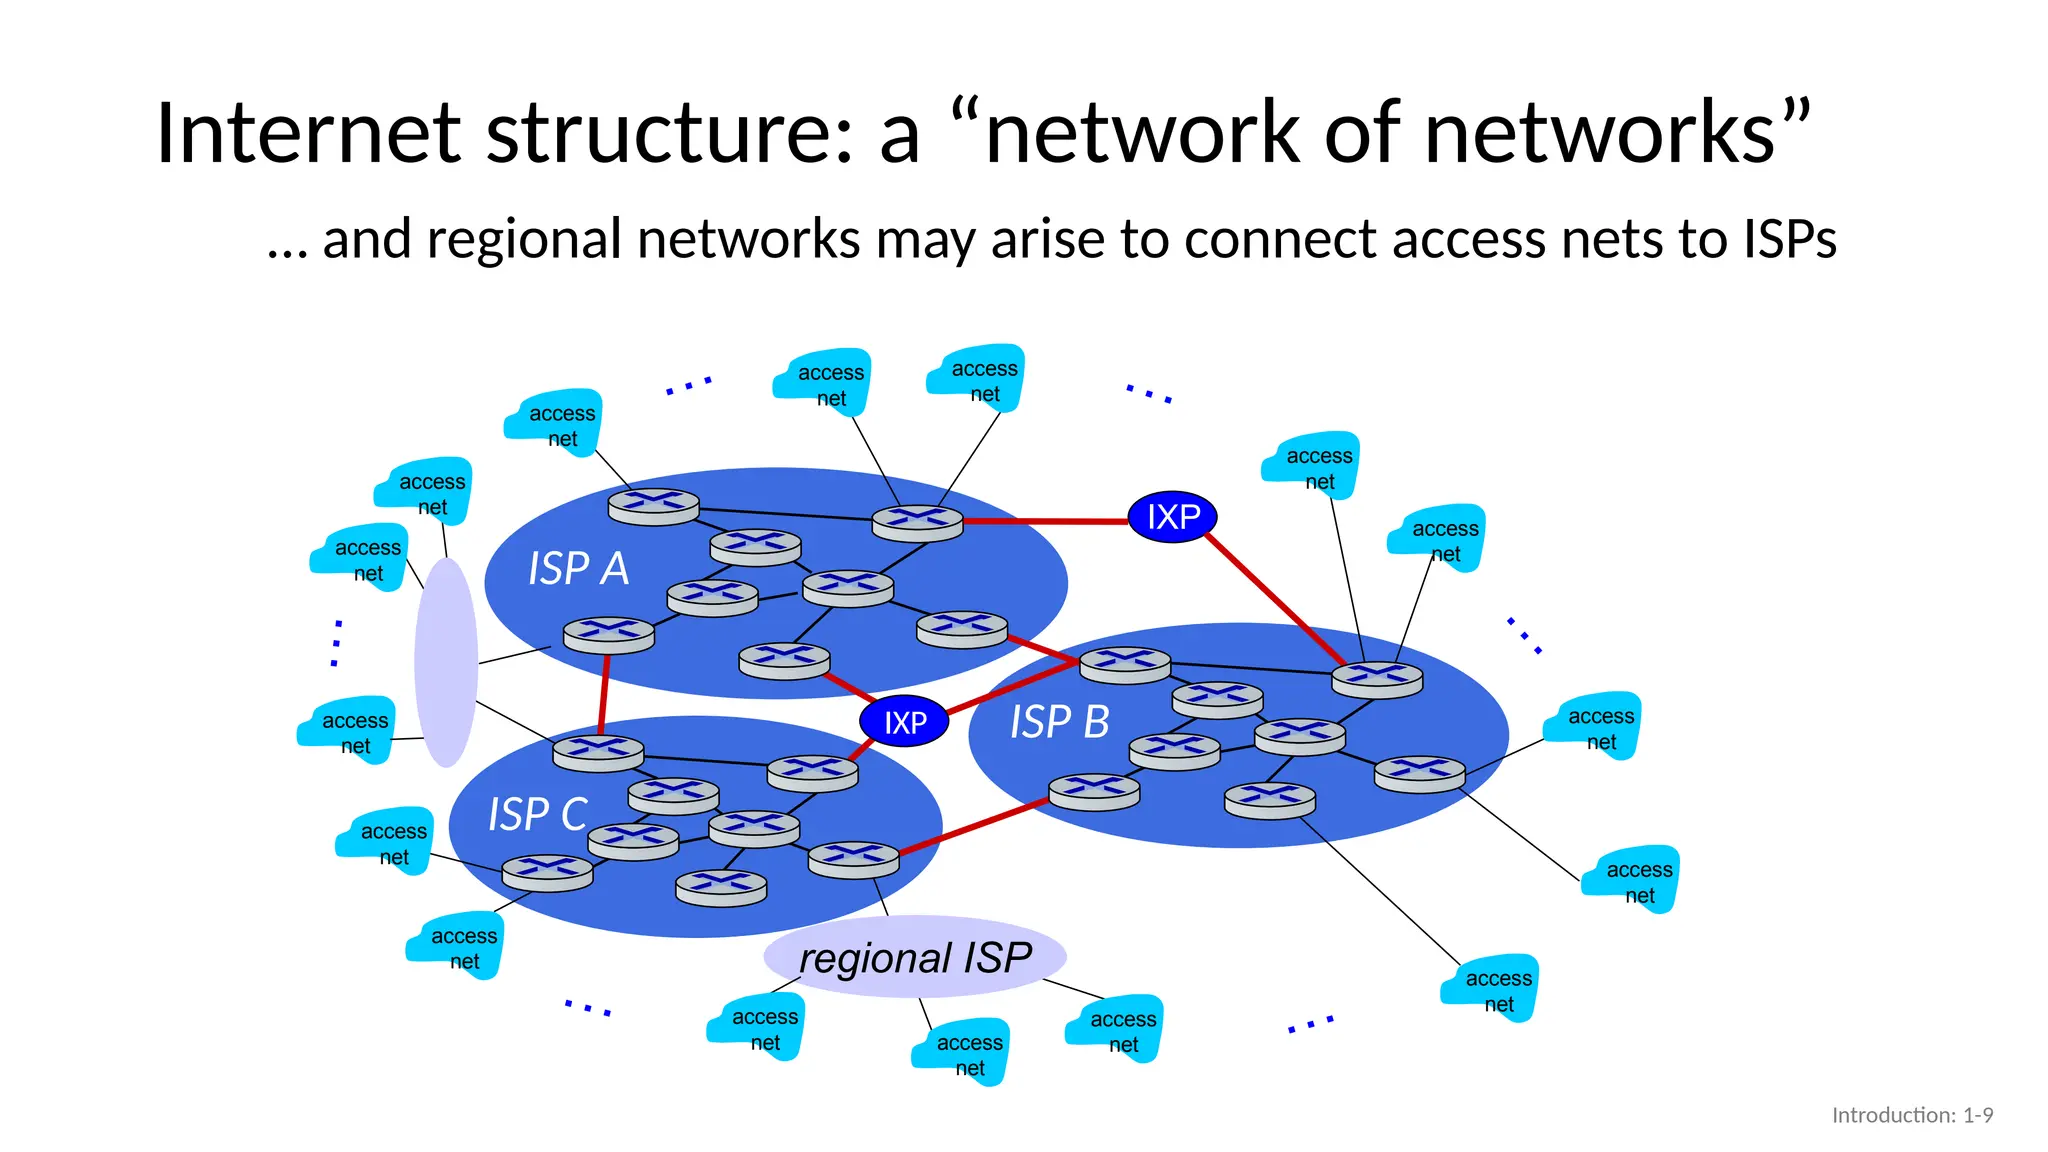
… and regional networks may arise to connect access nets to ISPs
IXP
IXP
access
net
access
net
regional ISP
access
net access
net
access
net
Introduction: 1-9
10.
ISP A
ISP C
ISPB
Internet structure: a “network of networks”
access
net
access
net
access
net
access
net
access
net
access
net
access
net
access
net
access
net
access
net
access
net
…
…
…
…
…
…
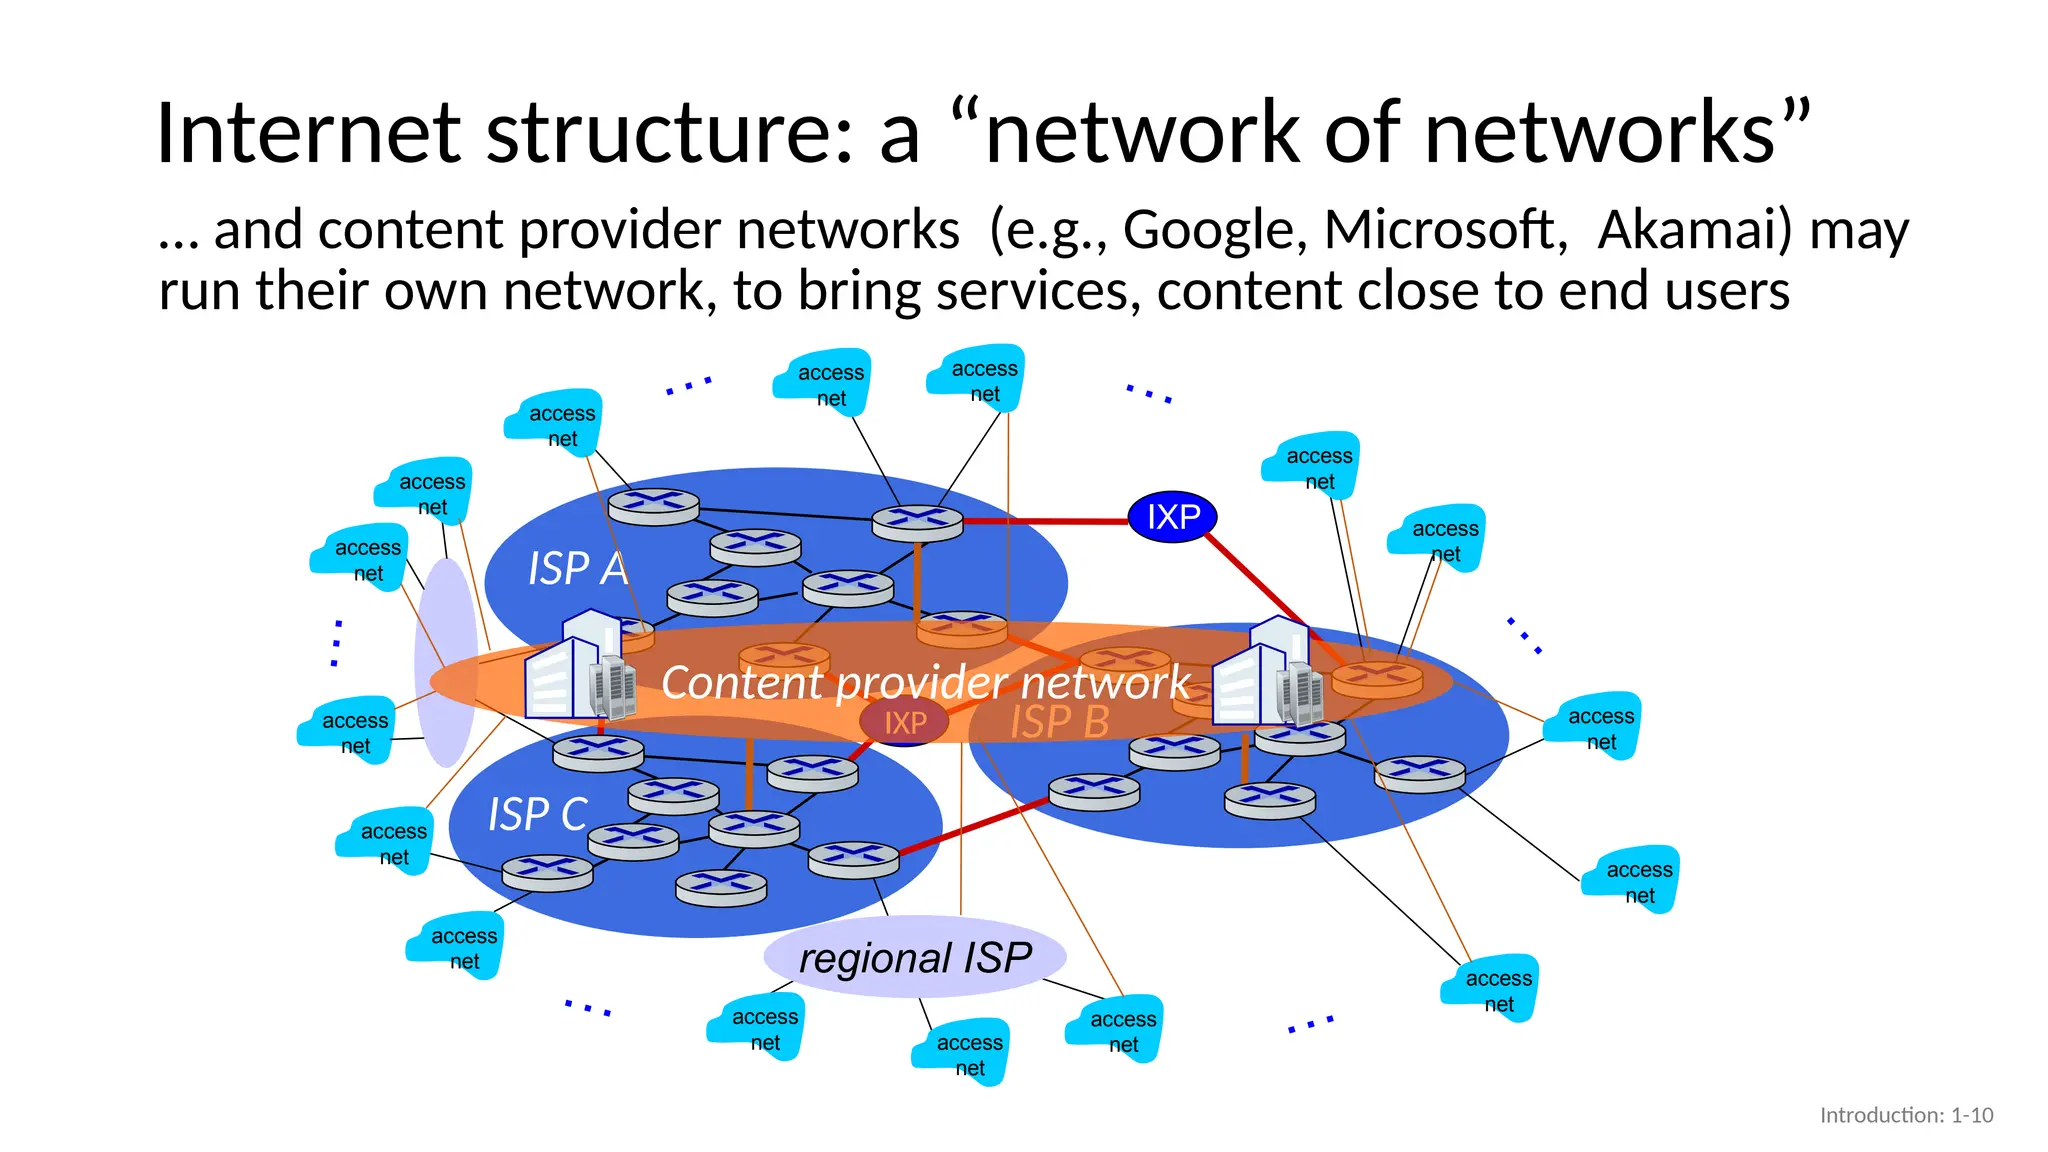
… and content provider networks (e.g., Google, Microsoft, Akamai) may
run their own network, to bring services, content close to end users
IXP
IXP
access
net
access
net
access
net access
net
access
net
Content provider network
regional ISP
Introduction: 1-10
11.
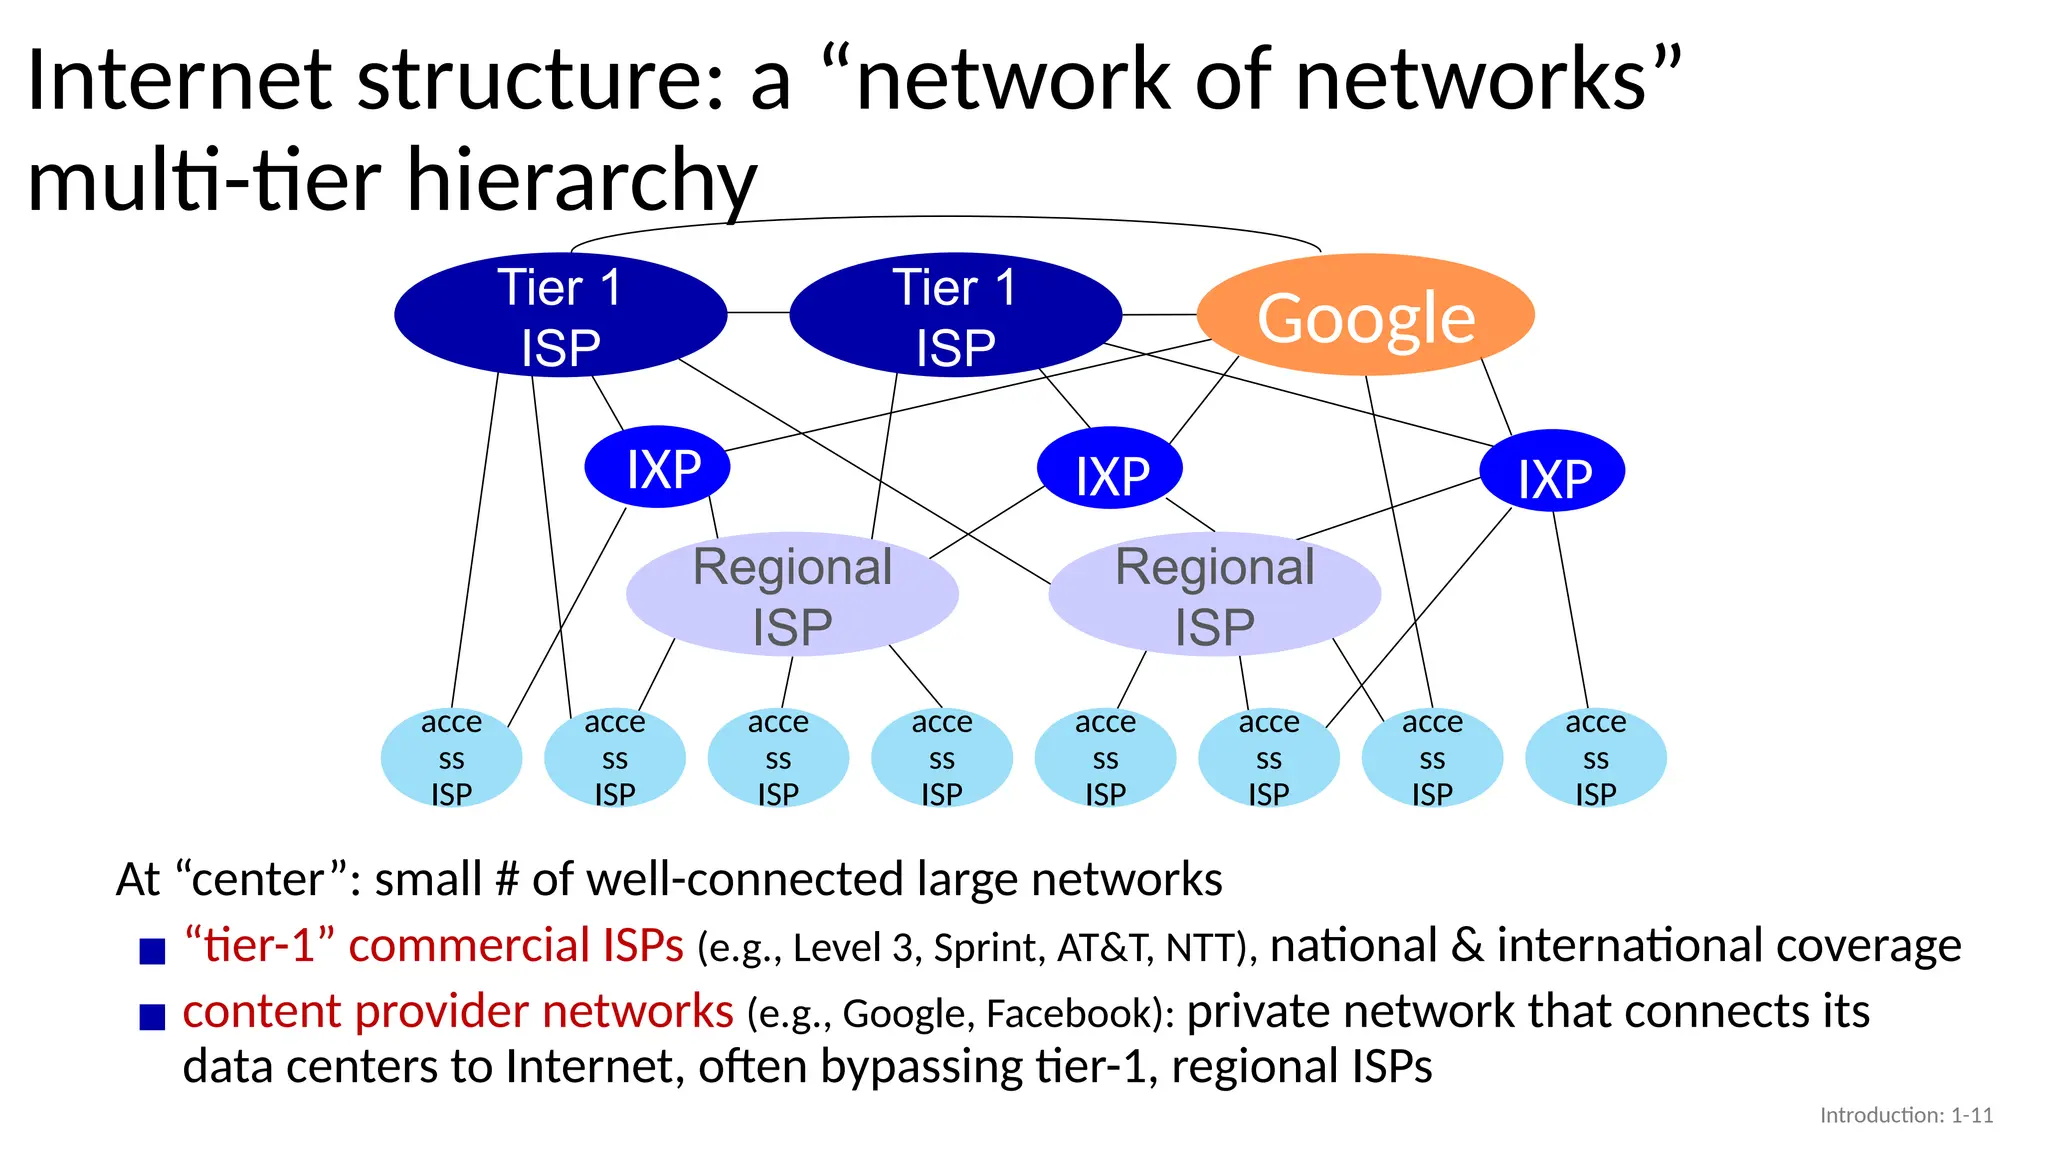
Internet structure: a“network of networks”
multi-tier hierarchy
acce
ss
ISP
acce
ss
ISP
acce
ss
ISP
acce
ss
ISP
acce
ss
ISP
acce
ss
ISP
acce
ss
ISP
acce
ss
ISP
At “center”: small # of well-connected large networks
▪ “tier-1” commercial ISPs (e.g., Level 3, Sprint, AT&T, NTT), national & international coverage
▪ content provider networks (e.g., Google, Facebook): private network that connects its
data centers to Internet, often bypassing tier-1, regional ISPs
Regional
ISP
Regional
ISP
Tier 1
ISP
Tier 1
ISP
IXP
Google
IXP
IXP
Introduction: 1-11
12.
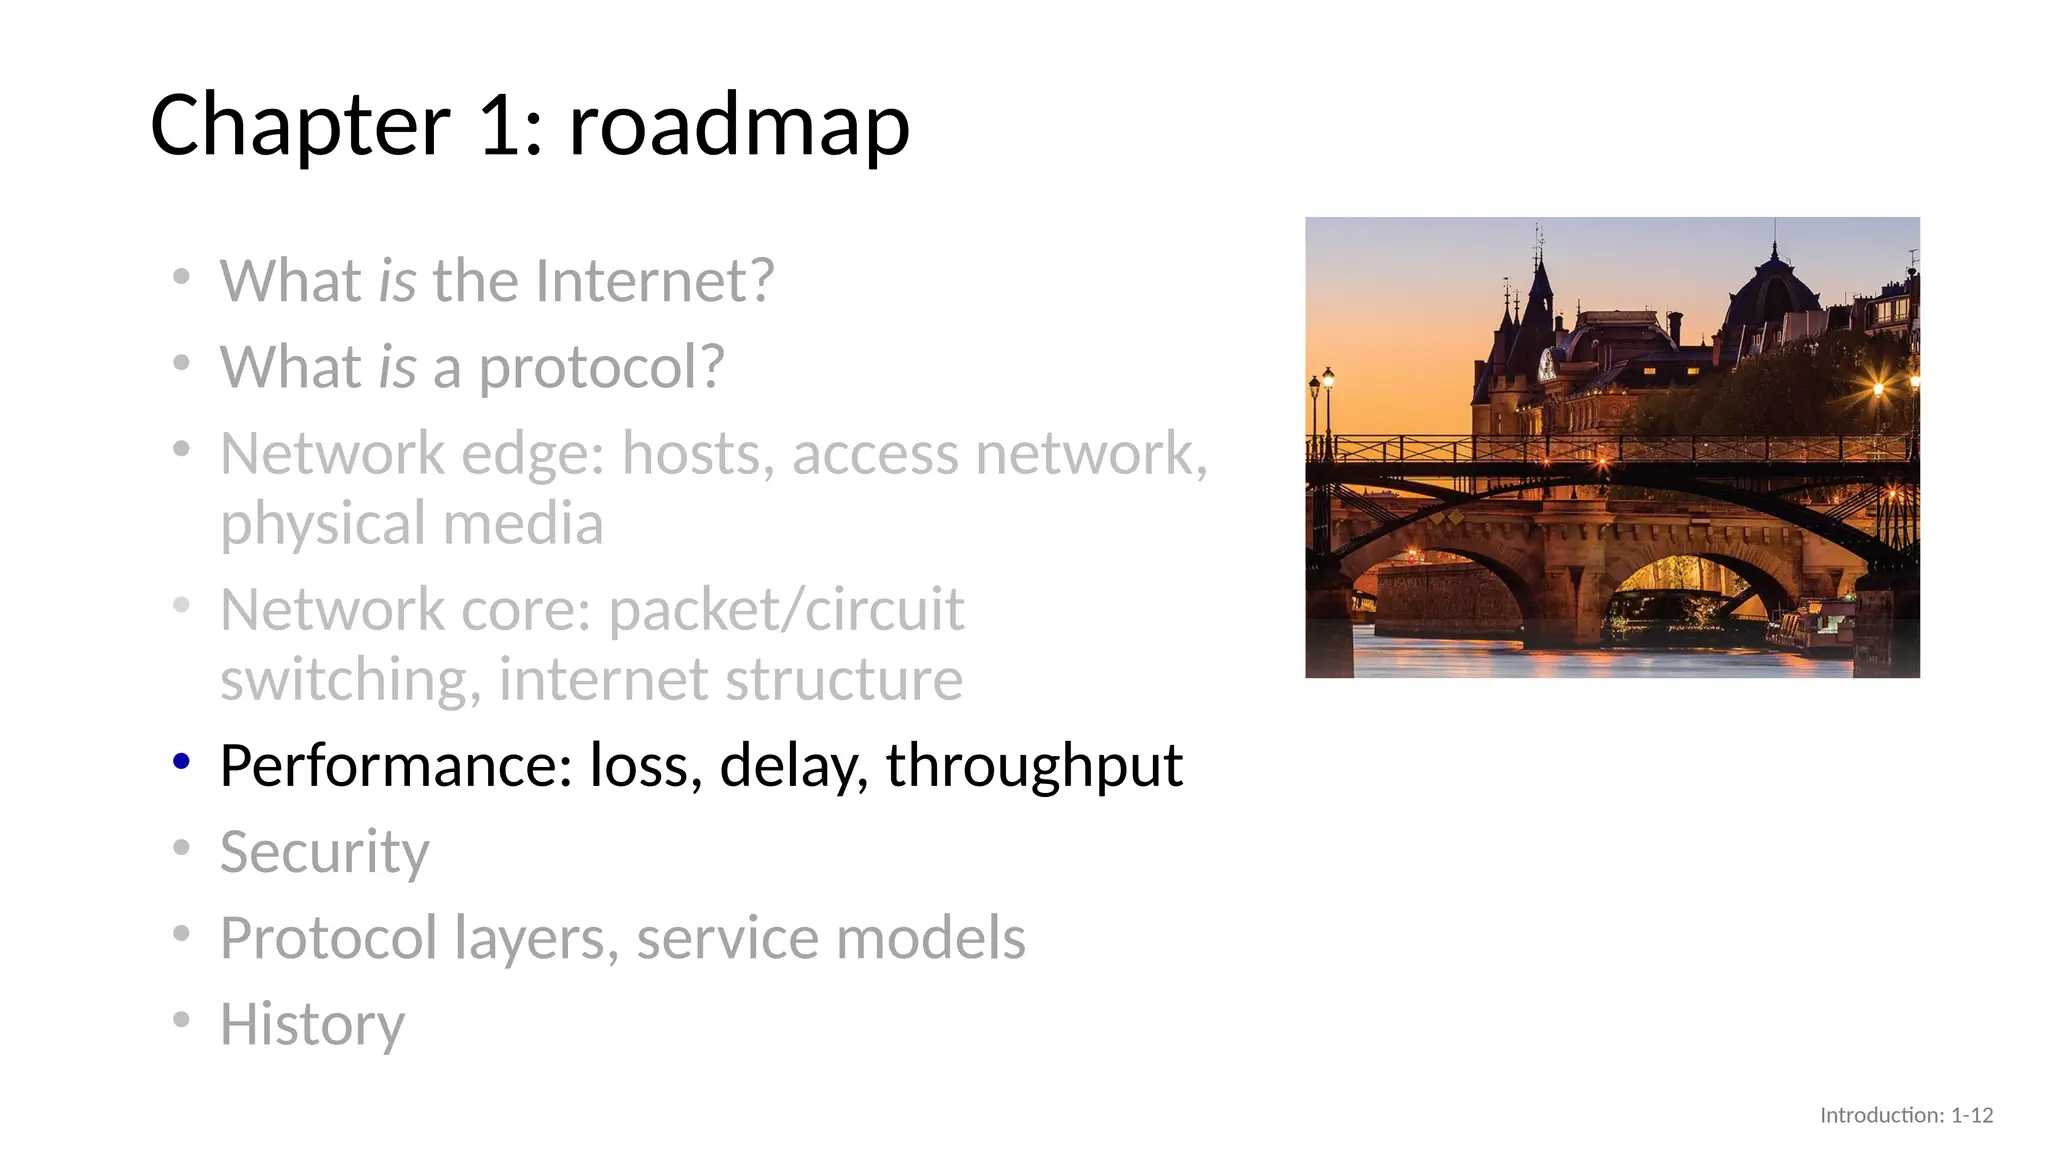
Chapter 1: roadmap
Introduction:1-12
• What is the Internet?
• What is a protocol?
• Network edge: hosts, access network,
physical media
• Network core: packet/circuit
switching, internet structure
• Performance: loss, delay, throughput
• Security
• Protocol layers, service models
• History
13.
How do packetdelay and loss occur? In Packet switching
• packets queue in router buffers, waiting for turn for transmission
▪ queue length grows when arrival rate to link (temporarily) exceeds output link
capacity
▪packet loss occurs when memory to hold queued packets fills up
A
B
packet being transmitted (transmission delay)
packets in buffers (queueing delay)
free (available) buffers: arriving packets
dropped (loss) if no free buffers
Introduction: 1-13
14.
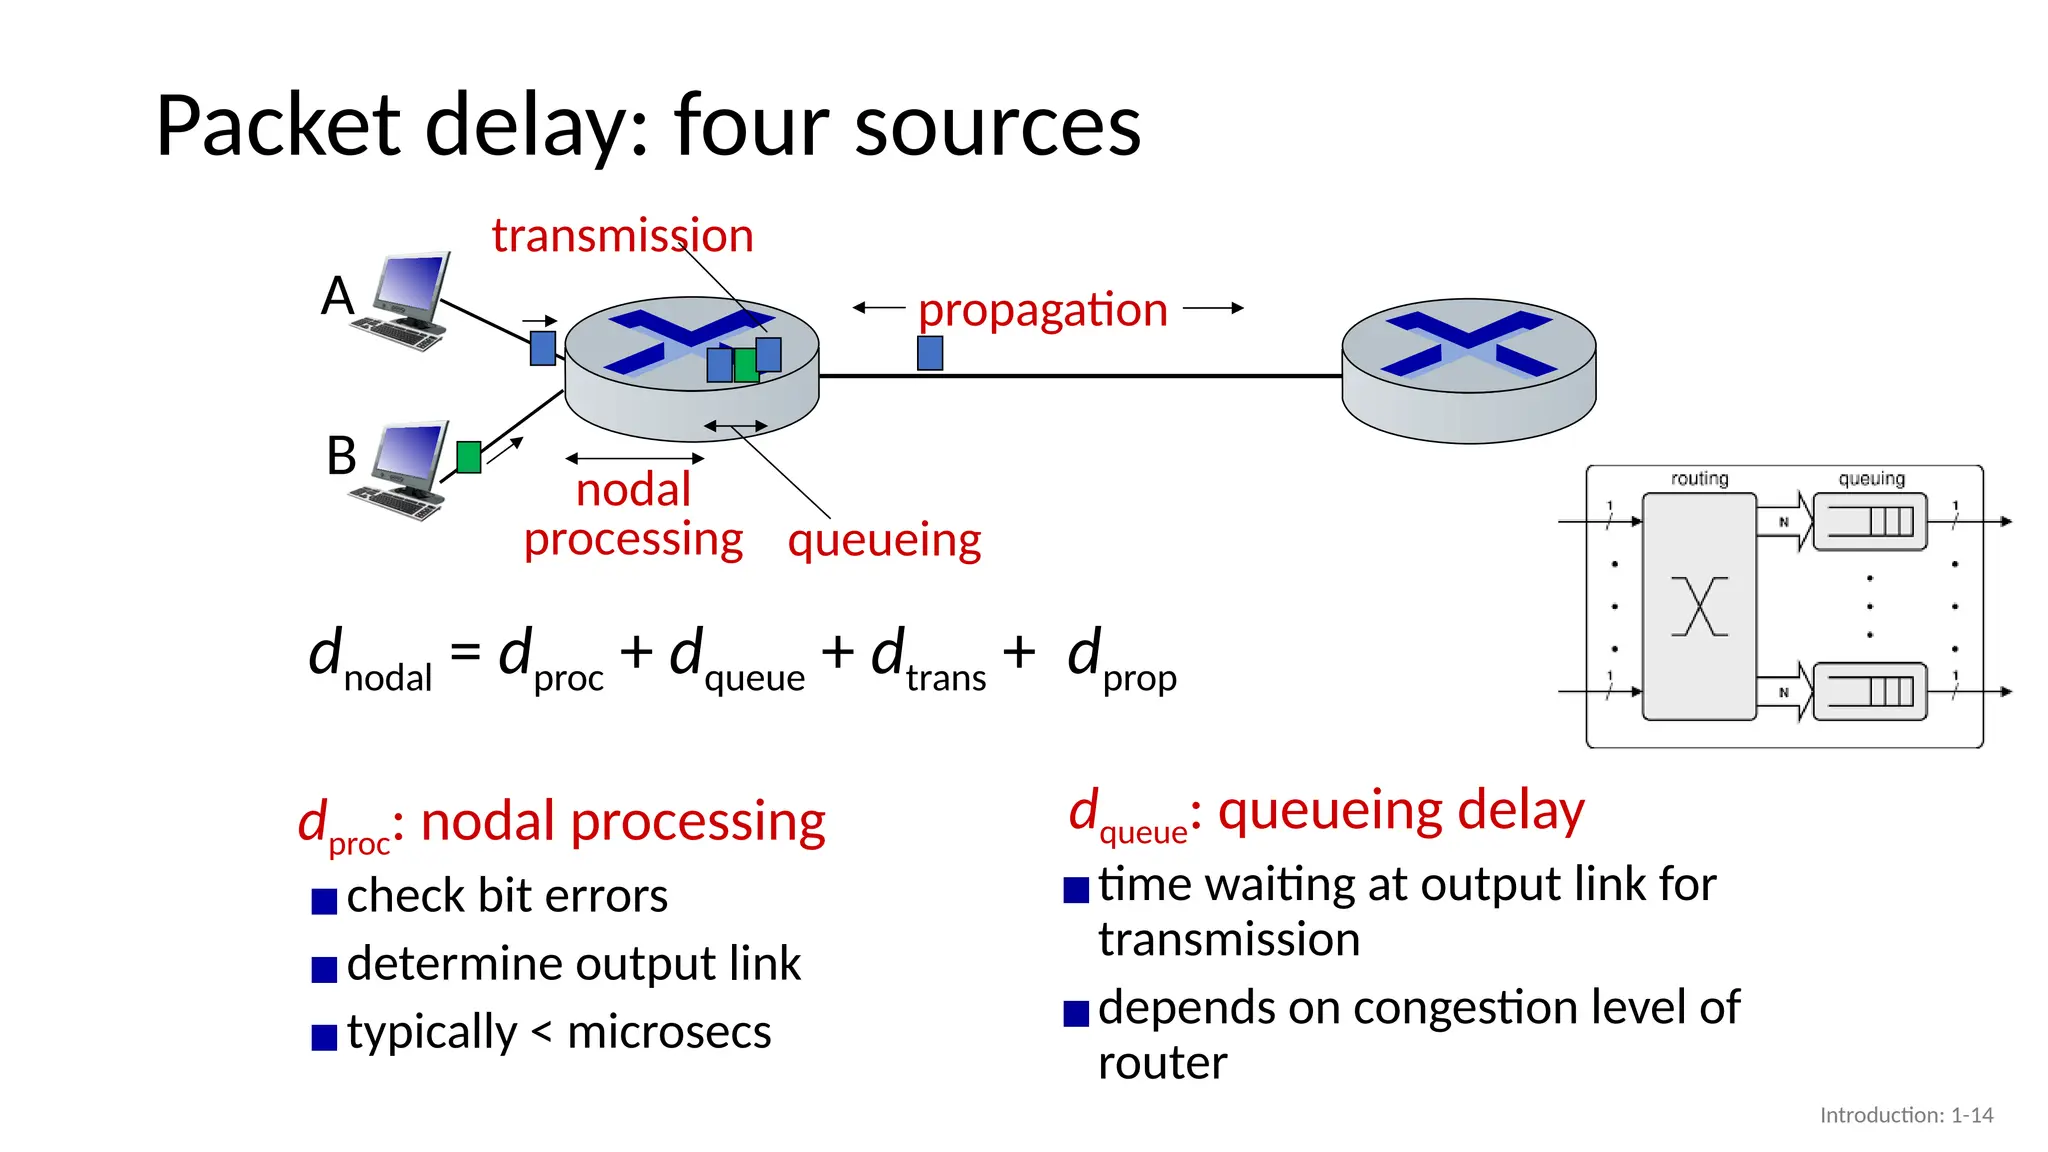
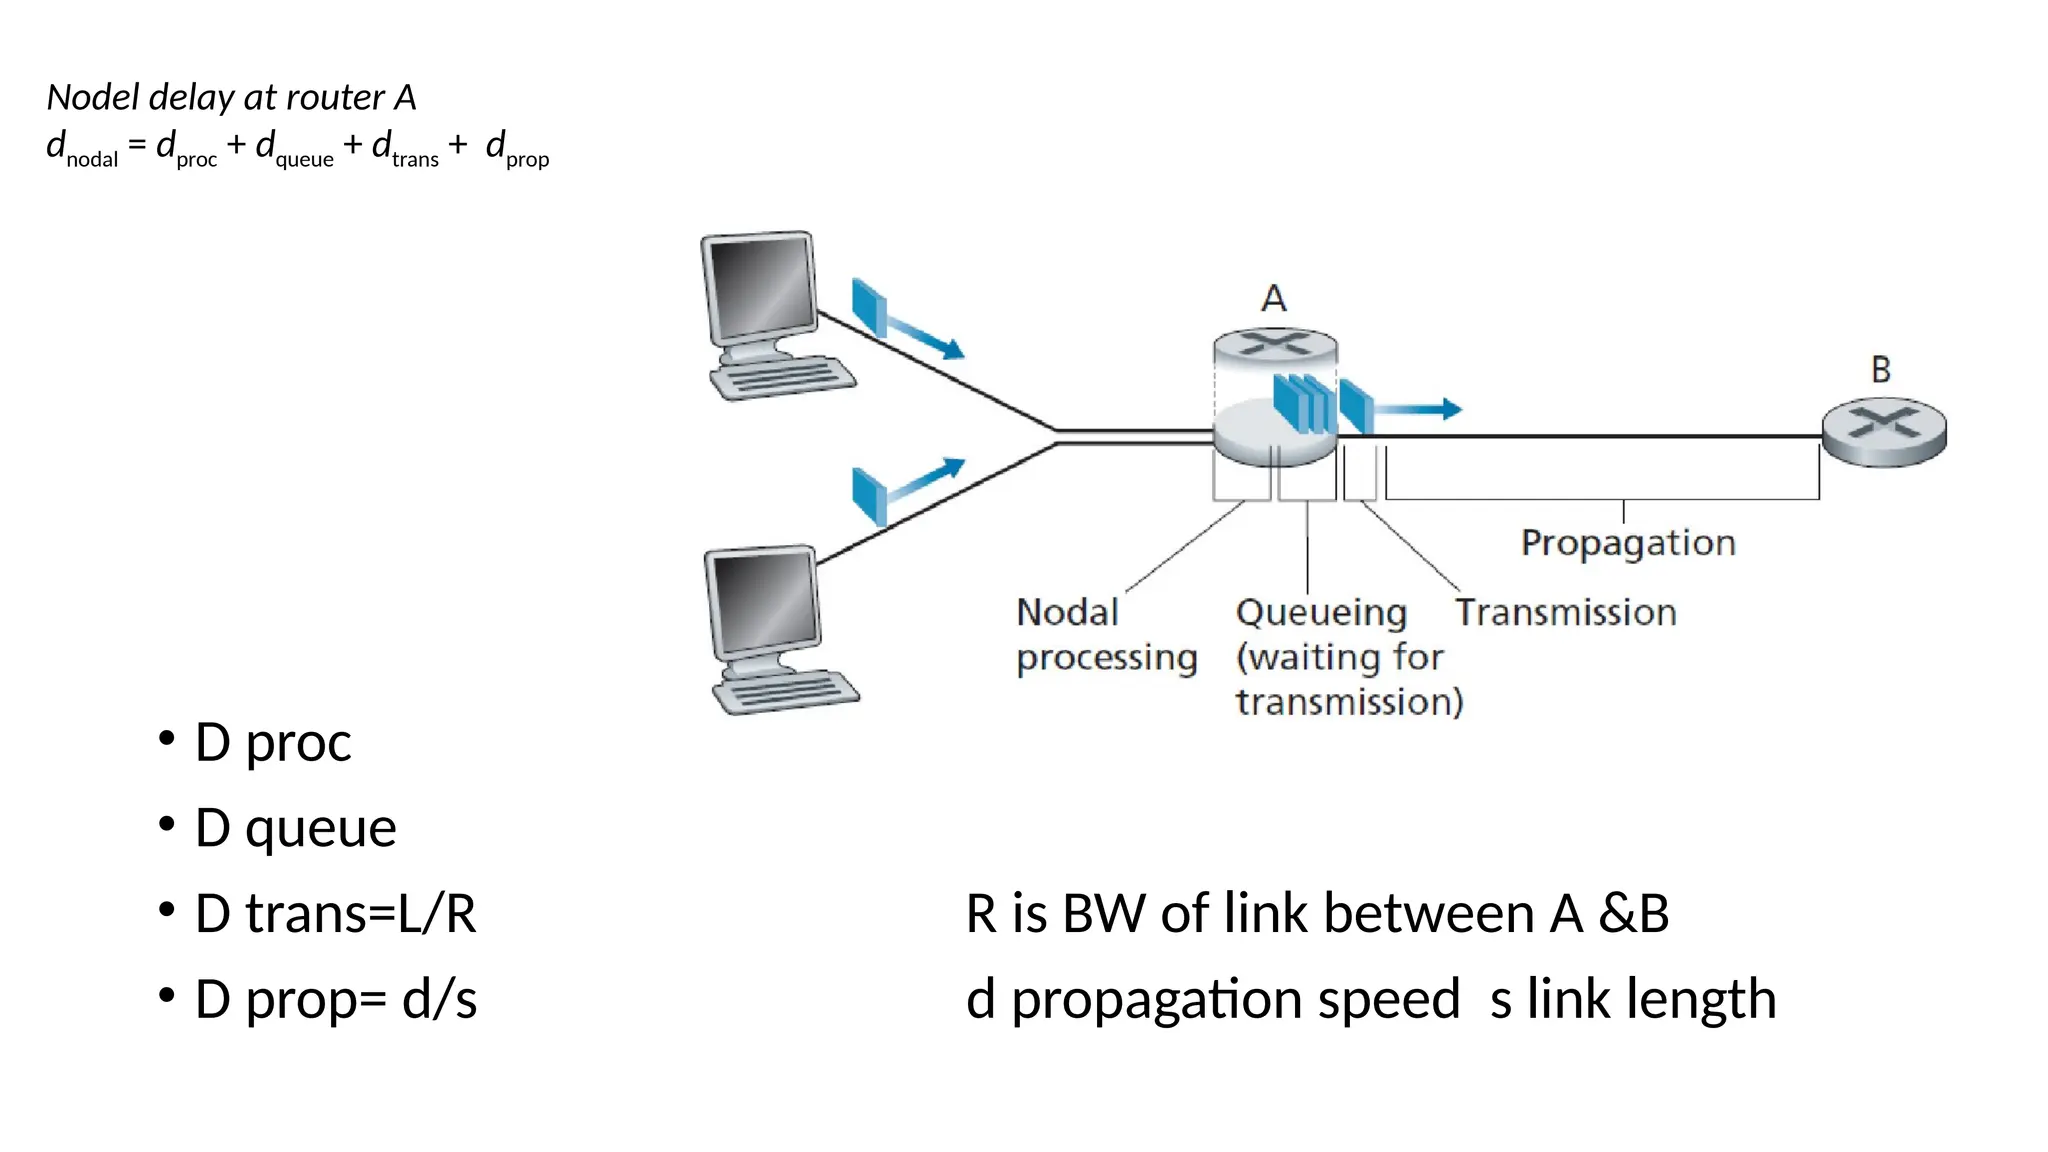
Packet delay: foursources
dproc: nodal processing
▪check bit errors
▪determine output link
▪typically < microsecs
dqueue: queueing delay
▪time waiting at output link for
transmission
▪depends on congestion level of
router
propagation
nodal
processing queueing
dnodal = dproc + dqueue + dtrans + dprop
A
B
transmission
Introduction: 1-14
15.
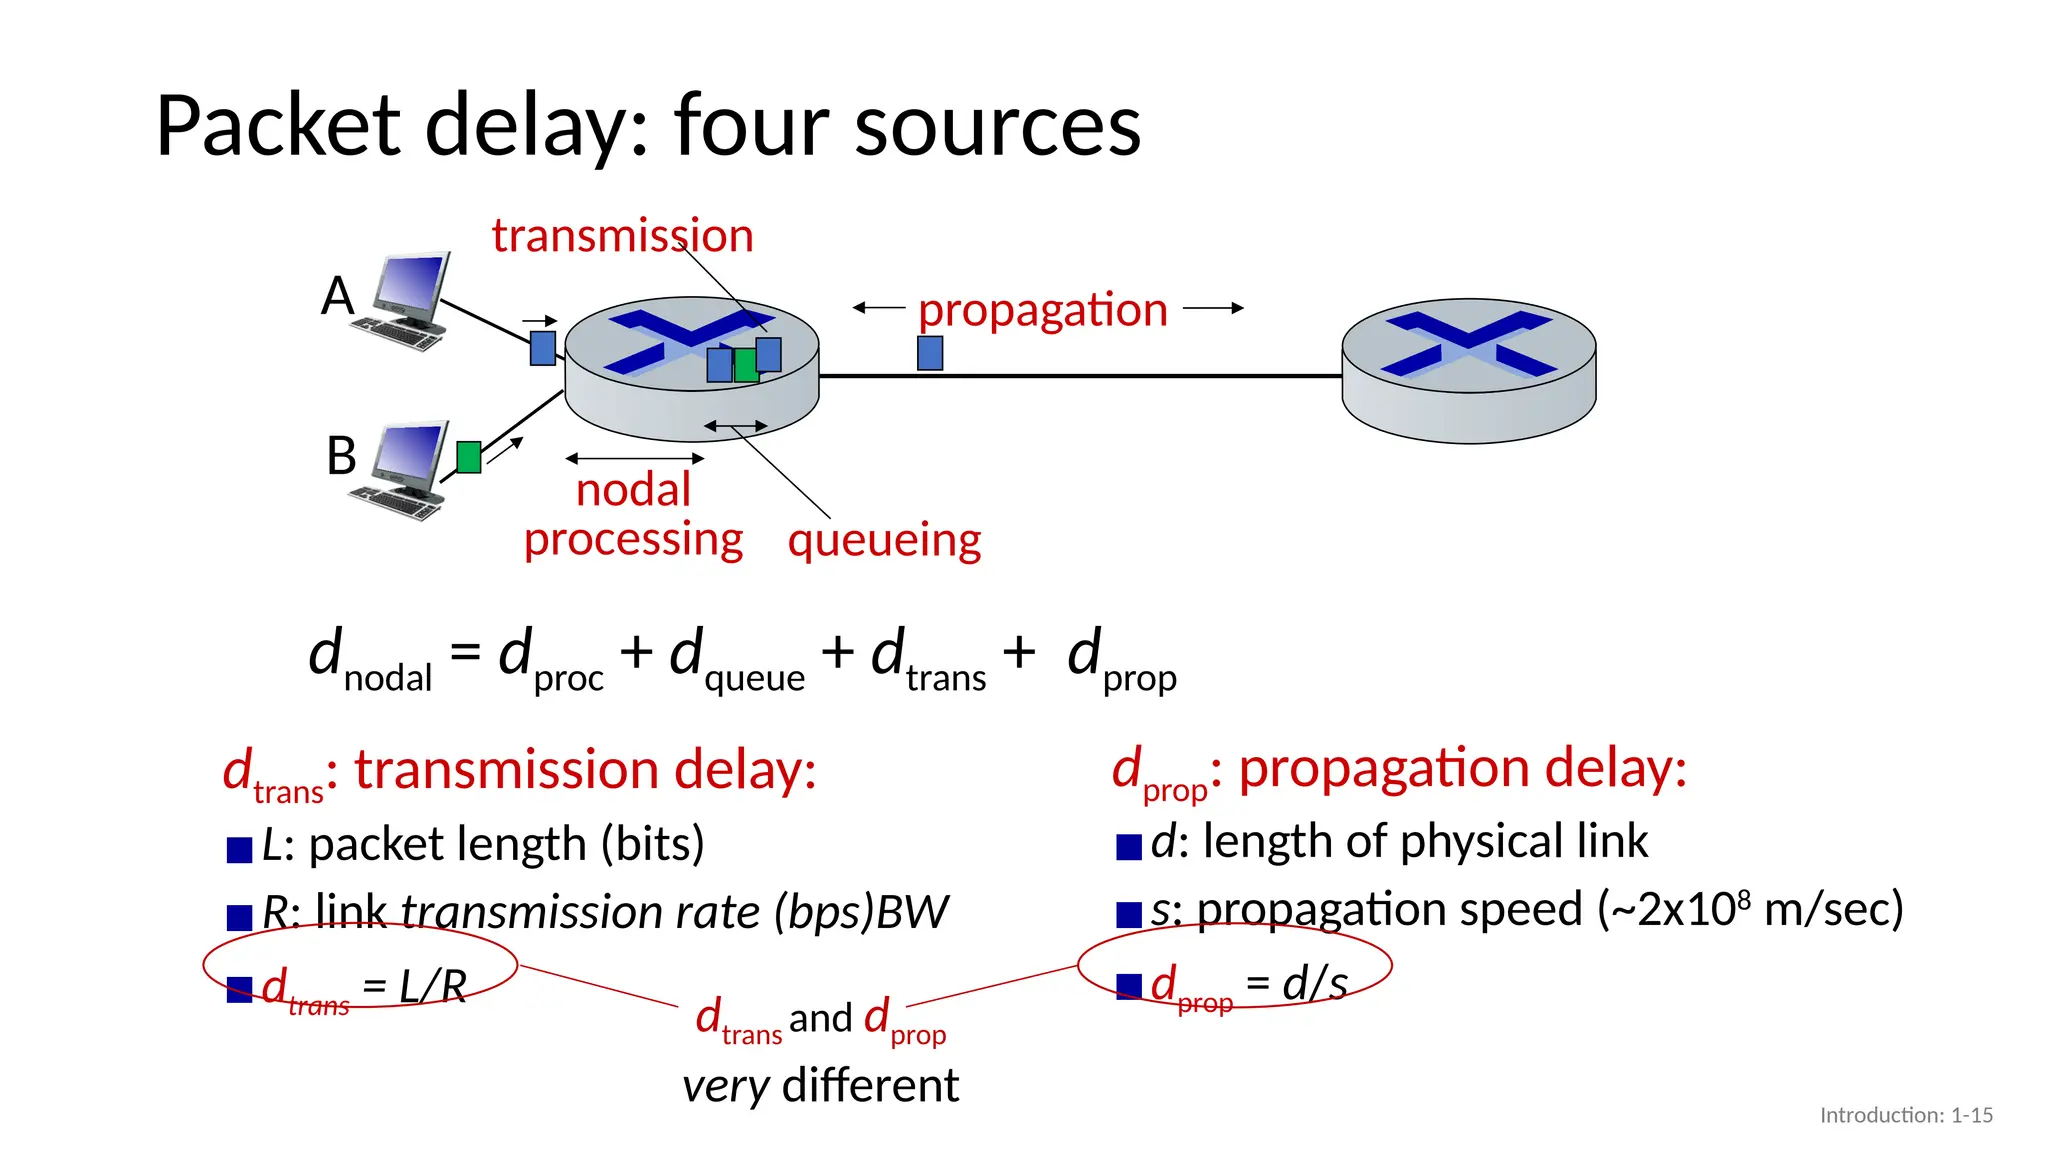
Packet delay: foursources
propagation
nodal
processing queueing
dnodal = dproc + dqueue + dtrans + dprop
A
B
transmission
dtrans: transmission delay:
▪L: packet length (bits)
▪R: link transmission rate (bps)BW
▪dtrans = L/R
dprop: propagation delay:
▪d: length of physical link
▪s: propagation speed (~2x10⁸
m/sec)
▪dprop = d/s
dtrans and dprop
very different Introduction: 1-15
16.
Nodel delay atrouter A
dnodal = dproc + dqueue + dtrans + dprop
• D proc
• D queue
• D trans=L/R R is BW of link between A &B
• D prop= d/s d propagation speed s link length
17.
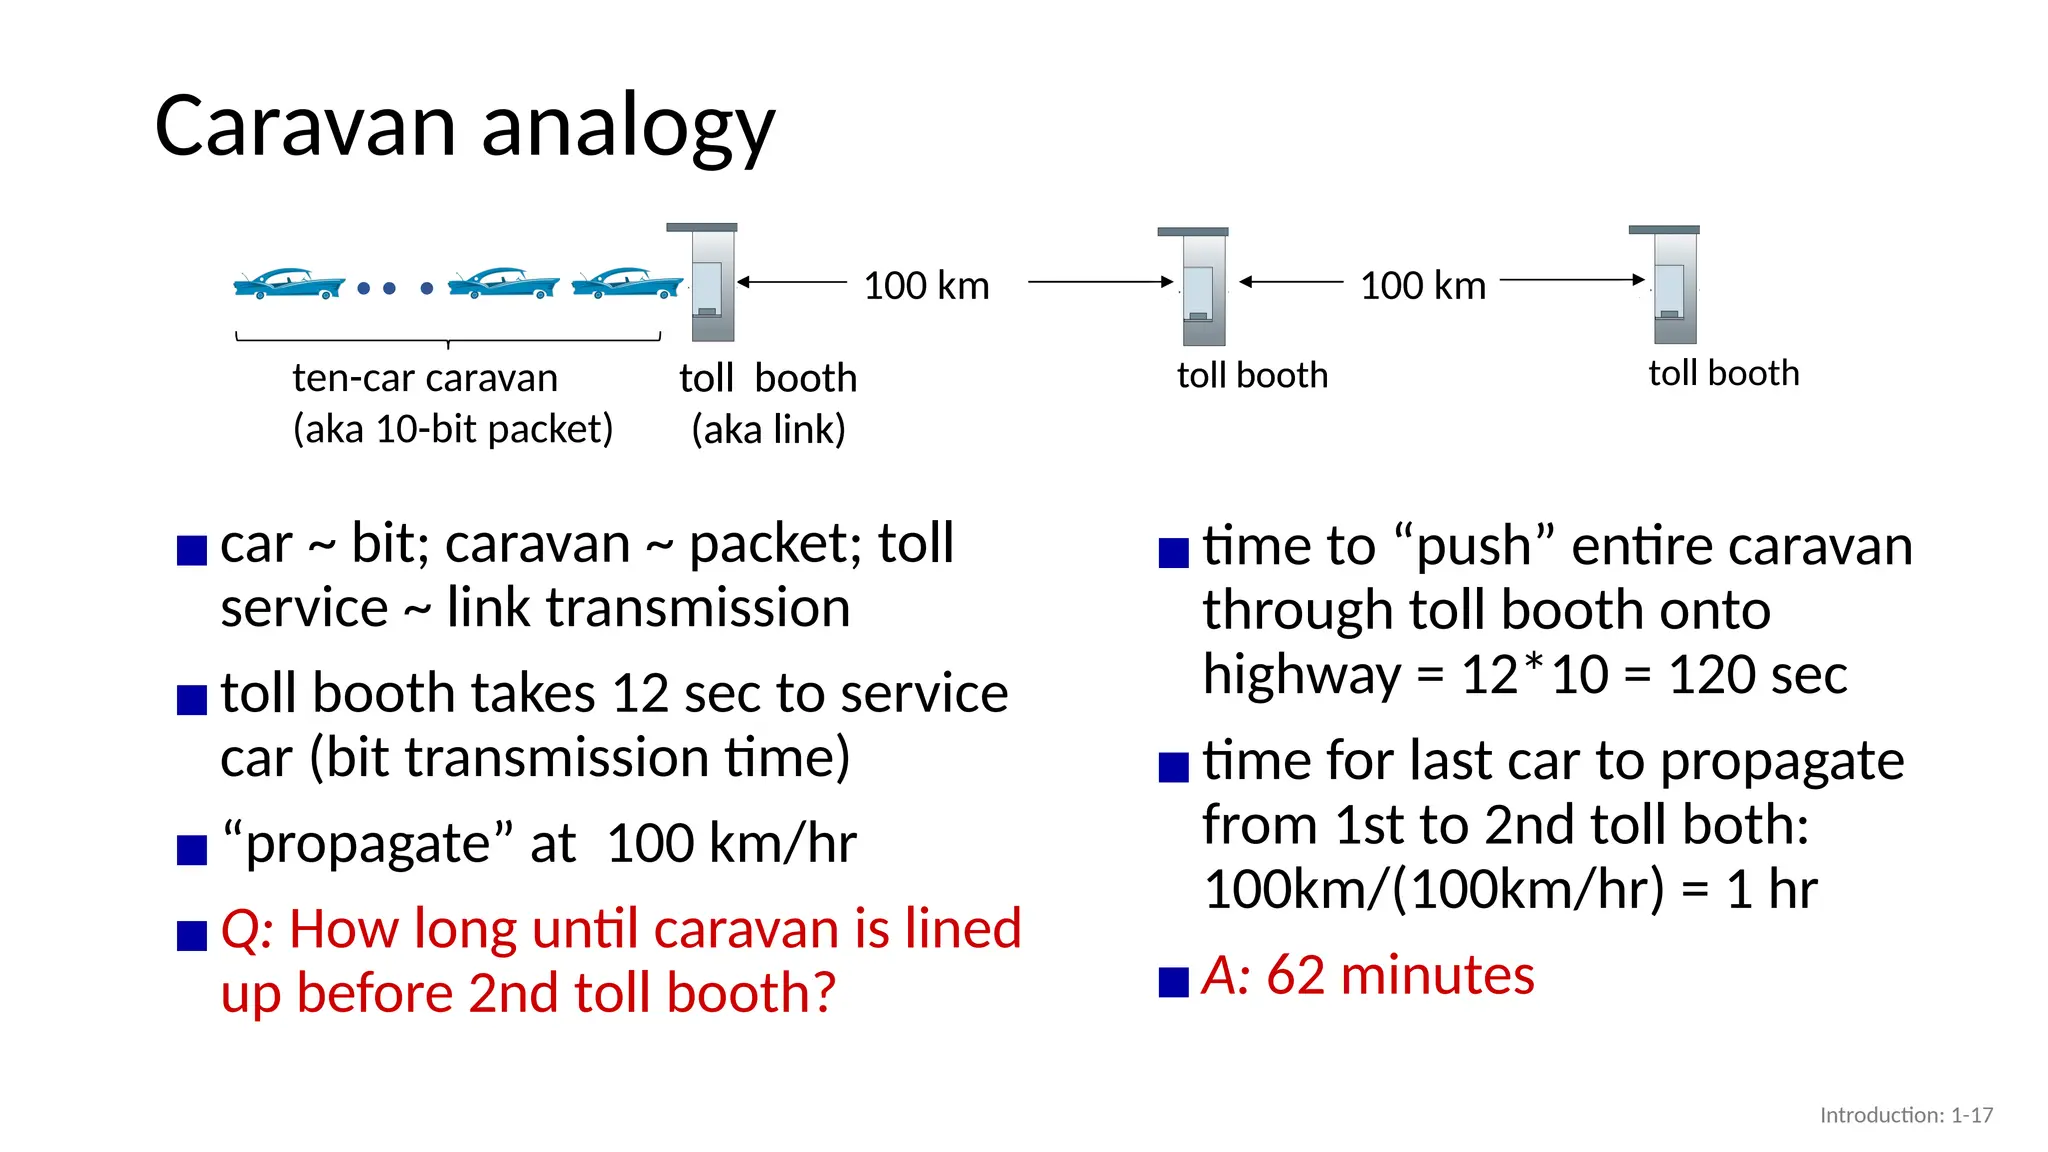
Caravan analogy
▪car ~bit; caravan ~ packet; toll
service ~ link transmission
▪toll booth takes 12 sec to service
car (bit transmission time)
▪“propagate” at 100 km/hr
▪Q: How long until caravan is lined
up before 2nd toll booth?
▪time to “push” entire caravan
through toll booth onto
highway = 12*10 = 120 sec
▪time for last car to propagate
from 1st to 2nd toll both:
100km/(100km/hr) = 1 hr
▪A: 62 minutes
toll booth
toll booth
(aka link)
ten-car caravan
(aka 10-bit packet)
100 km 100 km
toll booth
toll booth
(aka link)
toll booth
Introduction: 1-17
18.
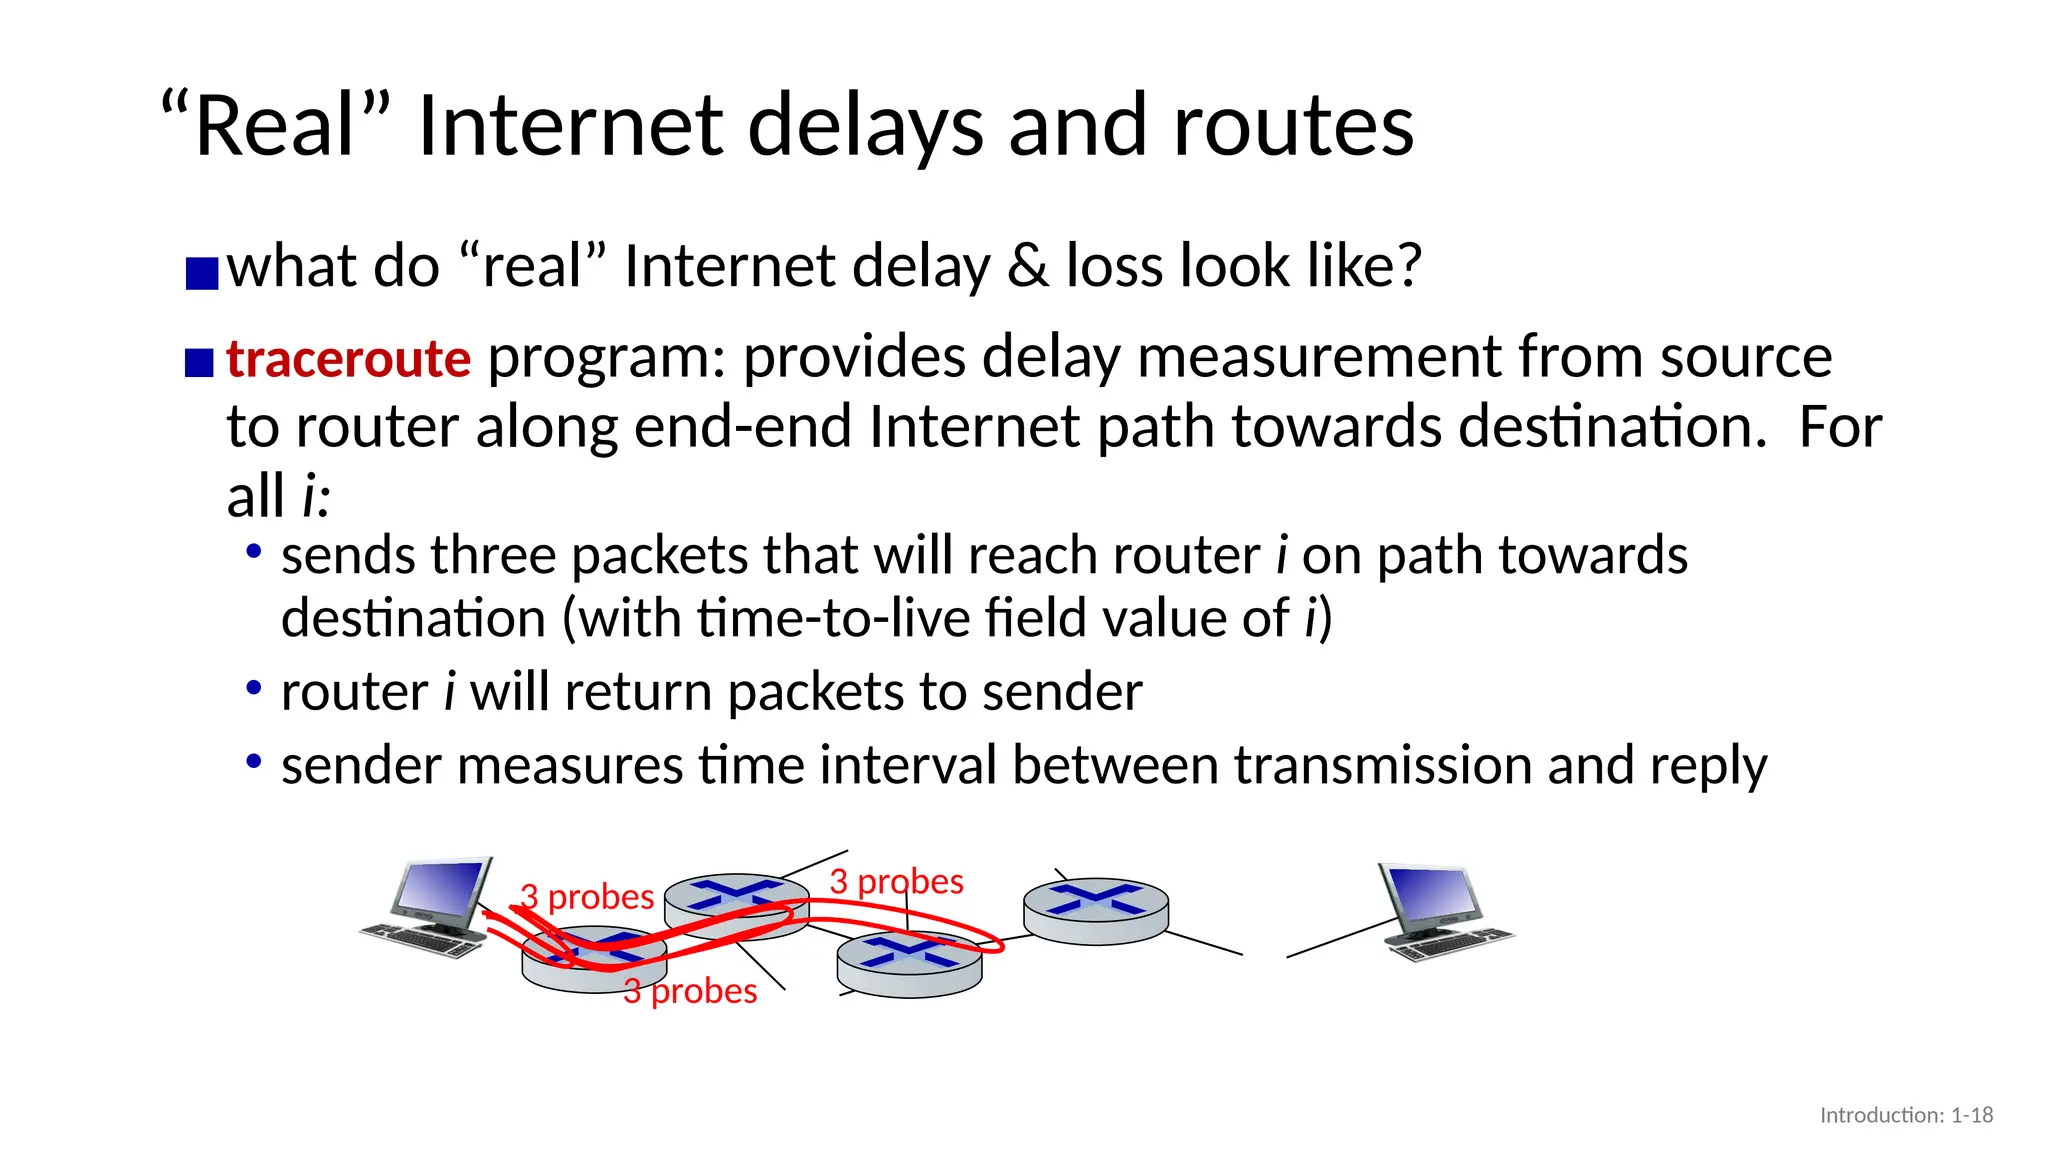
“Real” Internet delaysand routes
▪what do “real” Internet delay & loss look like?
▪traceroute program: provides delay measurement from source
to router along end-end Internet path towards destination. For
all i:
3 probes
3 probes
3 probes
• sends three packets that will reach router i on path towards
destination (with time-to-live field value of i)
• router i will return packets to sender
• sender measures time interval between transmission and reply
Introduction: 1-18
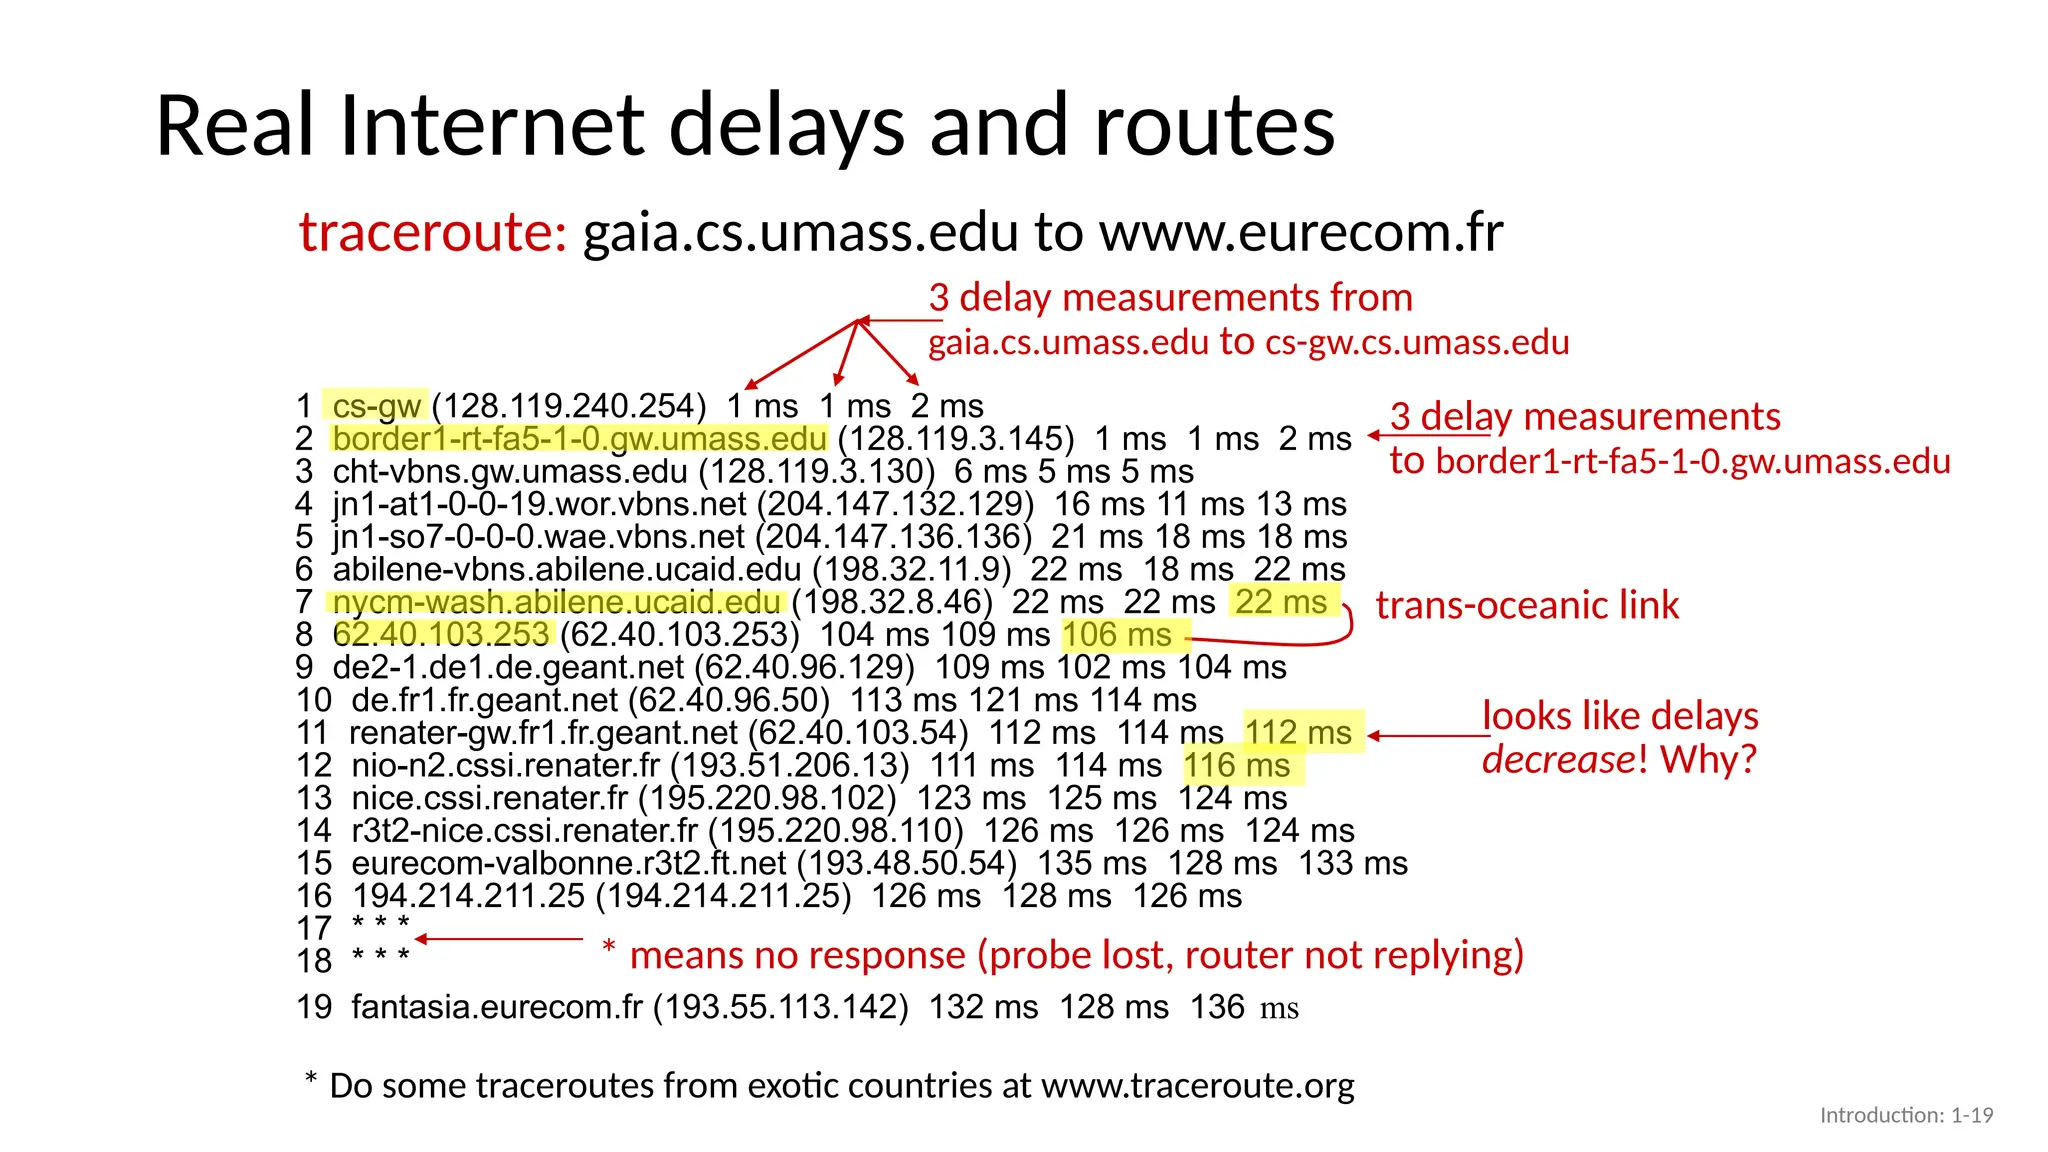
19.
Real Internet delaysand routes
1 cs-gw (128.119.240.254) 1 ms 1 ms 2 ms
2 border1-rt-fa5-1-0.gw.umass.edu (128.119.3.145) 1 ms 1 ms 2 ms
3 cht-vbns.gw.umass.edu (128.119.3.130) 6 ms 5 ms 5 ms
4 jn1-at1-0-0-19.wor.vbns.net (204.147.132.129) 16 ms 11 ms 13 ms
5 jn1-so7-0-0-0.wae.vbns.net (204.147.136.136) 21 ms 18 ms 18 ms
6 abilene-vbns.abilene.ucaid.edu (198.32.11.9) 22 ms 18 ms 22 ms
7 nycm-wash.abilene.ucaid.edu (198.32.8.46) 22 ms 22 ms 22 ms
8 62.40.103.253 (62.40.103.253) 104 ms 109 ms 106 ms
9 de2-1.de1.de.geant.net (62.40.96.129) 109 ms 102 ms 104 ms
10 de.fr1.fr.geant.net (62.40.96.50) 113 ms 121 ms 114 ms
11 renater-gw.fr1.fr.geant.net (62.40.103.54) 112 ms 114 ms 112 ms
12 nio-n2.cssi.renater.fr (193.51.206.13) 111 ms 114 ms 116 ms
13 nice.cssi.renater.fr (195.220.98.102) 123 ms 125 ms 124 ms
14 r3t2-nice.cssi.renater.fr (195.220.98.110) 126 ms 126 ms 124 ms
15 eurecom-valbonne.r3t2.ft.net (193.48.50.54) 135 ms 128 ms 133 ms
16 194.214.211.25 (194.214.211.25) 126 ms 128 ms 126 ms
17 * * *
18 * * *
19 fantasia.eurecom.fr (193.55.113.142) 132 ms 128 ms 136 ms
traceroute: gaia.cs.umass.edu to www.eurecom.fr
* Do some traceroutes from exotic countries at www.traceroute.org
* means no response (probe lost, router not replying)
3 delay measurements from
gaia.cs.umass.edu to cs-gw.cs.umass.edu
3 delay measurements
to border1-rt-fa5-1-0.gw.umass.edu
looks like delays
decrease! Why?
trans-oceanic link
Introduction: 1-19
20.
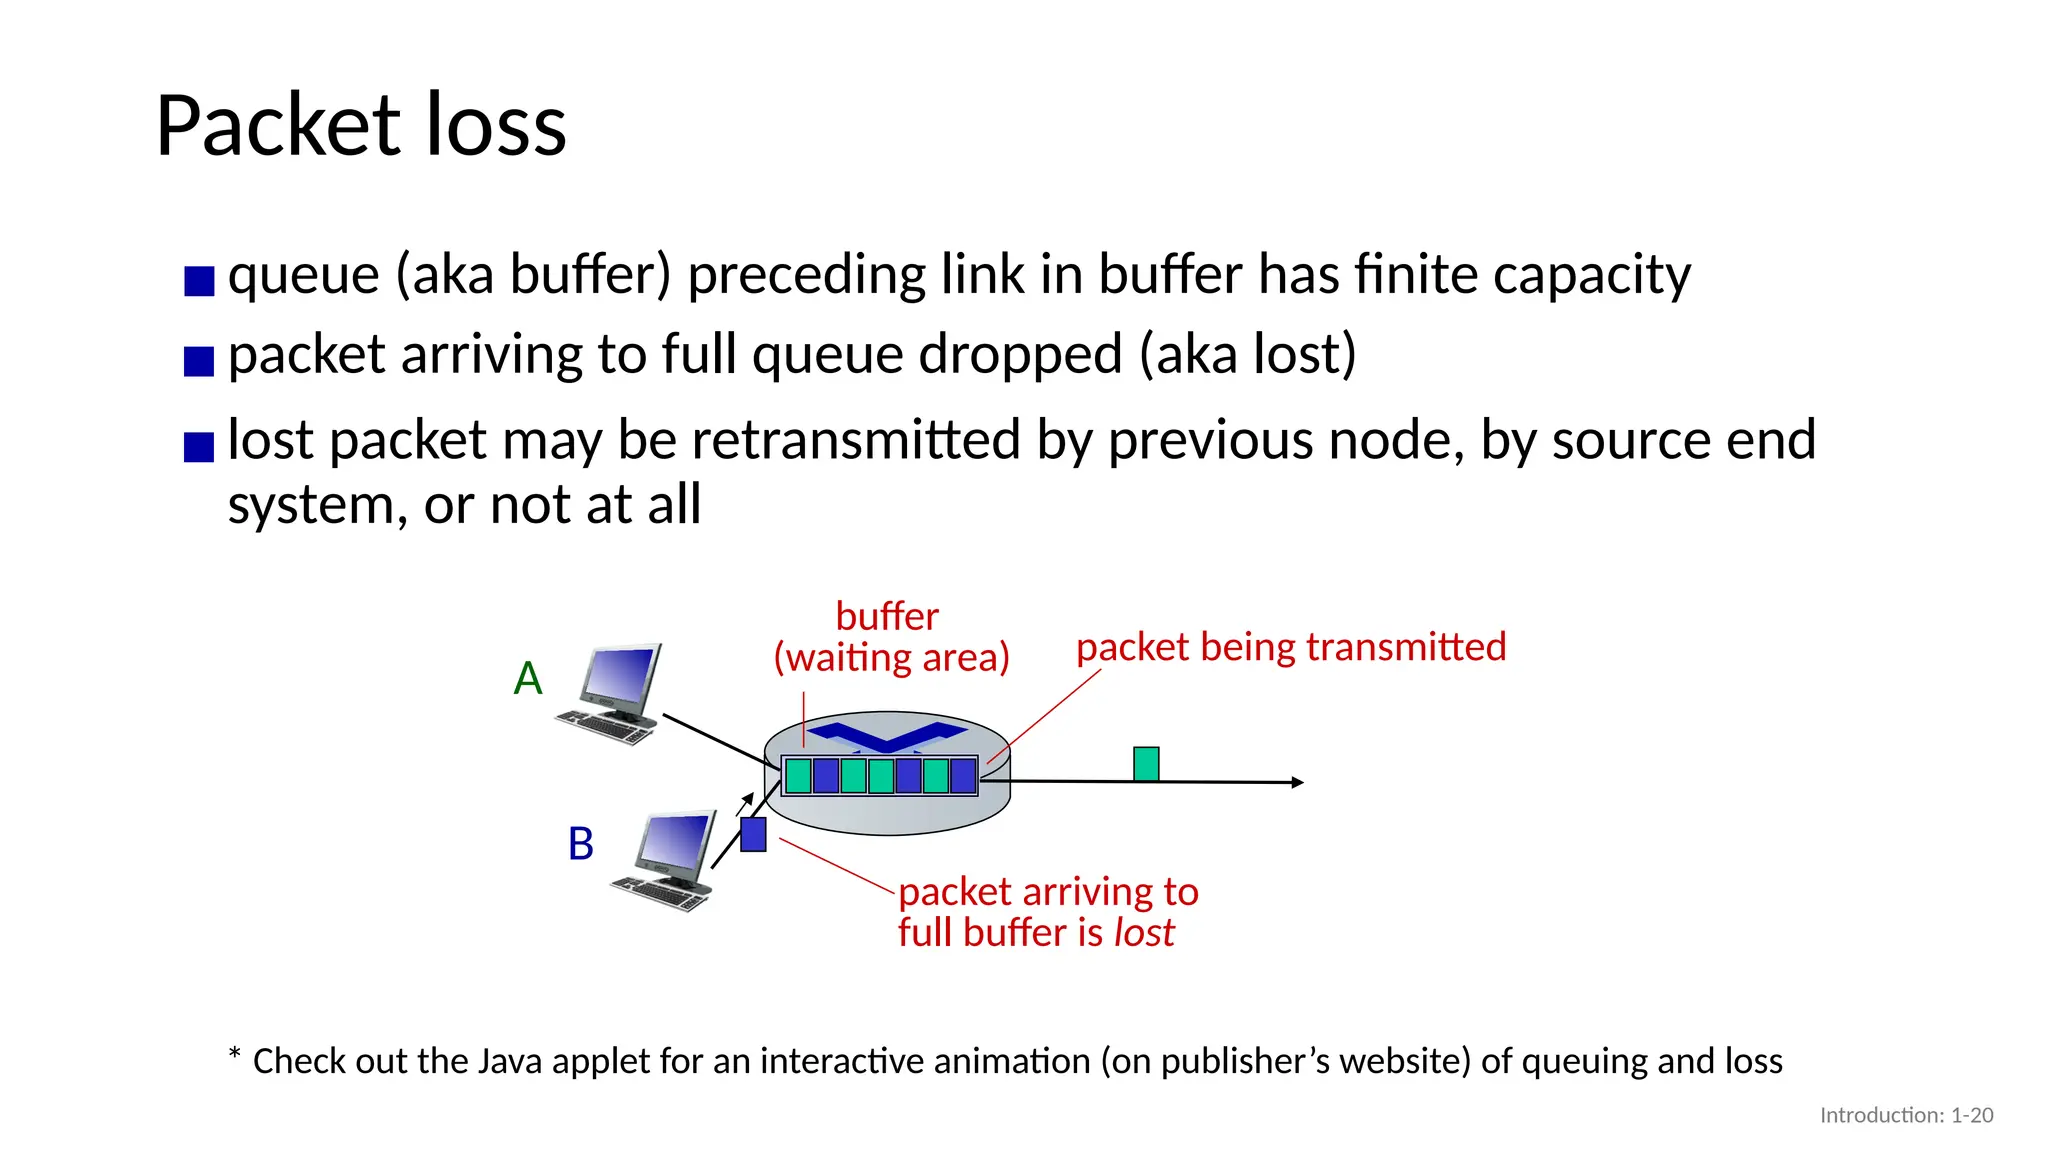
Packet loss
▪queue (akabuffer) preceding link in buffer has finite capacity
A
B
packet being transmitted
buffer
(waiting area)
* Check out the Java applet for an interactive animation (on publisher’s website) of queuing and loss
packet arriving to
full buffer is lost
▪packet arriving to full queue dropped (aka lost)
▪lost packet may be retransmitted by previous node, by source end
system, or not at all
Introduction: 1-20
21.
Throughput
▪throughput: rate (bits/timeunit) at which bits are being sent from
sender to receiver
• instantaneous: rate at given point in time
• average: rate over longer period of time
server, with
file of F bits
to send to client
link capacity
Rs bits/sec
link capacity
Rc bits/sec
server sends bits
(fluid) into pipe
pipe that can carry
fluid at rate
(Rs bits/sec)
pipe that can carry
fluid at rate
(Rc bits/sec)
Introduction: 1-21
22.
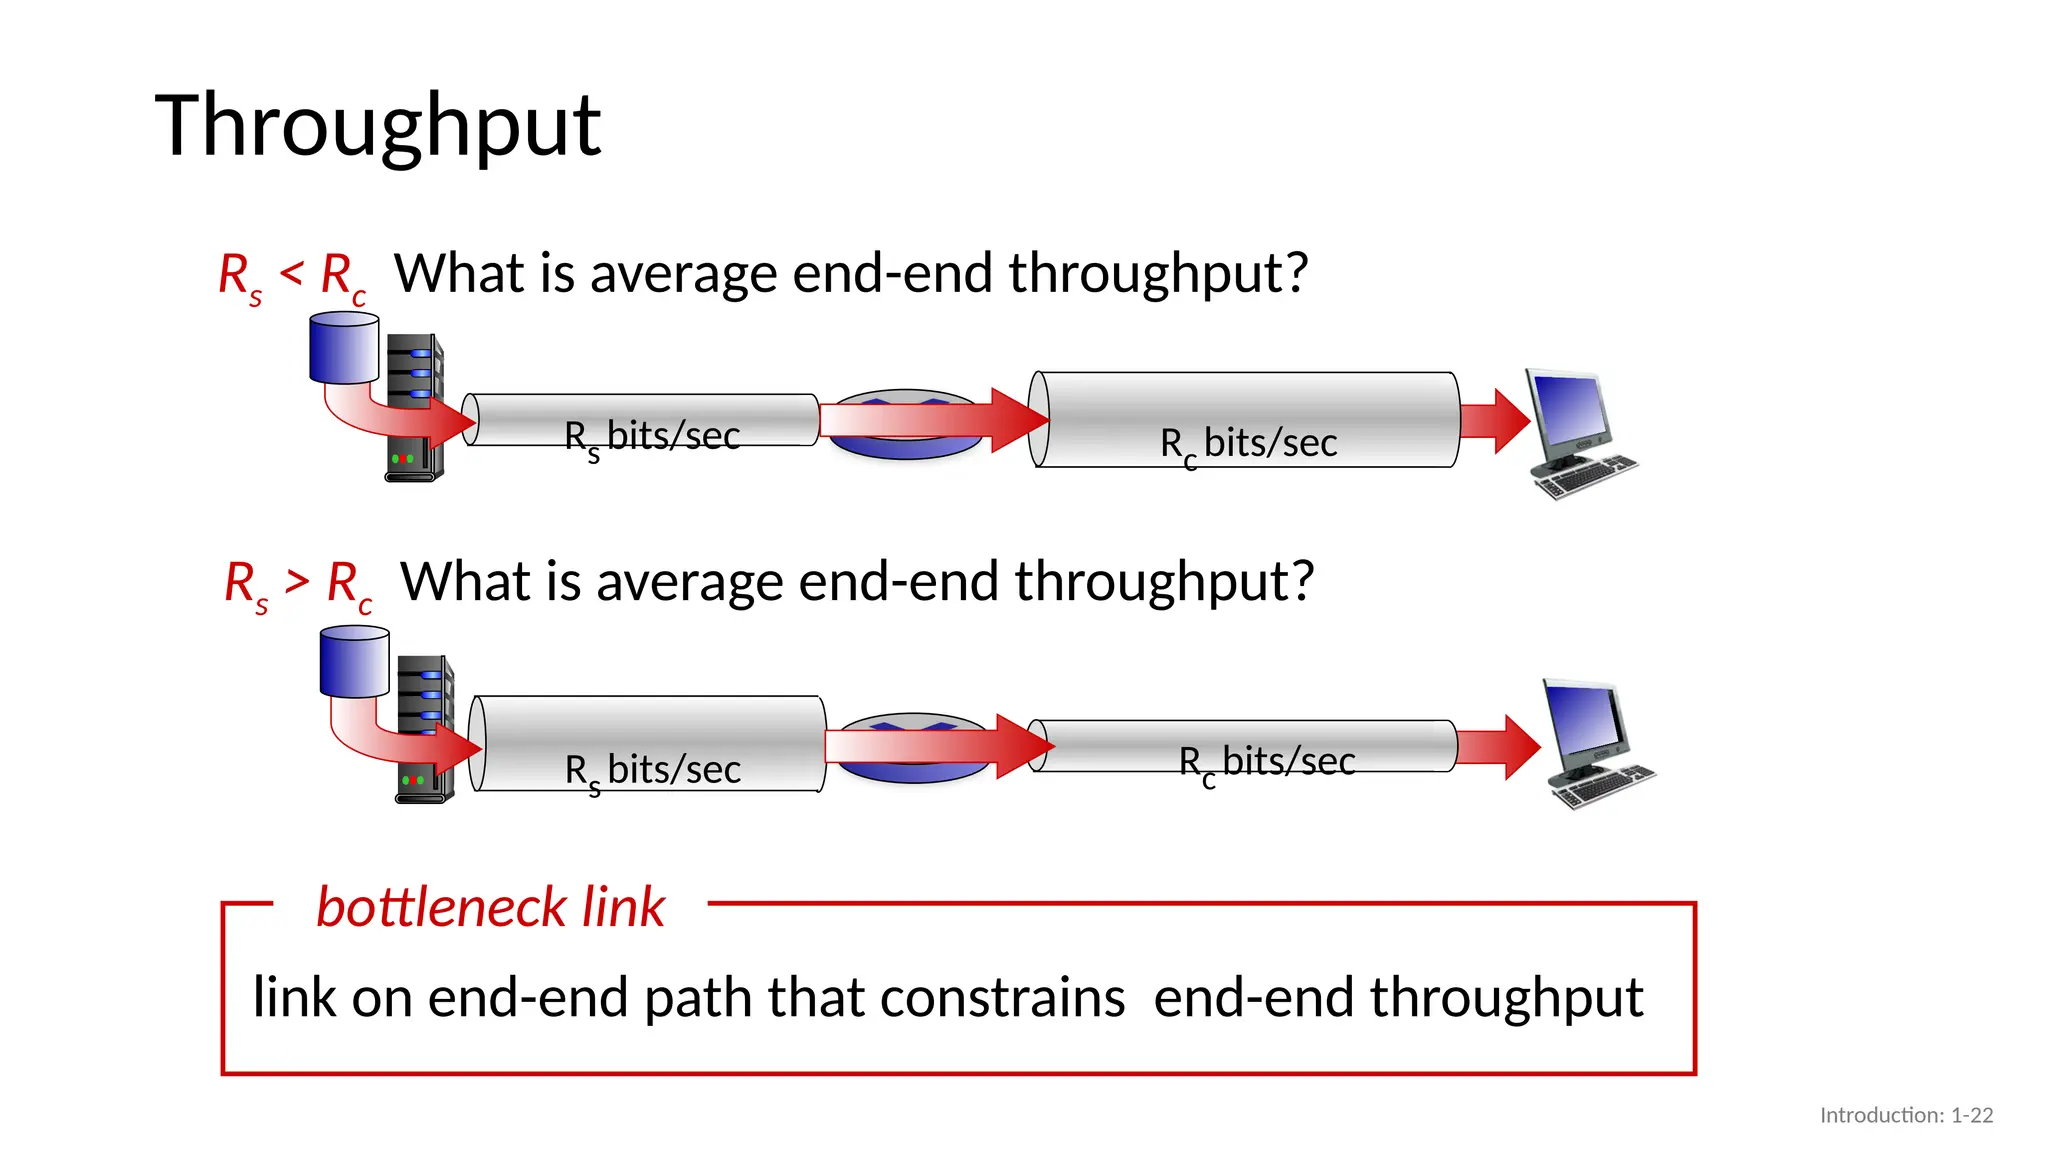
Throughput
Rs < RcWhat is average end-end throughput?
Rs bits/sec Rc bits/sec
Rs > Rc What is average end-end throughput?
link on end-end path that constrains end-end throughput
bottleneck link
Rs bits/sec Rc bits/sec
Introduction: 1-22
23.
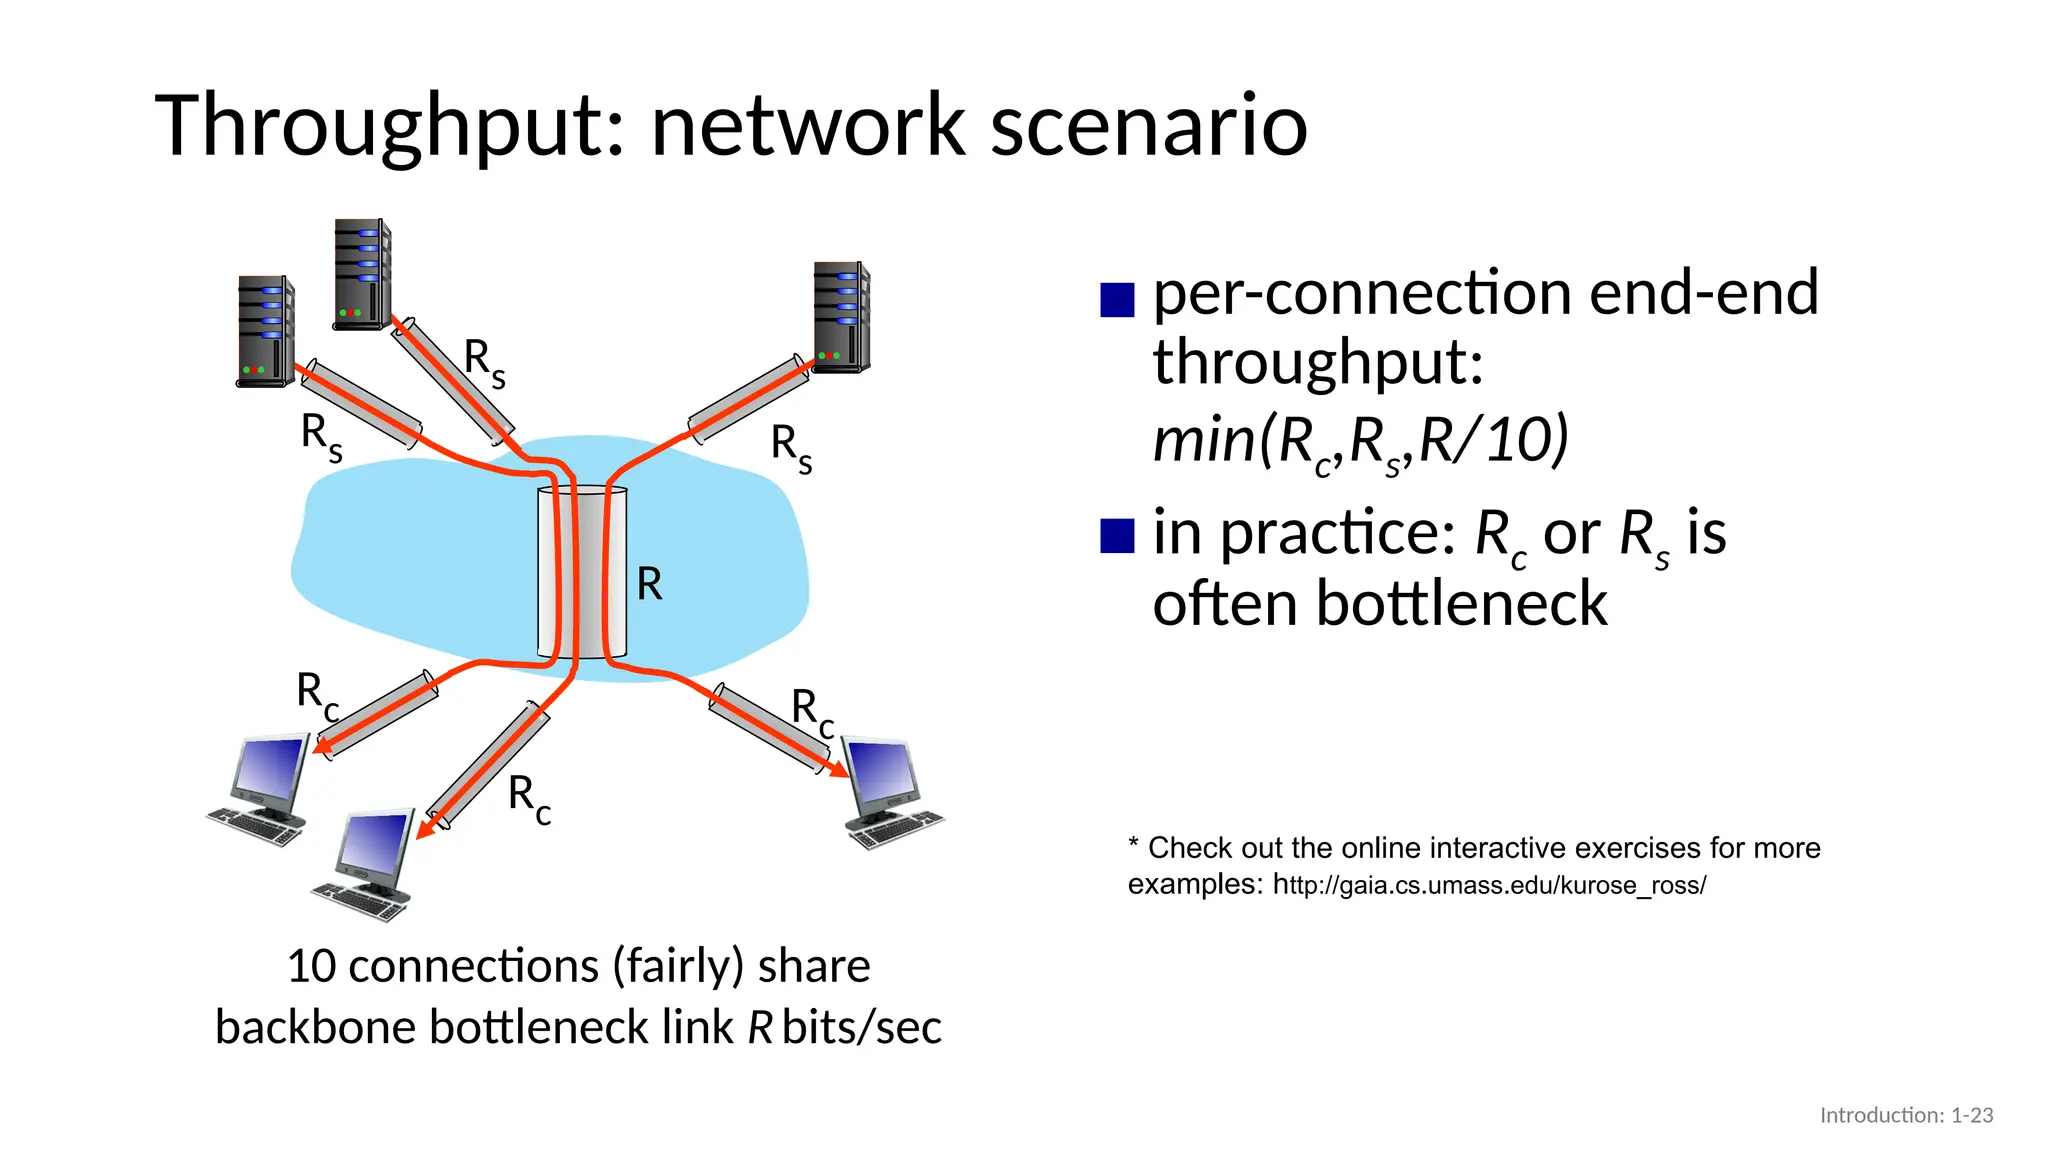
Throughput: network scenario
10connections (fairly) share
backbone bottleneck link Rbits/sec
Rs
Rs
Rs
Rc
Rc
Rc
R
▪ per-connection end-end
throughput:
min(Rc,Rs,R/10)
▪ in practice: Rc or Rs is
often bottleneck
* Check out the online interactive exercises for more
examples: http://gaia.cs.umass.edu/kurose_ross/
Introduction: 1-23
24.
Chapter 1: roadmap
Introduction:1-24
• What is the Internet?
• What is a protocol?
• Network edge: hosts, access network,
physical media
• Network core: packet/circuit
switching, internet structure
• Performance: loss, delay, throughput
• Security
• Protocol layers, service models
• History
25.
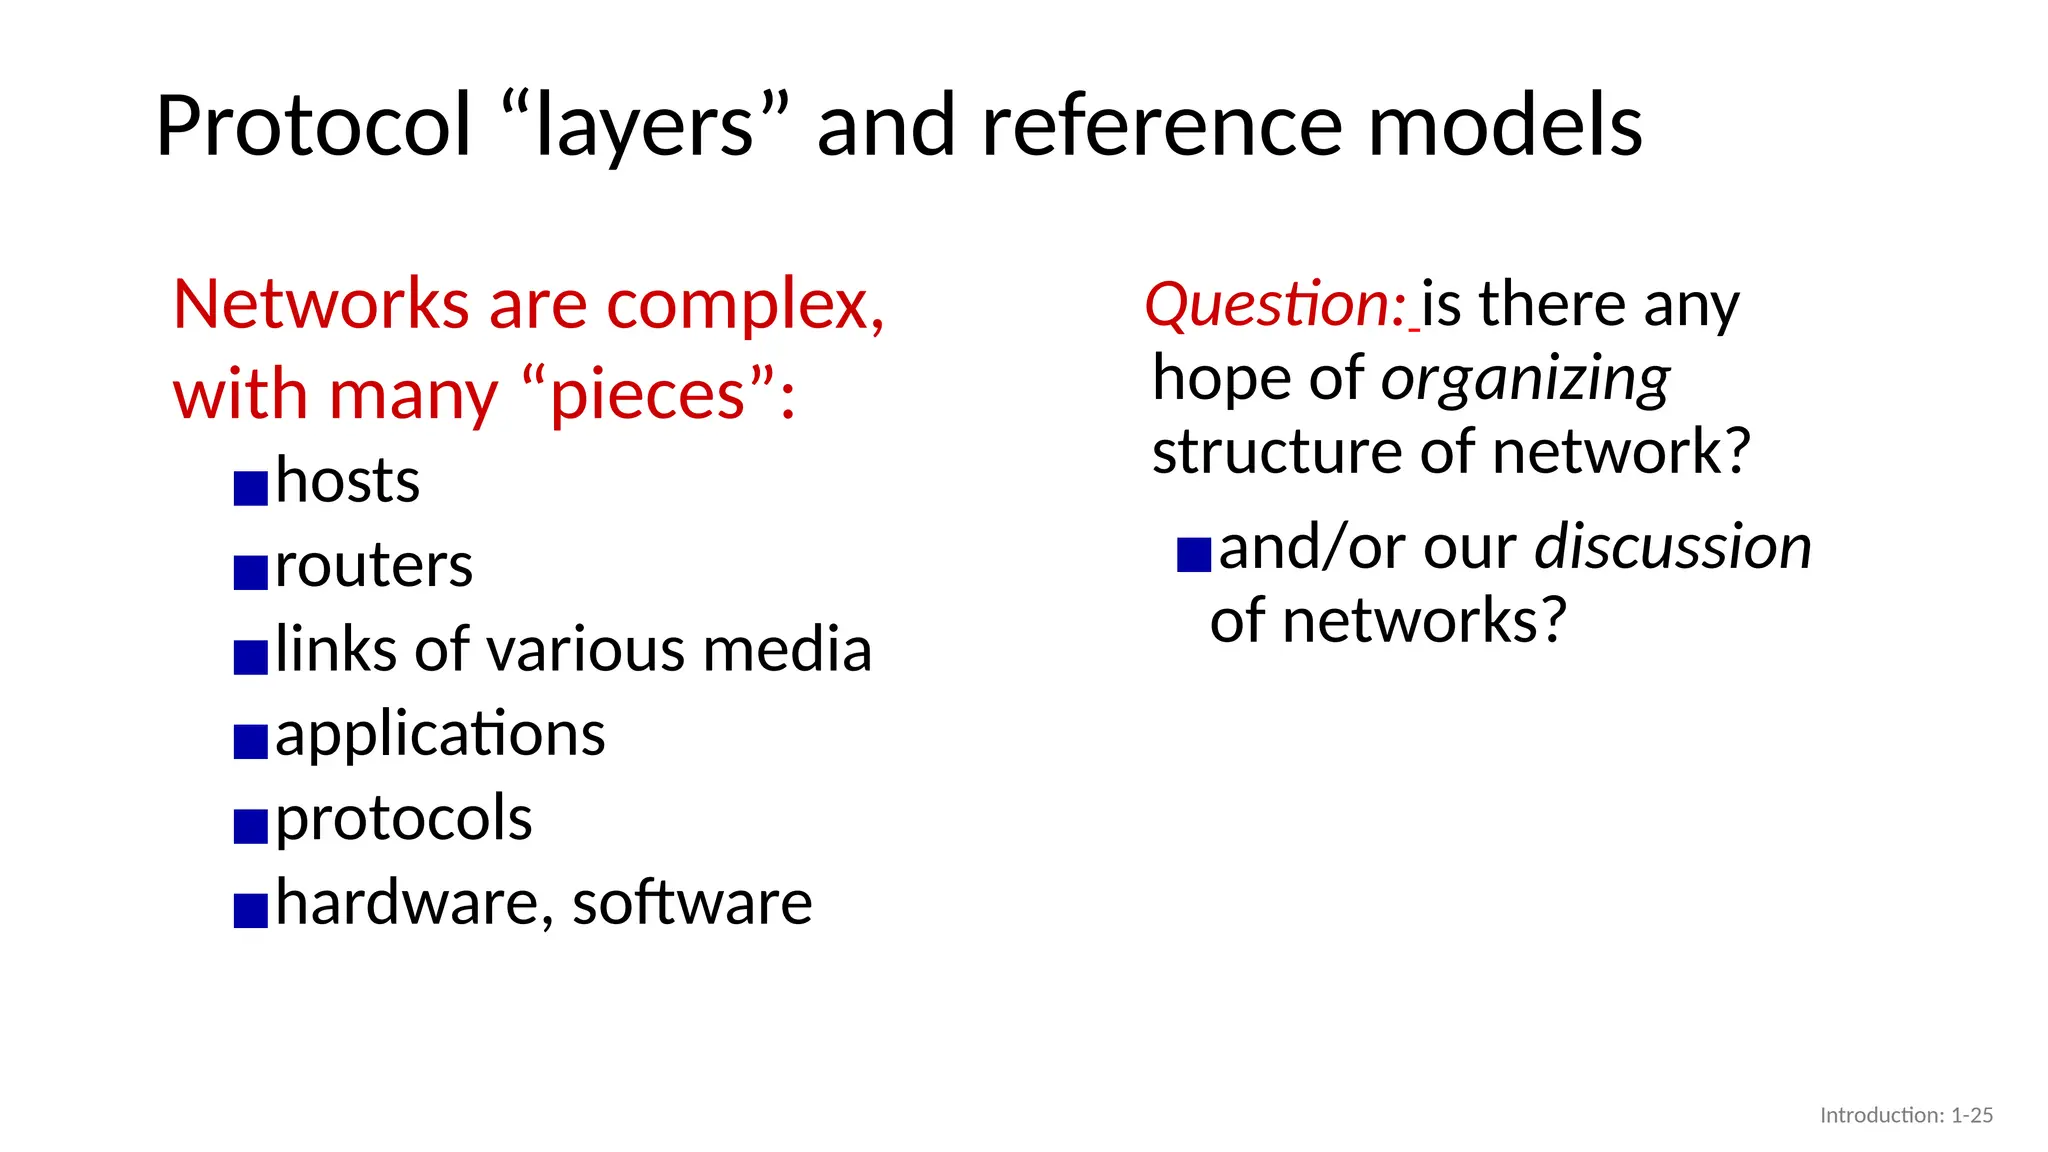
Protocol “layers” andreference models
Networks are complex,
with many “pieces”:
▪hosts
▪routers
▪links of various media
▪applications
▪protocols
▪hardware, software
Question: is there any
hope of organizing
structure of network?
▪and/or our discussion
of networks?
Introduction: 1-25
26.
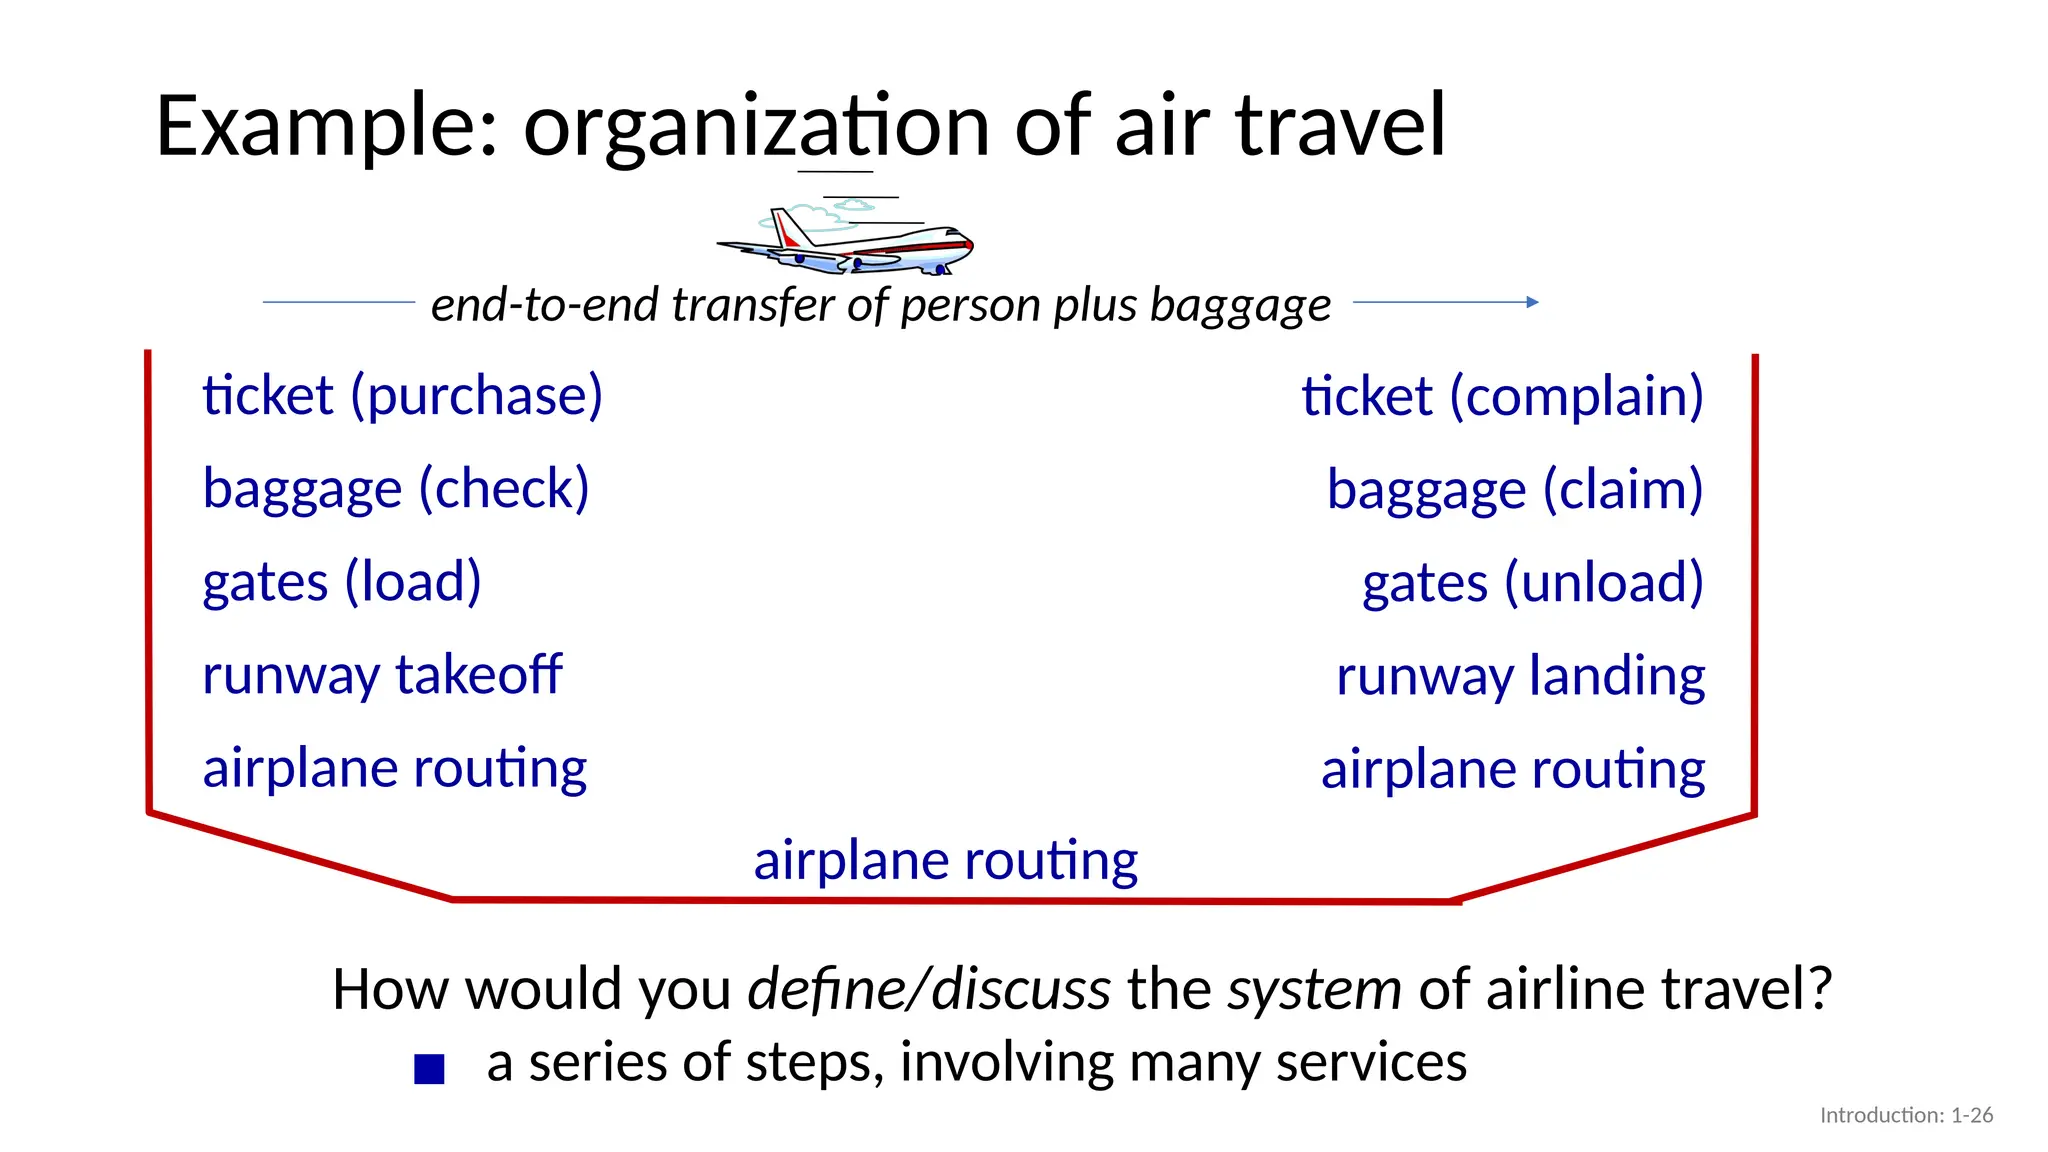
Example: organization ofair travel
▪ a series of steps, involving many services
ticket (purchase)
baggage (check)
gates (load)
runway takeoff
airplane routing
ticket (complain)
baggage (claim)
gates (unload)
runway landing
airplane routing
airplane routing
How would you define/discuss the system of airline travel?
end-to-end transfer of person plus baggage
Introduction: 1-26
27.
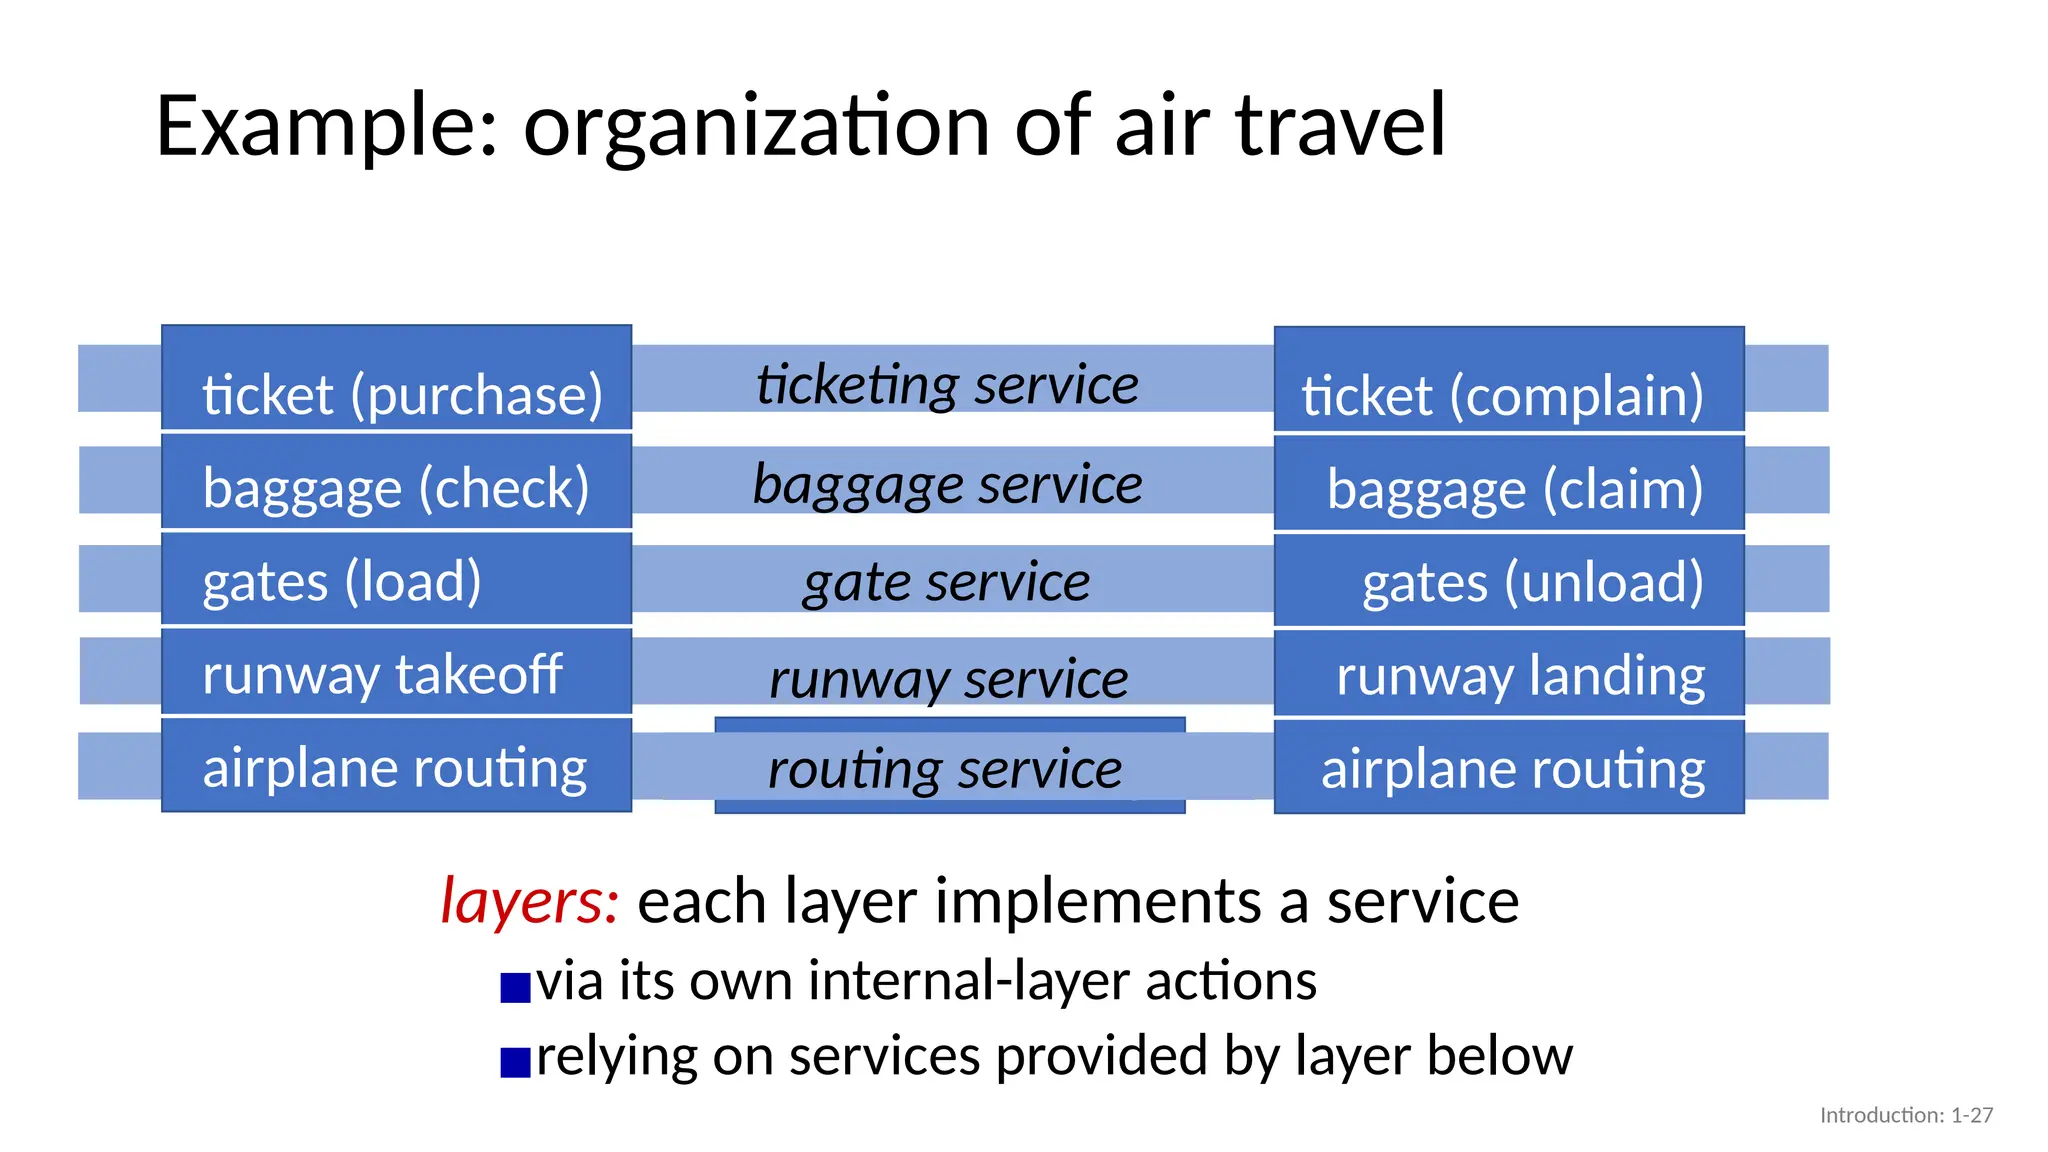
Example: organization ofair travel
ticket (purchase)
baggage (check)
gates (load)
runway takeoff
airplane routing
ticket (complain)
baggage (claim)
gates (unload)
runway landing
airplane routing
airplane routing
ticketing service
baggage service
gate service
runway service
routing service
layers: each layer implements a service
▪via its own internal-layer actions
▪relying on services provided by layer below
Introduction: 1-27
28.
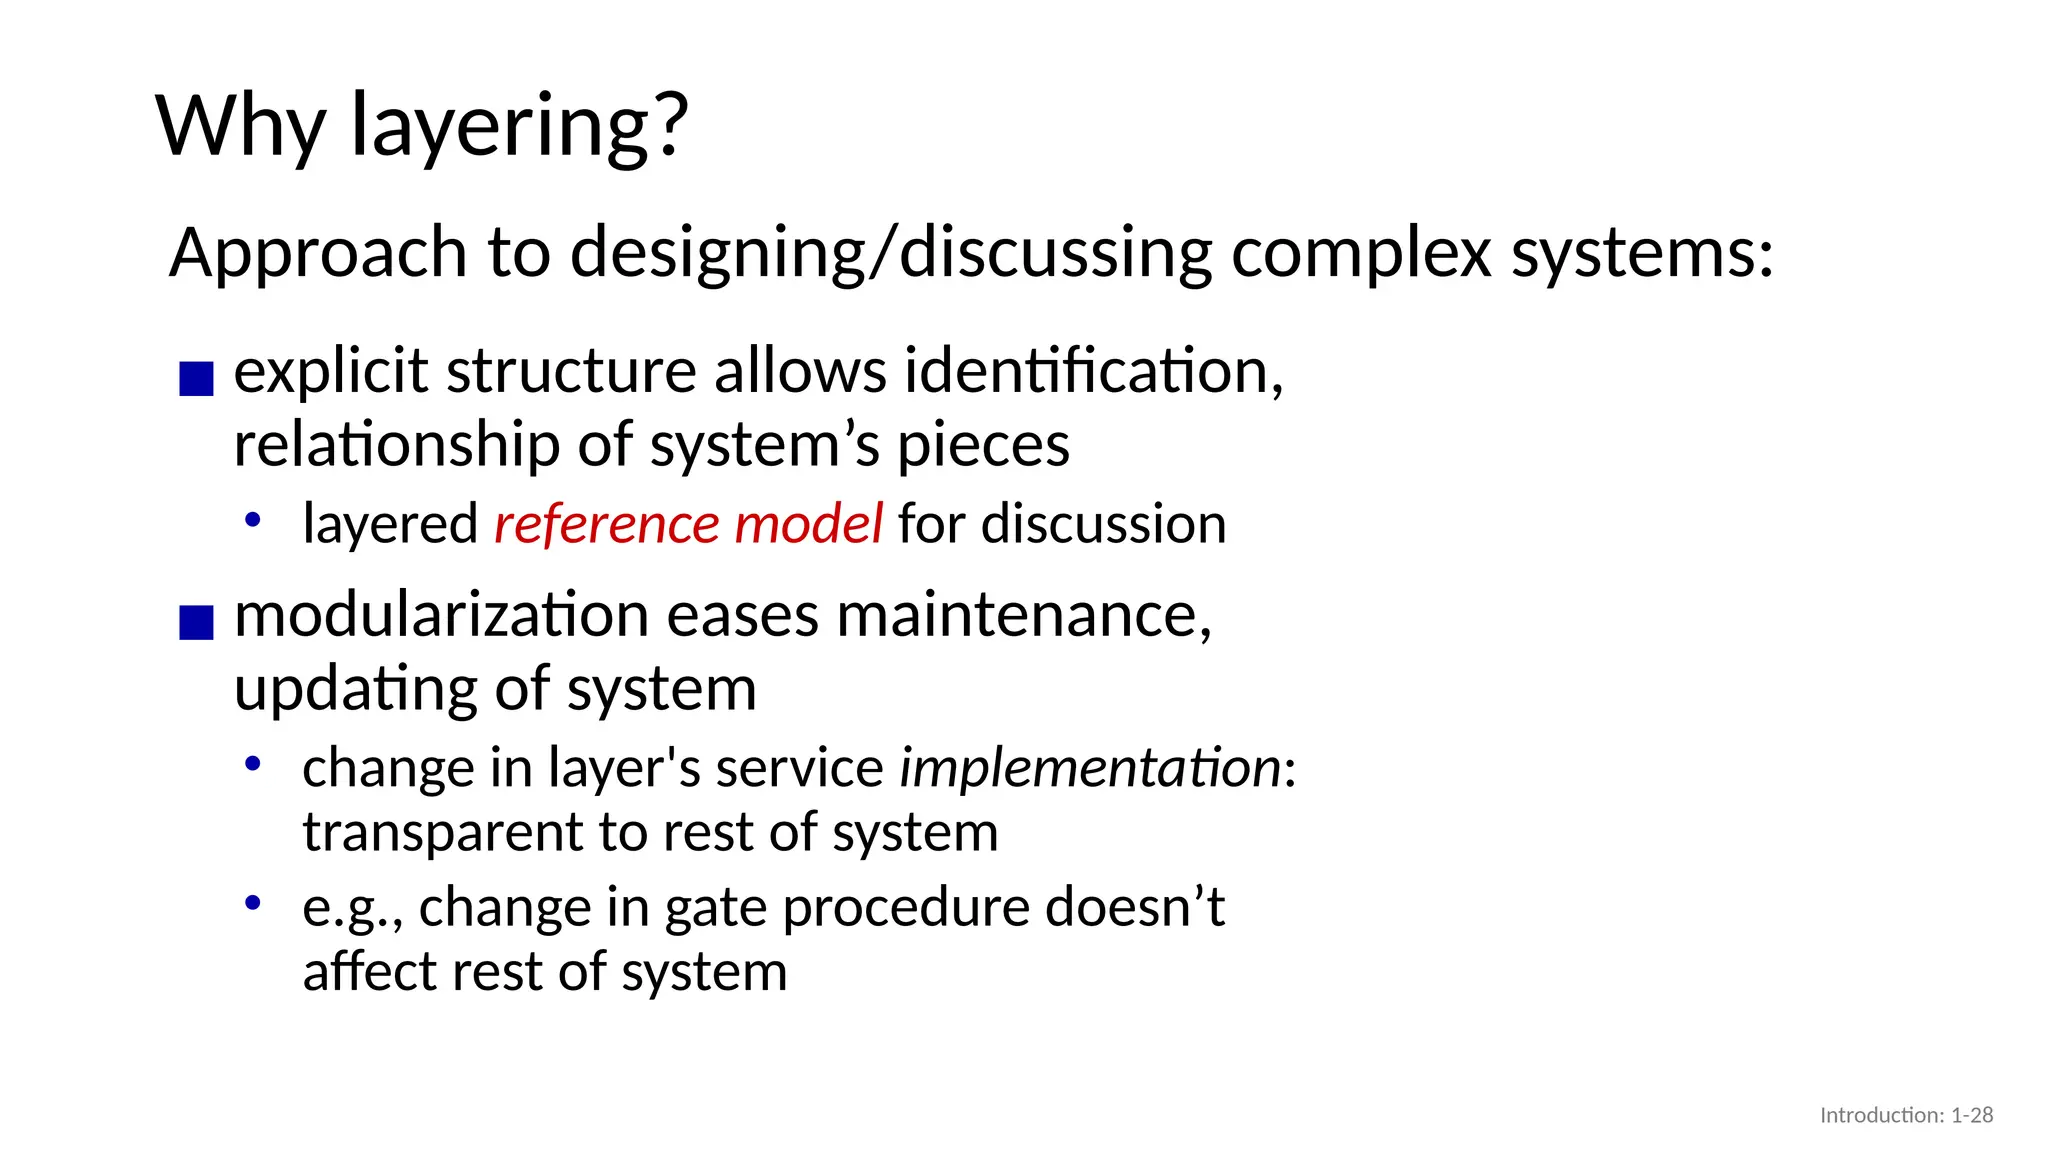
Why layering?
Approach todesigning/discussing complex systems:
▪ explicit structure allows identification,
relationship of system’s pieces
• layered reference model for discussion
▪ modularization eases maintenance,
updating of system
• change in layer's service implementation:
transparent to rest of system
• e.g., change in gate procedure doesn’t
affect rest of system
Introduction: 1-28
29.
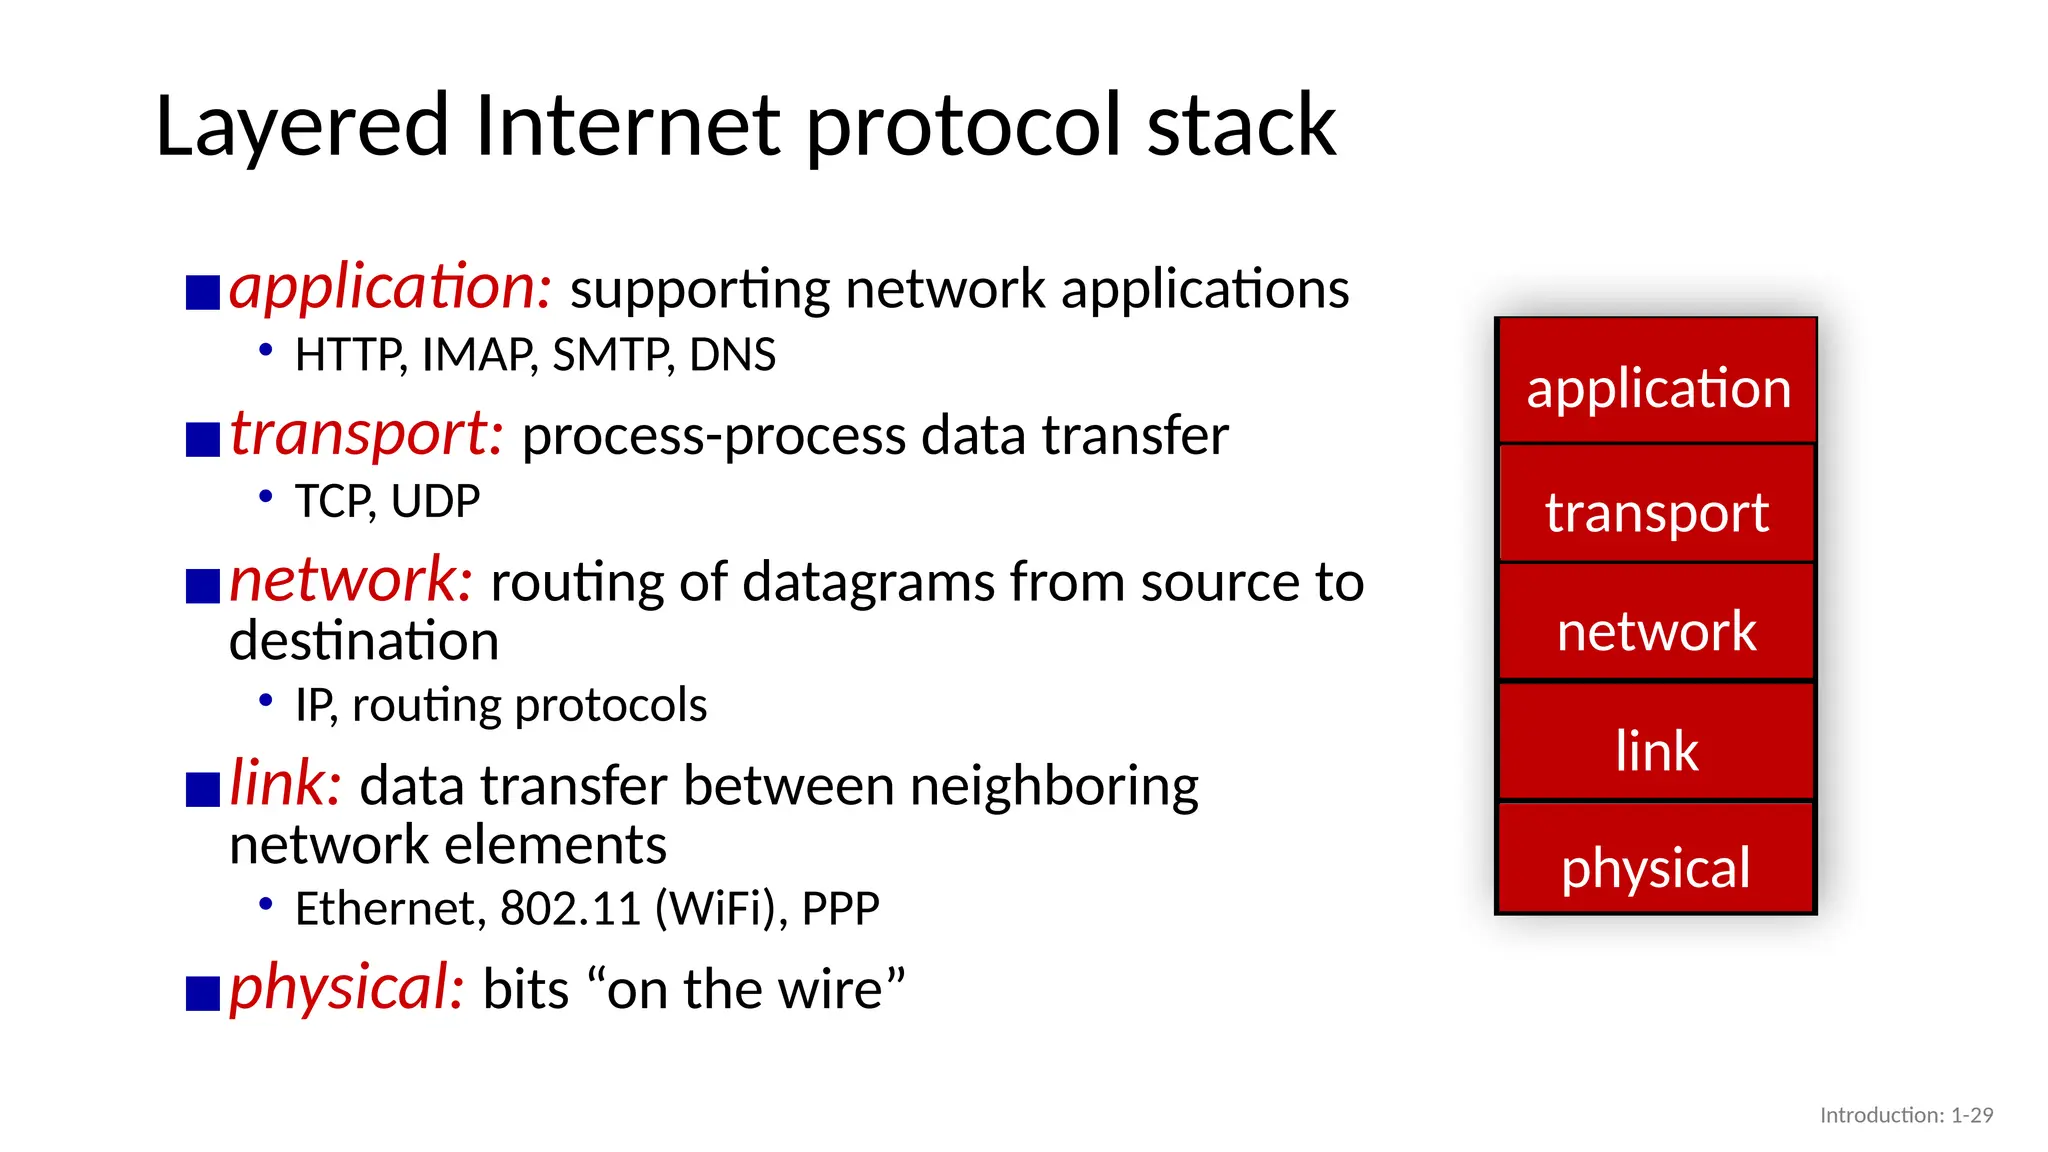
Layered Internet protocolstack
▪application: supporting network applications
• HTTP, IMAP, SMTP, DNS
▪transport: process-process data transfer
• TCP, UDP
▪network: routing of datagrams from source to
destination
• IP, routing protocols
▪link: data transfer between neighboring
network elements
• Ethernet, 802.11 (WiFi), PPP
▪physical: bits “on the wire”
link
application
network
transport
physical
application
transport
network
link
physical
Introduction: 1-29
30.
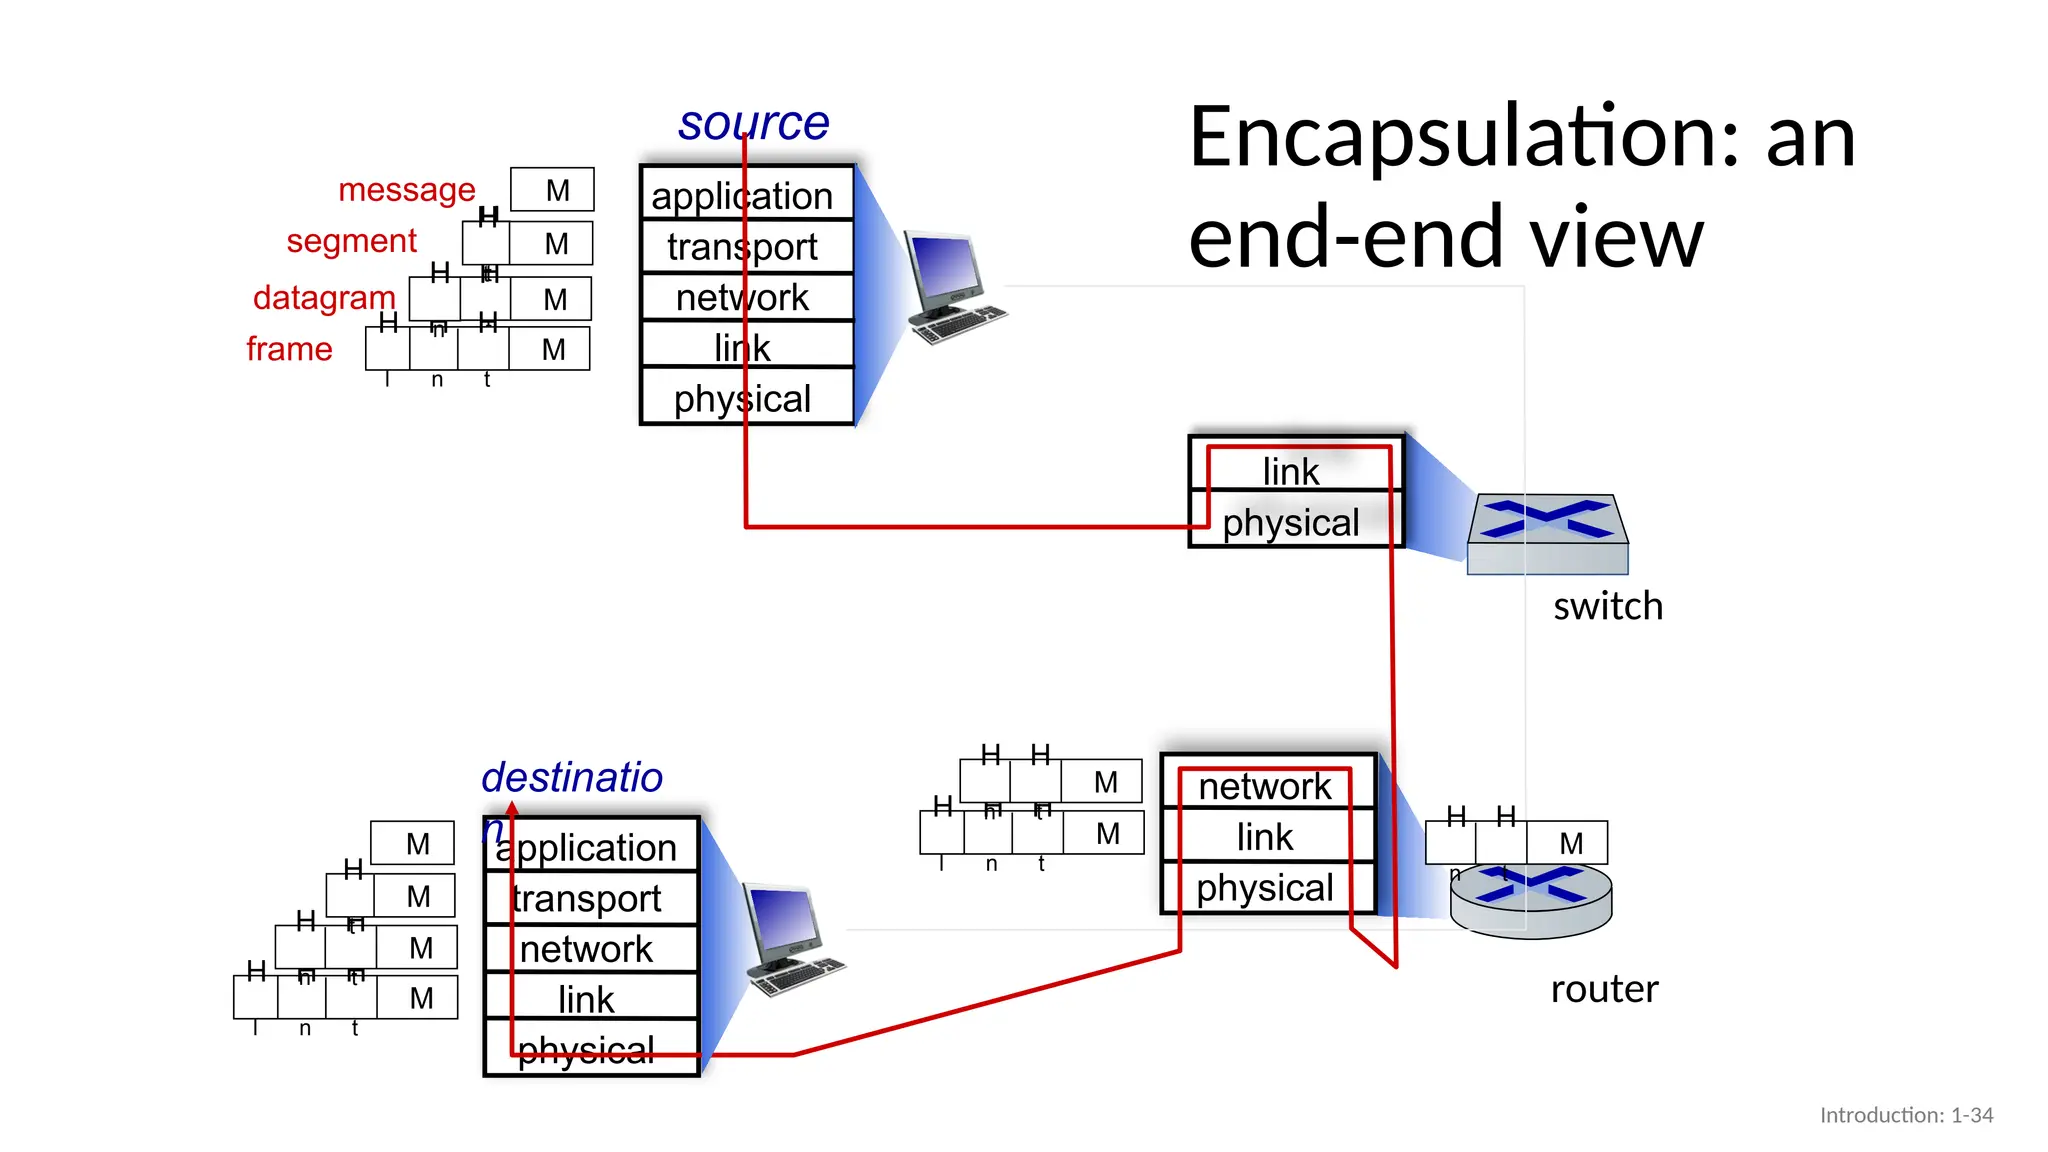
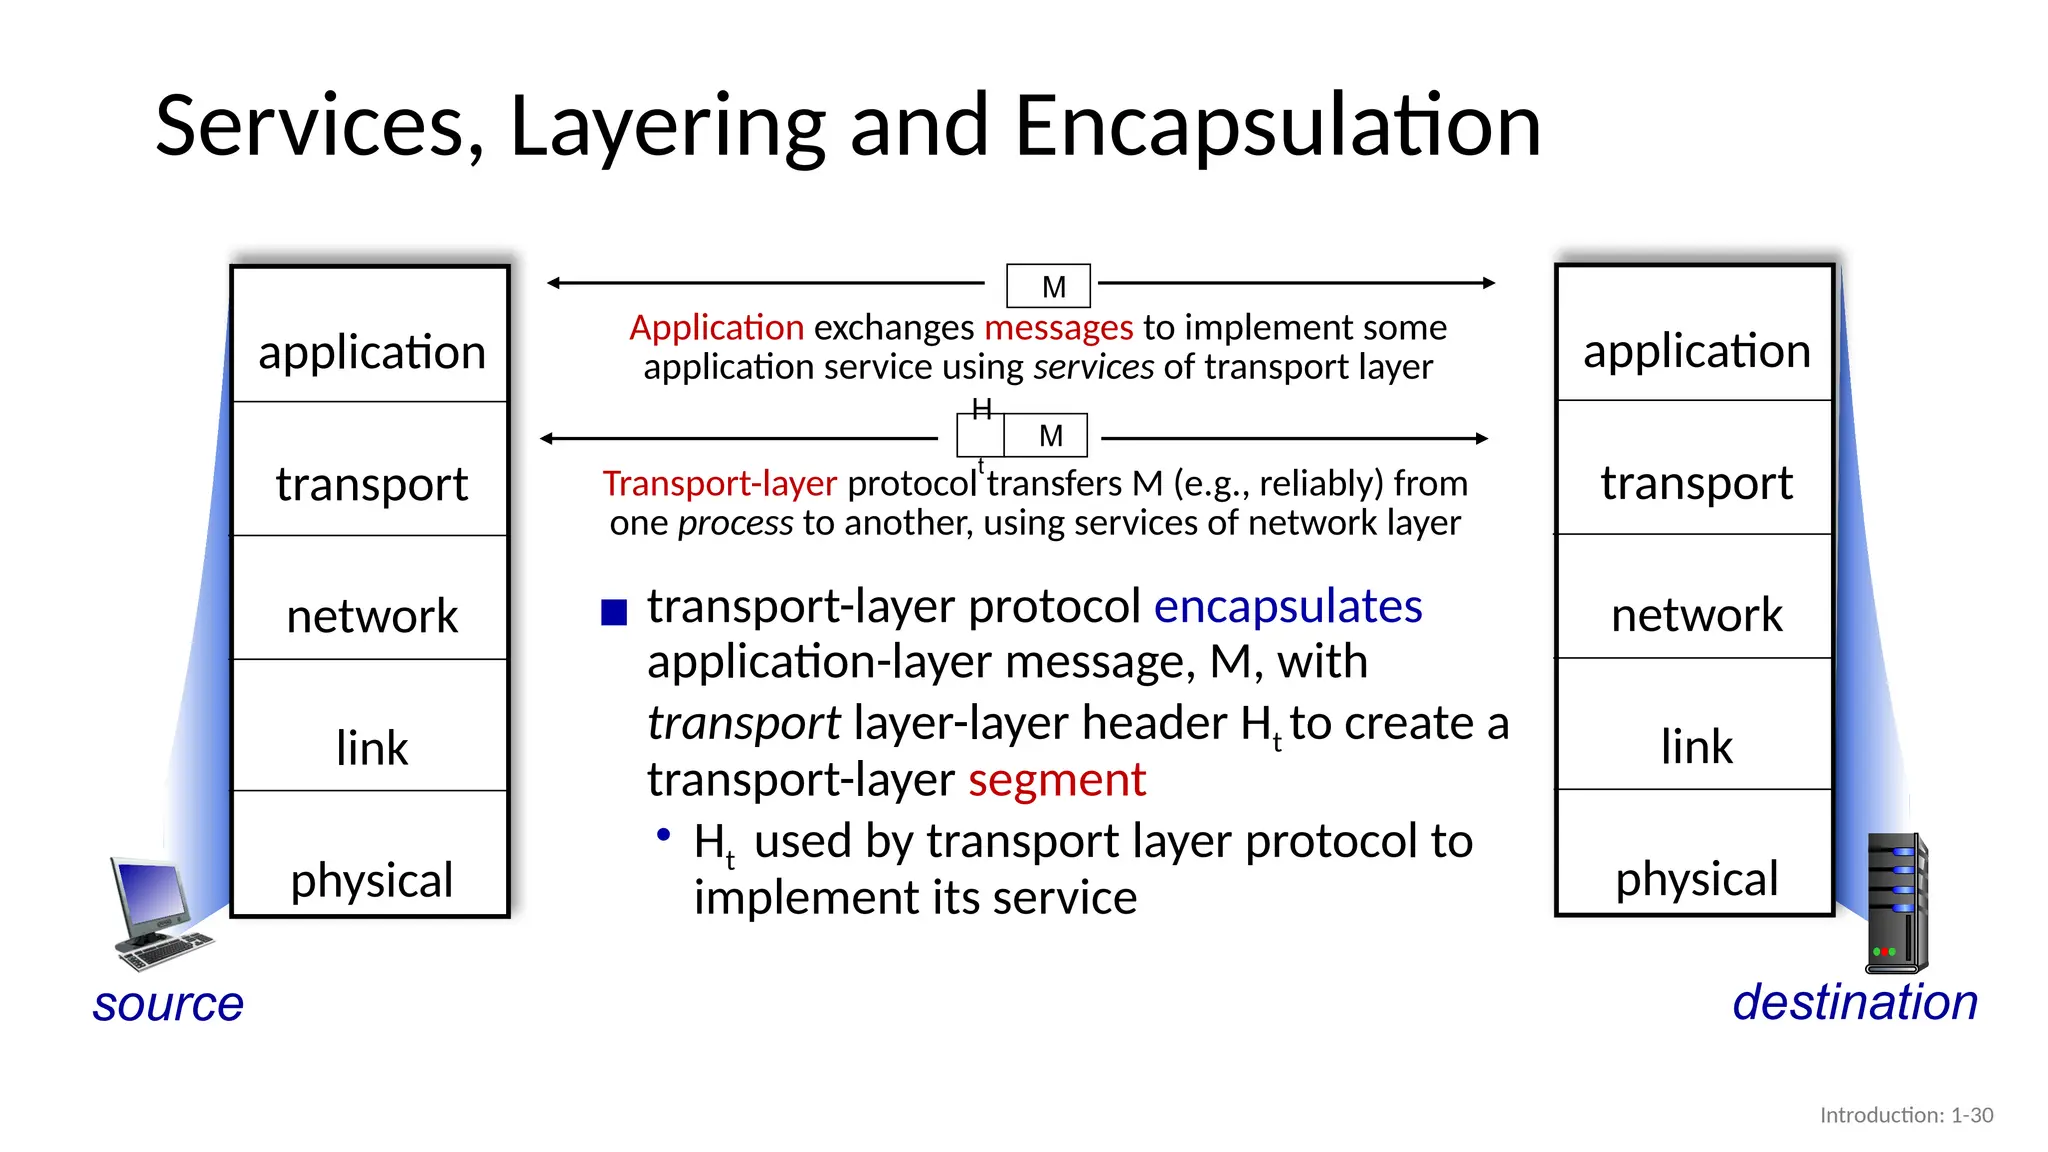
Services, Layering andEncapsulation
source
▪ transport-layer protocol encapsulates
application-layer message, M, with
transport layer-layer header Ht to create a
transport-layer segment
• Ht used by transport layer protocol to
implement its service
application
transport
network
link
physical
destination
application
transport
network
link
physical
Transport-layer protocol transfers M (e.g., reliably) from
one process to another, using services of network layer
H
t
M
Application exchanges messages to implement some
application service using services of transport layer
M
Introduction: 1-30
31.
Services, Layering andEncapsulation
source
Transport-layer protocol transfers M (e.g., reliably) from
one process to another, using services of network layer
H
t
M
▪ network-layer protocol encapsulates
transport-layer segment [Ht | M] with
network layer-layer header Hn to create a
network-layer datagram
• Hn used by network layer protocol to
implement its service
application
transport
network
link
physical
destination
M
application
transport
network
link
physical
M
H
t
H
n
Network-layer protocol transfers transport-layer segment
[Ht | M] from one host to another, using link layer services
Introduction: 1-31
32.
Services, Layering andEncapsulation
source
H
t
M
▪ link-layer protocol encapsulates network
datagram [Hn| [Ht |M], with link-layer header
Hl to create a link-layer frame
application
transport
network
link
physical
destination
M
application
transport
network
link
physical
M
H
t
H
n
Link-layer protocol transfers datagram [Hn| [Ht |M] from
host to neighboring host, using network-layer services
M
H
t
H
n
H
l
Network-layer protocol transfers transport-layer segment
[Ht | M] from one host to another, using link layer services
Introduction: 1-32
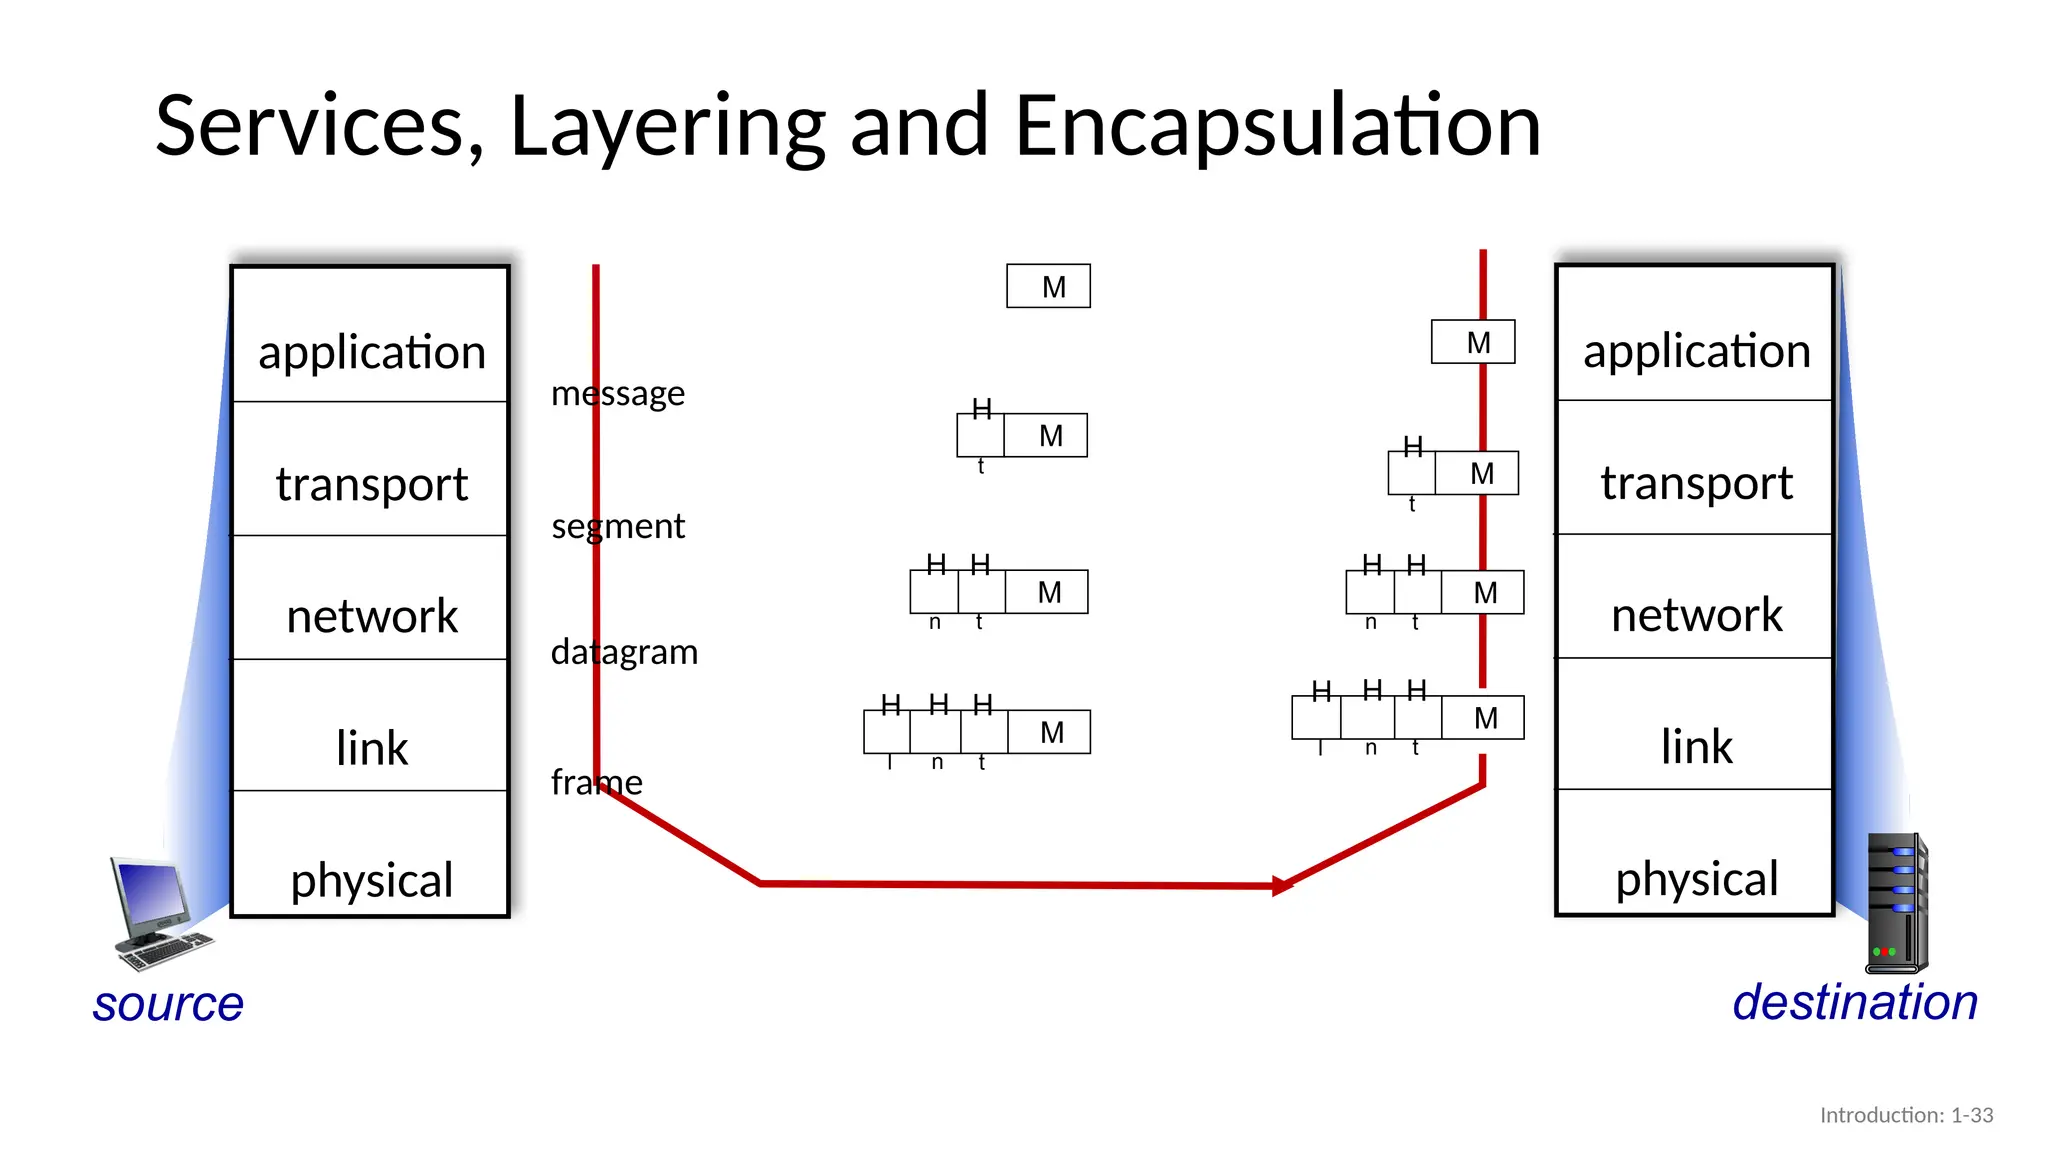
33.
Services, Layering andEncapsulation
source
application
transport
network
link
physical
destination
application
transport
network
link
physical
H
t
M
M
M
H
t
H
n
M
H
t
H
n
H
l
M
H
t
H
n
H
t
M
M
message
segment
datagram
frame
M
H
t
H
n
H
l
Introduction: 1-33
#7 In reality,, in any given region, there may be a regional ISP to which the access ISPs in the region connect. Each regional ISP then connects to tier-1 ISPs.
tier-1 ISPs, which actually do exist, do not have a presence in every city in the world. There are approximately a dozen tier-1 ISPs.
not only are there multiple competing tier-1 ISPs, there may be multiple competing regional ISPs in a region.
each access ISP pays the regional ISP to which it connects, and each regional ISP pays the tier-1 ISP to which it connects. (An access ISP can also connect directly to a tier-1 ISP, in which case it pays the tier-1 ISP).
Note that the tier-1 ISPs do not pay anyone as they are at the top of the hierarchy.
#8 today’s Internet we must add points of presence (PoPs), multi-homing, peering, and Internet exchange points
(IXPs)
PoP is simply a group of one or more routers (at the same location) in the provider’s network where customer ISPs
can connect into the provider ISP. For a customer network to connect to a provider’s PoP, it can lease a high-speed link from a third-party telecommunications provider to directly connect one of its routers to a router at the PoP.
Any ISP (except for tier-1 ISPs) may choose to multi-home, that is, to connect to two or more provider ISPs. So,
for example, an access ISP may multi-home with two regional ISPs, or it may multihome
with two regional ISPs and also with a tier-1 ISP.
When an ISP multi-homes, it can continue to send and receive packets into the Internet even if one of its providers has a failure.
The amount that a customer ISP pays a provider ISP reflects the amount of traffic it exchanges with the provider. To reduce these costs, a pair
of nearby ISPs at the same level of the hierarchy can peer, that is, they can directly connect their networks together so that all the traffic between them passes over the direct connection rather than through upstream intermediaries. When two ISPs peer, it is typically settlement-free, that is, neither ISP pays the other. As noted earlier, tier-1 ISPs also peer with one another, settlement-free.
a third-party company can create an Internet Exchange Point (IXP), which is a meeting point where multiple ISPs can peer together. An IXP is typically in a stand-alone building with its own switches [Ager 2012]. There are over 600 IXPs in the Internet today [PeeringDB 2020].
#10 by adding content-provider networks. Google is currently one of the leading examples
of such a content-provider network. As of this writing, it Google has 19 major data
centers distributed across .
Additionally, Google has smaller data centers, each with a few hundred servers; these smaller data
centers are often located within IXPs. The Google data centers are all interconnected
via Google’s private TCP/IP network, however, the Google private network only carries traffic to/from Google servers.
content provider not only reduces its payments to upper-tier ISPs, but also has greater control of how its services are ultimately delivered to end users
#11 today’s Internet—a network of networks—is complex, consisting
of a dozen or so tier-1 ISPs and hundreds of thousands of lower-tier ISPs. The ISPs
are diverse in their coverage, with some spanning multiple continents and oceans,
and others limited to narrow geographic regions. The lower-tier ISPs connect to the
higher-tier ISPs, and the higher-tier ISPs interconnect with one another. Users and
content providers are customers of lower-tier ISPs, and lower-tier ISPs are customers
of higher-tier ISPs
#13 Instead, computer networks necessarily constrain throughput (the amount of data per second that can be transferred) between end systems, introduce delays between end systems,
nodal delay at router A is the time between the arrival of a packet at a node and its arrival at the next node
#16 Processing Delay
The time required to examine the packet’s header and determine where to direct
the packet is part of the processing delay. The processing delay can also include
other factors, such as the time needed to check for bit-level errors in the packet
that occurred in transmitting the packet’s bits from the upstream node to router A.
Processing delays in high-speed routers are typically on the order of microseconds
or less. After this nodal processing, the router directs the packet to the queue that
precedes the link to router B.
Queuing Delay
The length of the queuing delay of a specific packet will depend on the
number of earlier-arriving packets that are queued and waiting for transmission onto
the link. If the queue is empty and no other packet is currently being transmitted, then
our packet’s queuing delay will be zero
Transmission Delay
packet by L bits, and denote the transmission rate of the link from router A to router
B by R bits/sec. For example, for a 10 Mbps Ethernet link, the rate is R = 10 Mbps;
for a 100 Mbps Ethernet link, the rate is R = 100 Mbps. The transmission delay is
L/R. This is the amount of time required to push (that is, transmit) all of the packet’s
bits into the link. Transmission delays are typically on the order of microseconds to
milliseconds in practice.
Propagation Delay
Once a bit is pushed into the link, it needs to propagate to router B. The time required for one bit (last bit)
to propagate from the beginning of the link to router B is the propagation delay
The propagation speed depends on the physical medium of the link (that is, fiber optics, twisted-pair copper wire, and
so on) and is in the range of 2x10⁸ meters/sec to 3x10⁸ meters/sec.
The propagation delay is the distance between two routers divided by the propagation speed. That is, the propagation
delay is d/s, where d is the distance between router A and router B and s is the propagation speed of the link
The contribution of these delay components can vary significantly. For example,
dprop can be negligible (for example, a couple of microseconds) for a link connecting
two routers on the same university campus; however, dprop is hundreds of milliseconds
for two routers interconnected by a geostationary satellite link,
#21 the number of bits per second actually transmitted through a network is the network througput the number seconds used for the measurement is significant: if the measurement is taken over a very short time interval, we are measuring the instantaneous throughput
if the measurement is taken over a long time interval, for example, the transfer of a whole group of files, we are measuring the average throughput
average throughput is usually more consistent than instantaneous throughput
![Services, Layering and Encapsulation
source
Transport-layer protocol transfers M (e.g., reliably) from
one process to another, using services of network layer
H
t
M
▪ network-layer protocol encapsulates
transport-layer segment [Ht | M] with
network layer-layer header Hn to create a
network-layer datagram
• Hn used by network layer protocol to
implement its service
application
transport
network
link
physical
destination
M
application
transport
network
link
physical
M
H
t
H
n
Network-layer protocol transfers transport-layer segment
[Ht | M] from one host to another, using link layer services
Introduction: 1-31](https://image.slidesharecdn.com/lecture2networks-250803205808-95fd4e4b/75/lecture2-Networks-pptx-31-2048.jpg)
![Services, Layering and Encapsulation
source
H
t
M
▪ link-layer protocol encapsulates network
datagram [Hn| [Ht |M], with link-layer header
Hl to create a link-layer frame
application
transport
network
link
physical
destination
M
application
transport
network
link
physical
M
H
t
H
n
Link-layer protocol transfers datagram [Hn| [Ht |M] from
host to neighboring host, using network-layer services
M
H
t
H
n
H
l
Network-layer protocol transfers transport-layer segment
[Ht | M] from one host to another, using link layer services
Introduction: 1-32](https://image.slidesharecdn.com/lecture2networks-250803205808-95fd4e4b/75/lecture2-Networks-pptx-32-2048.jpg)