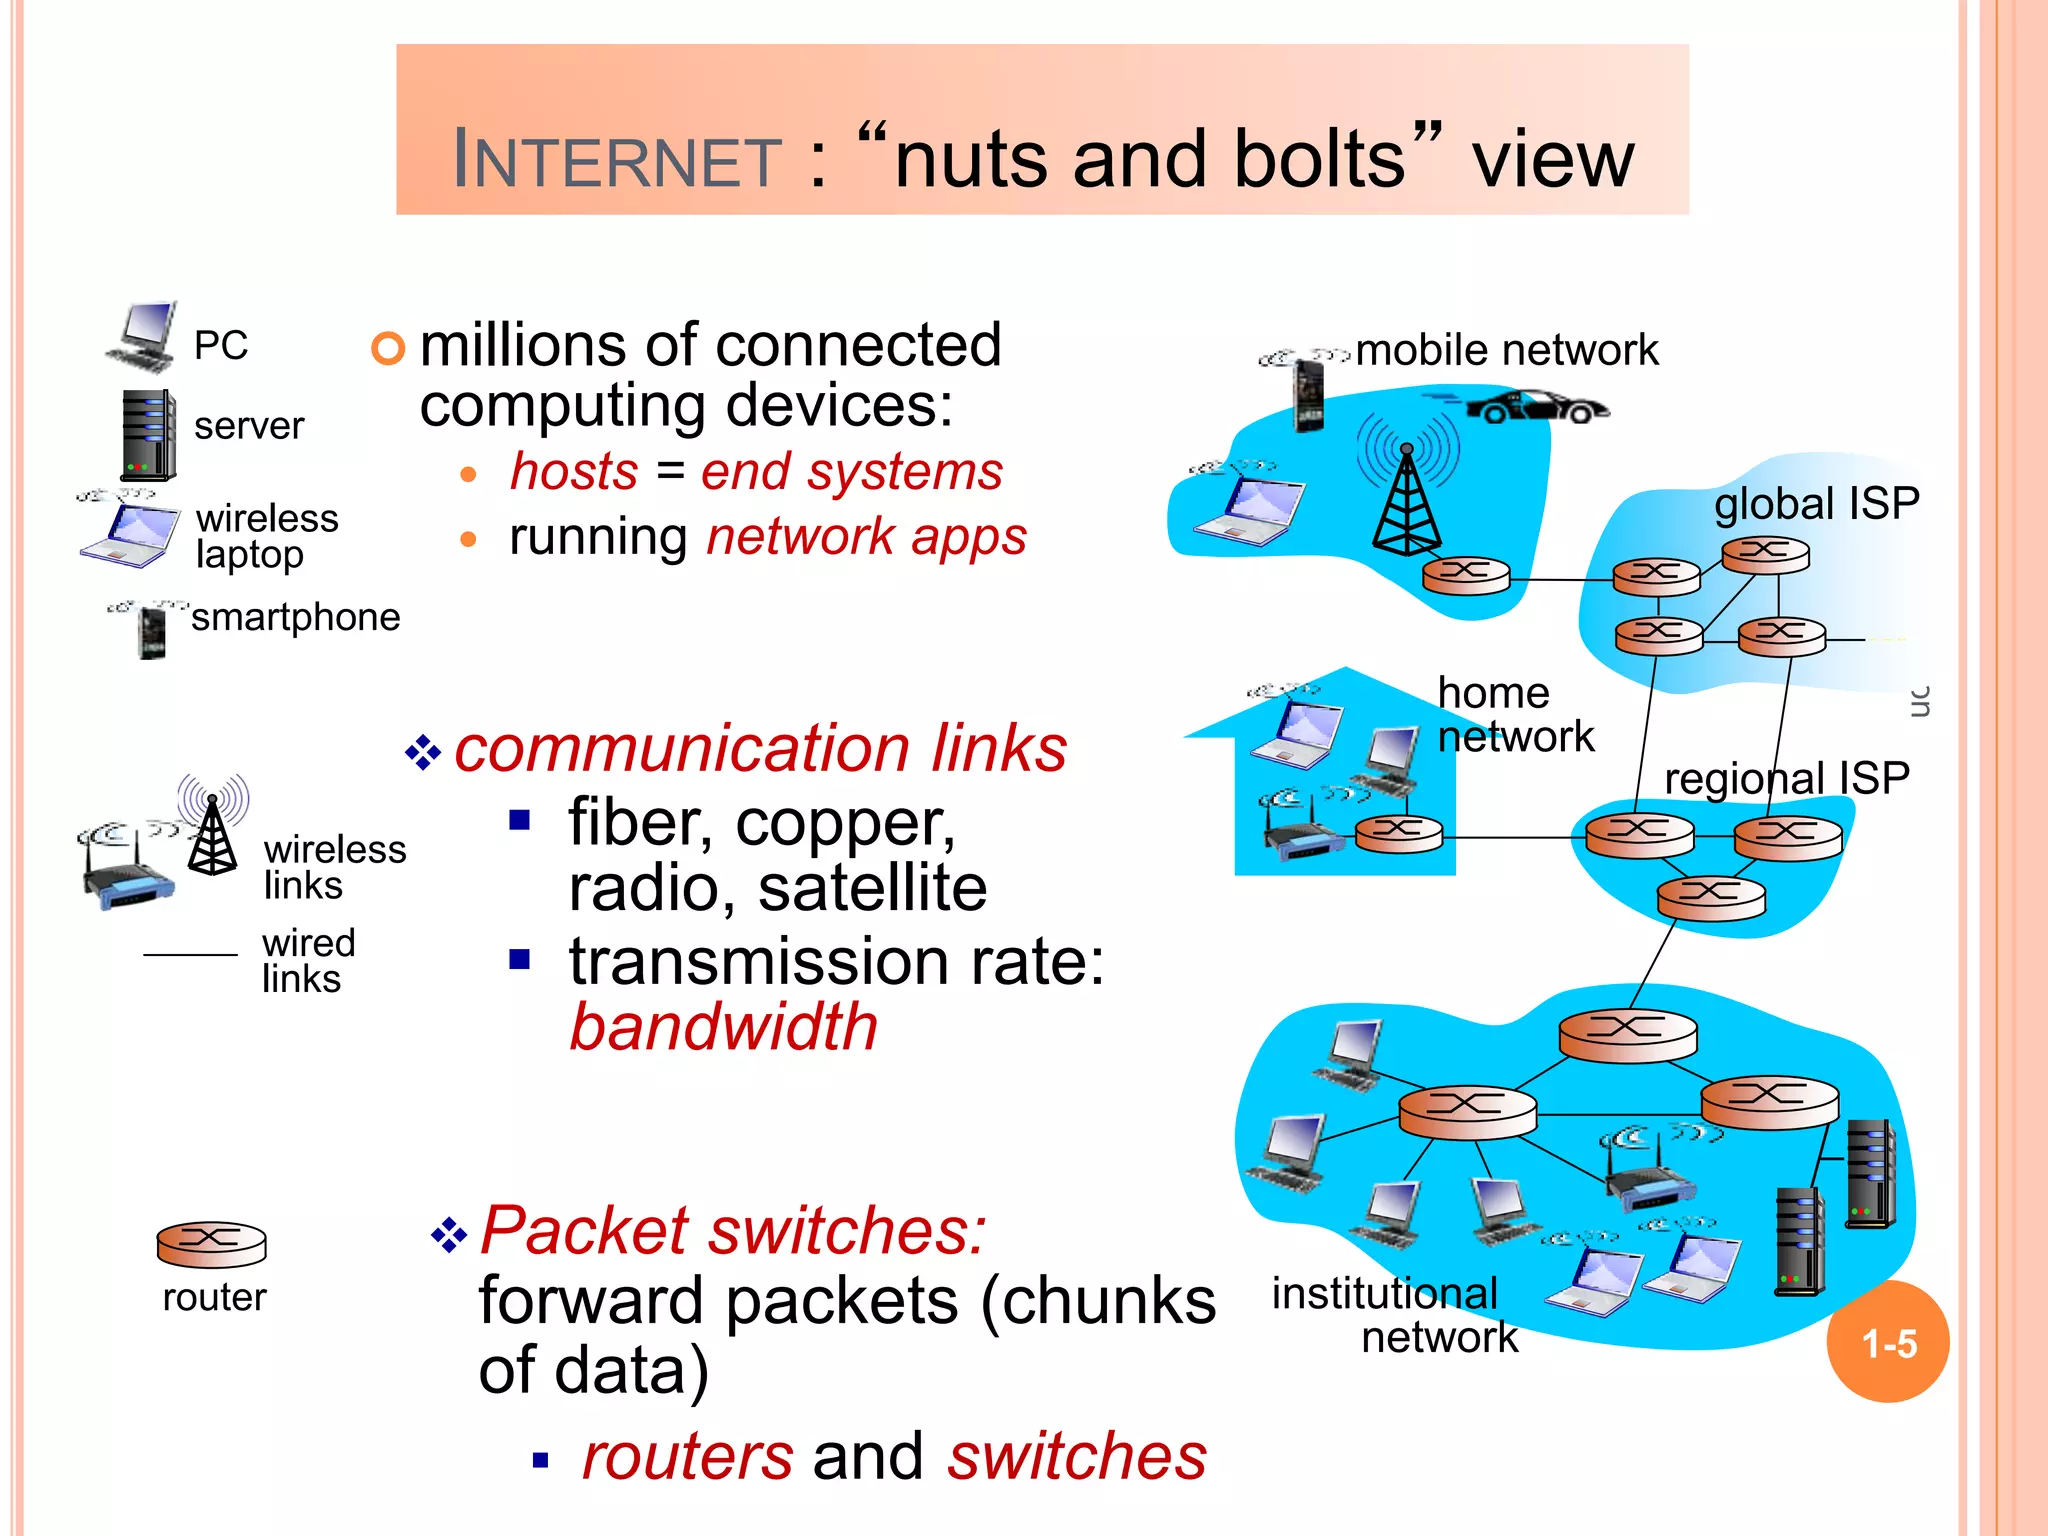
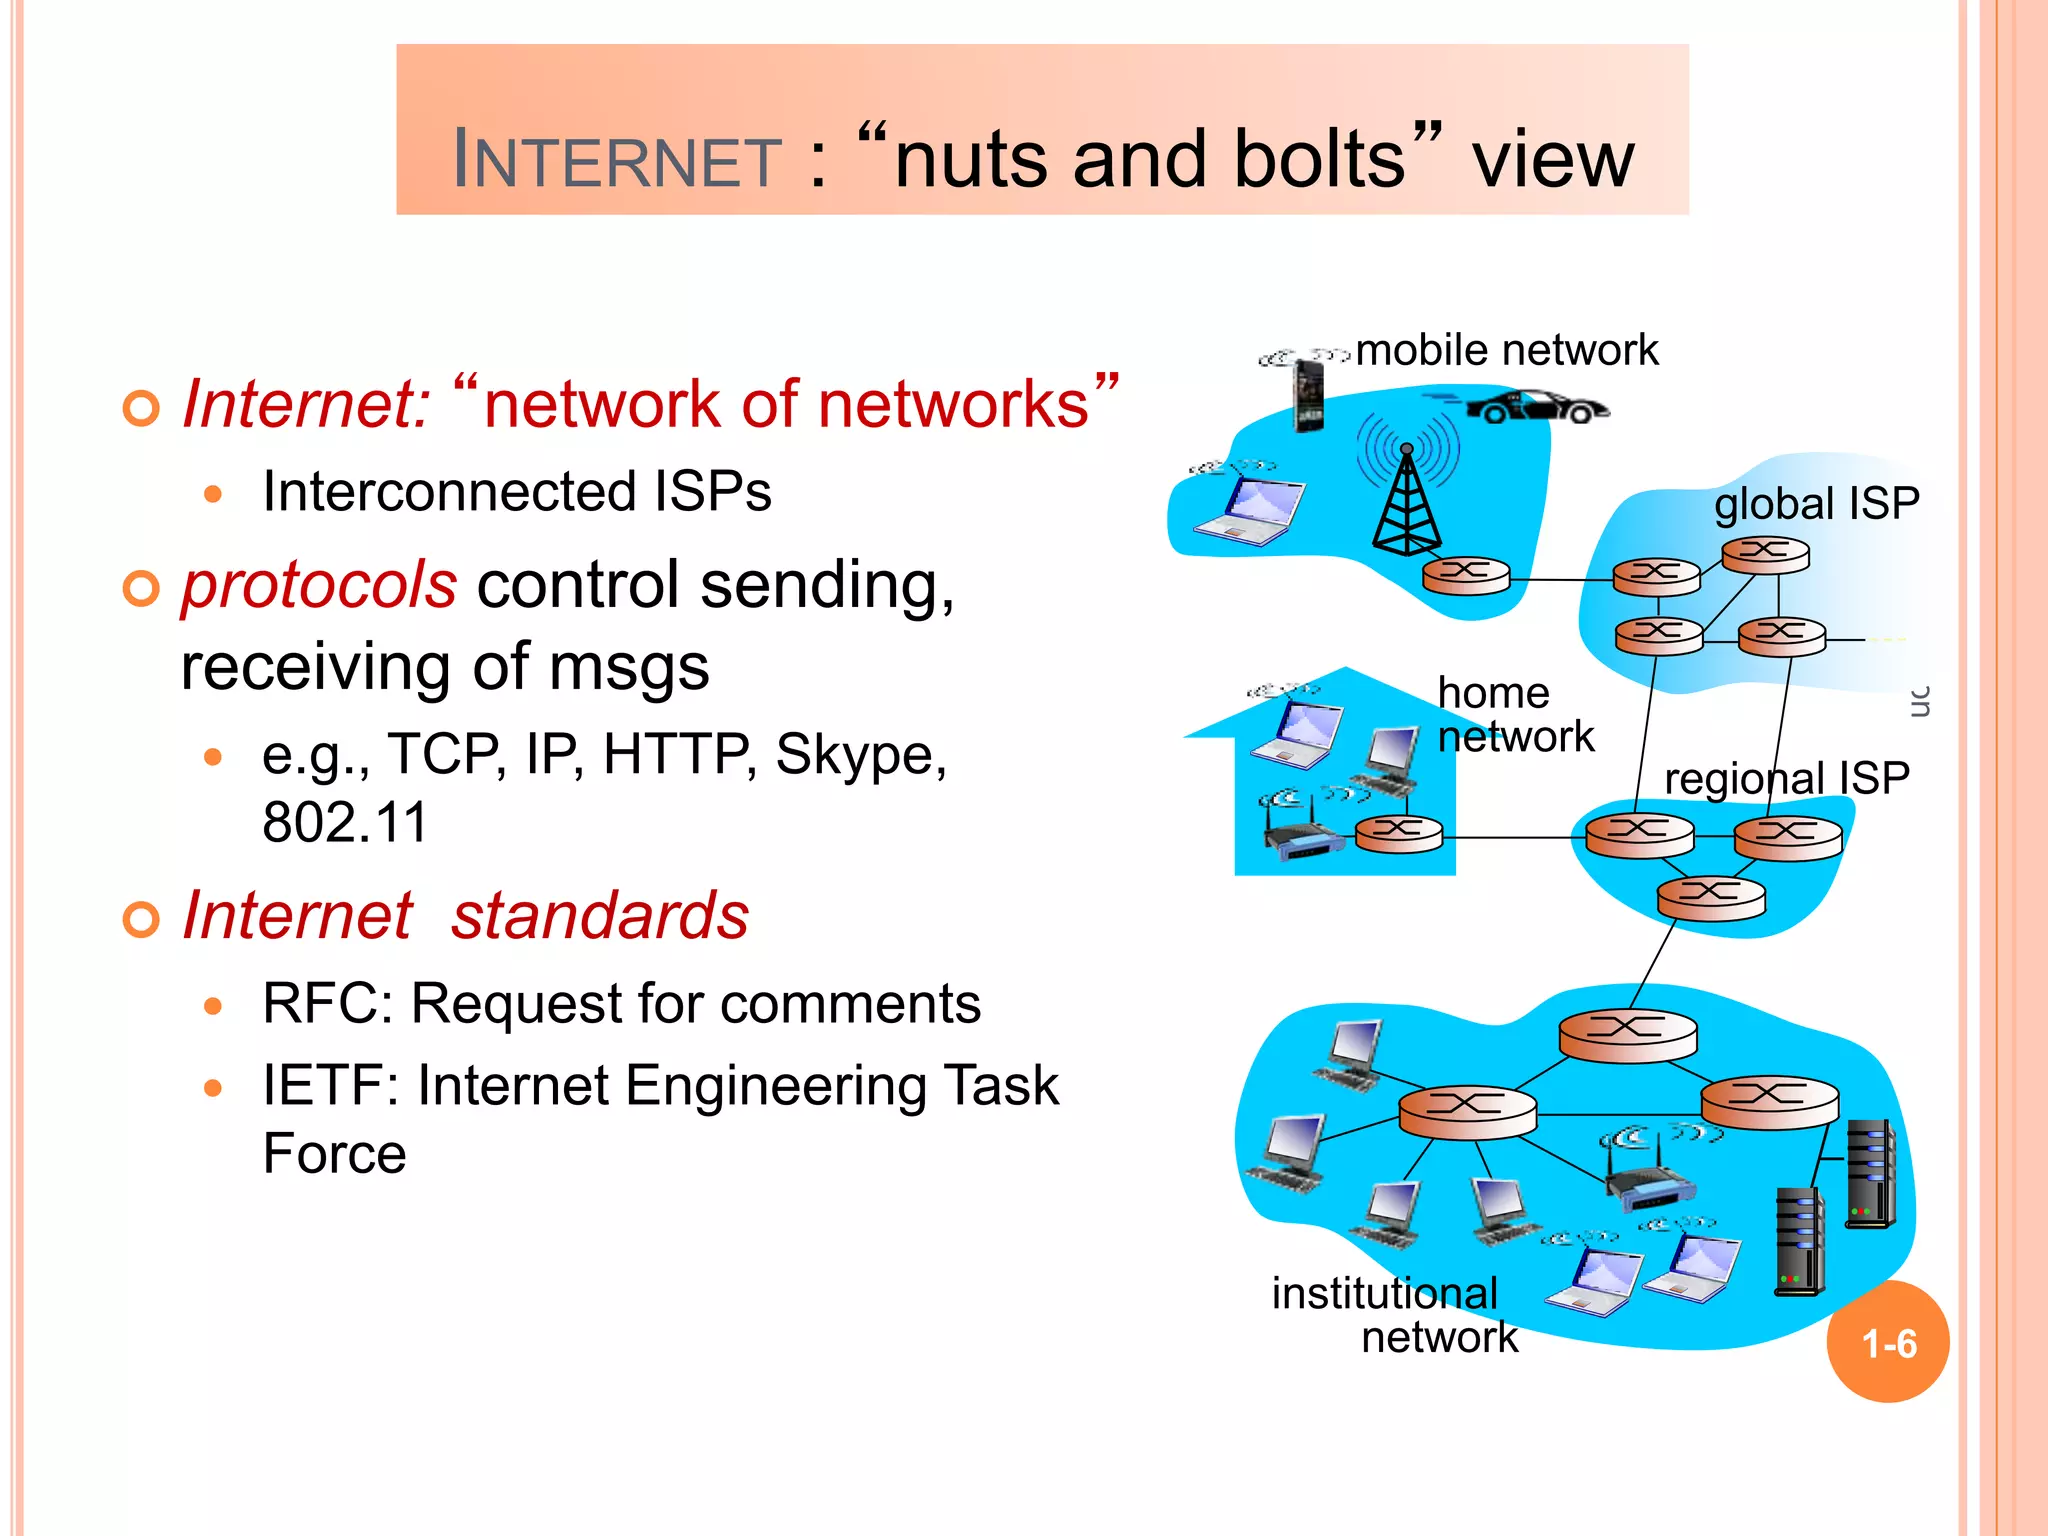
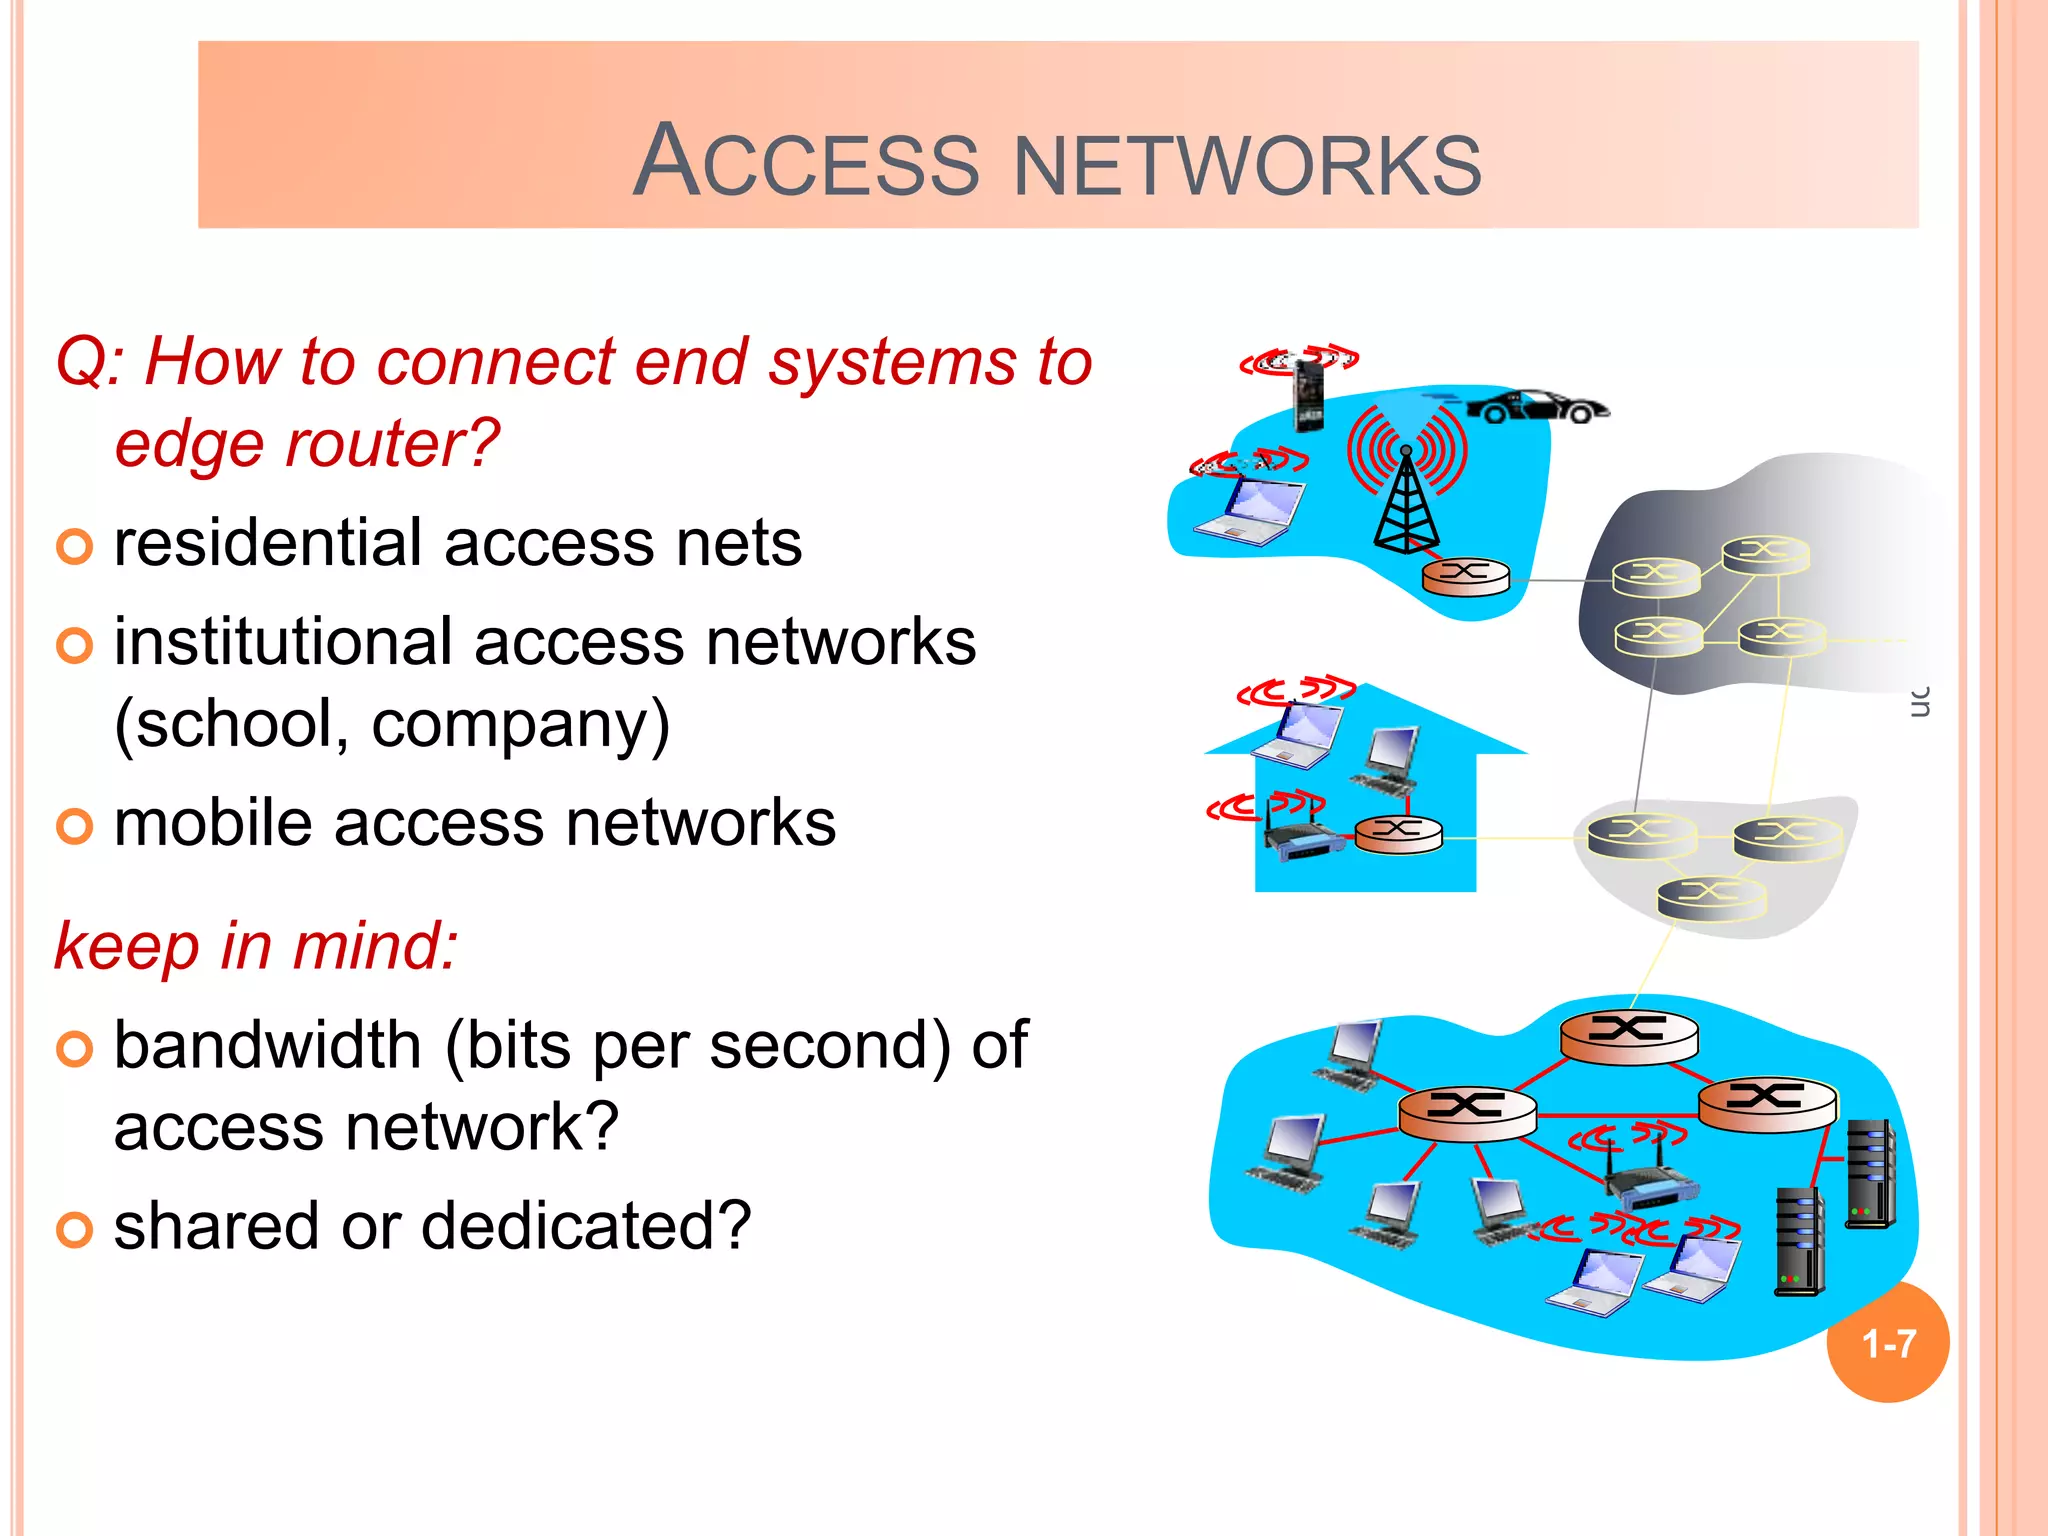
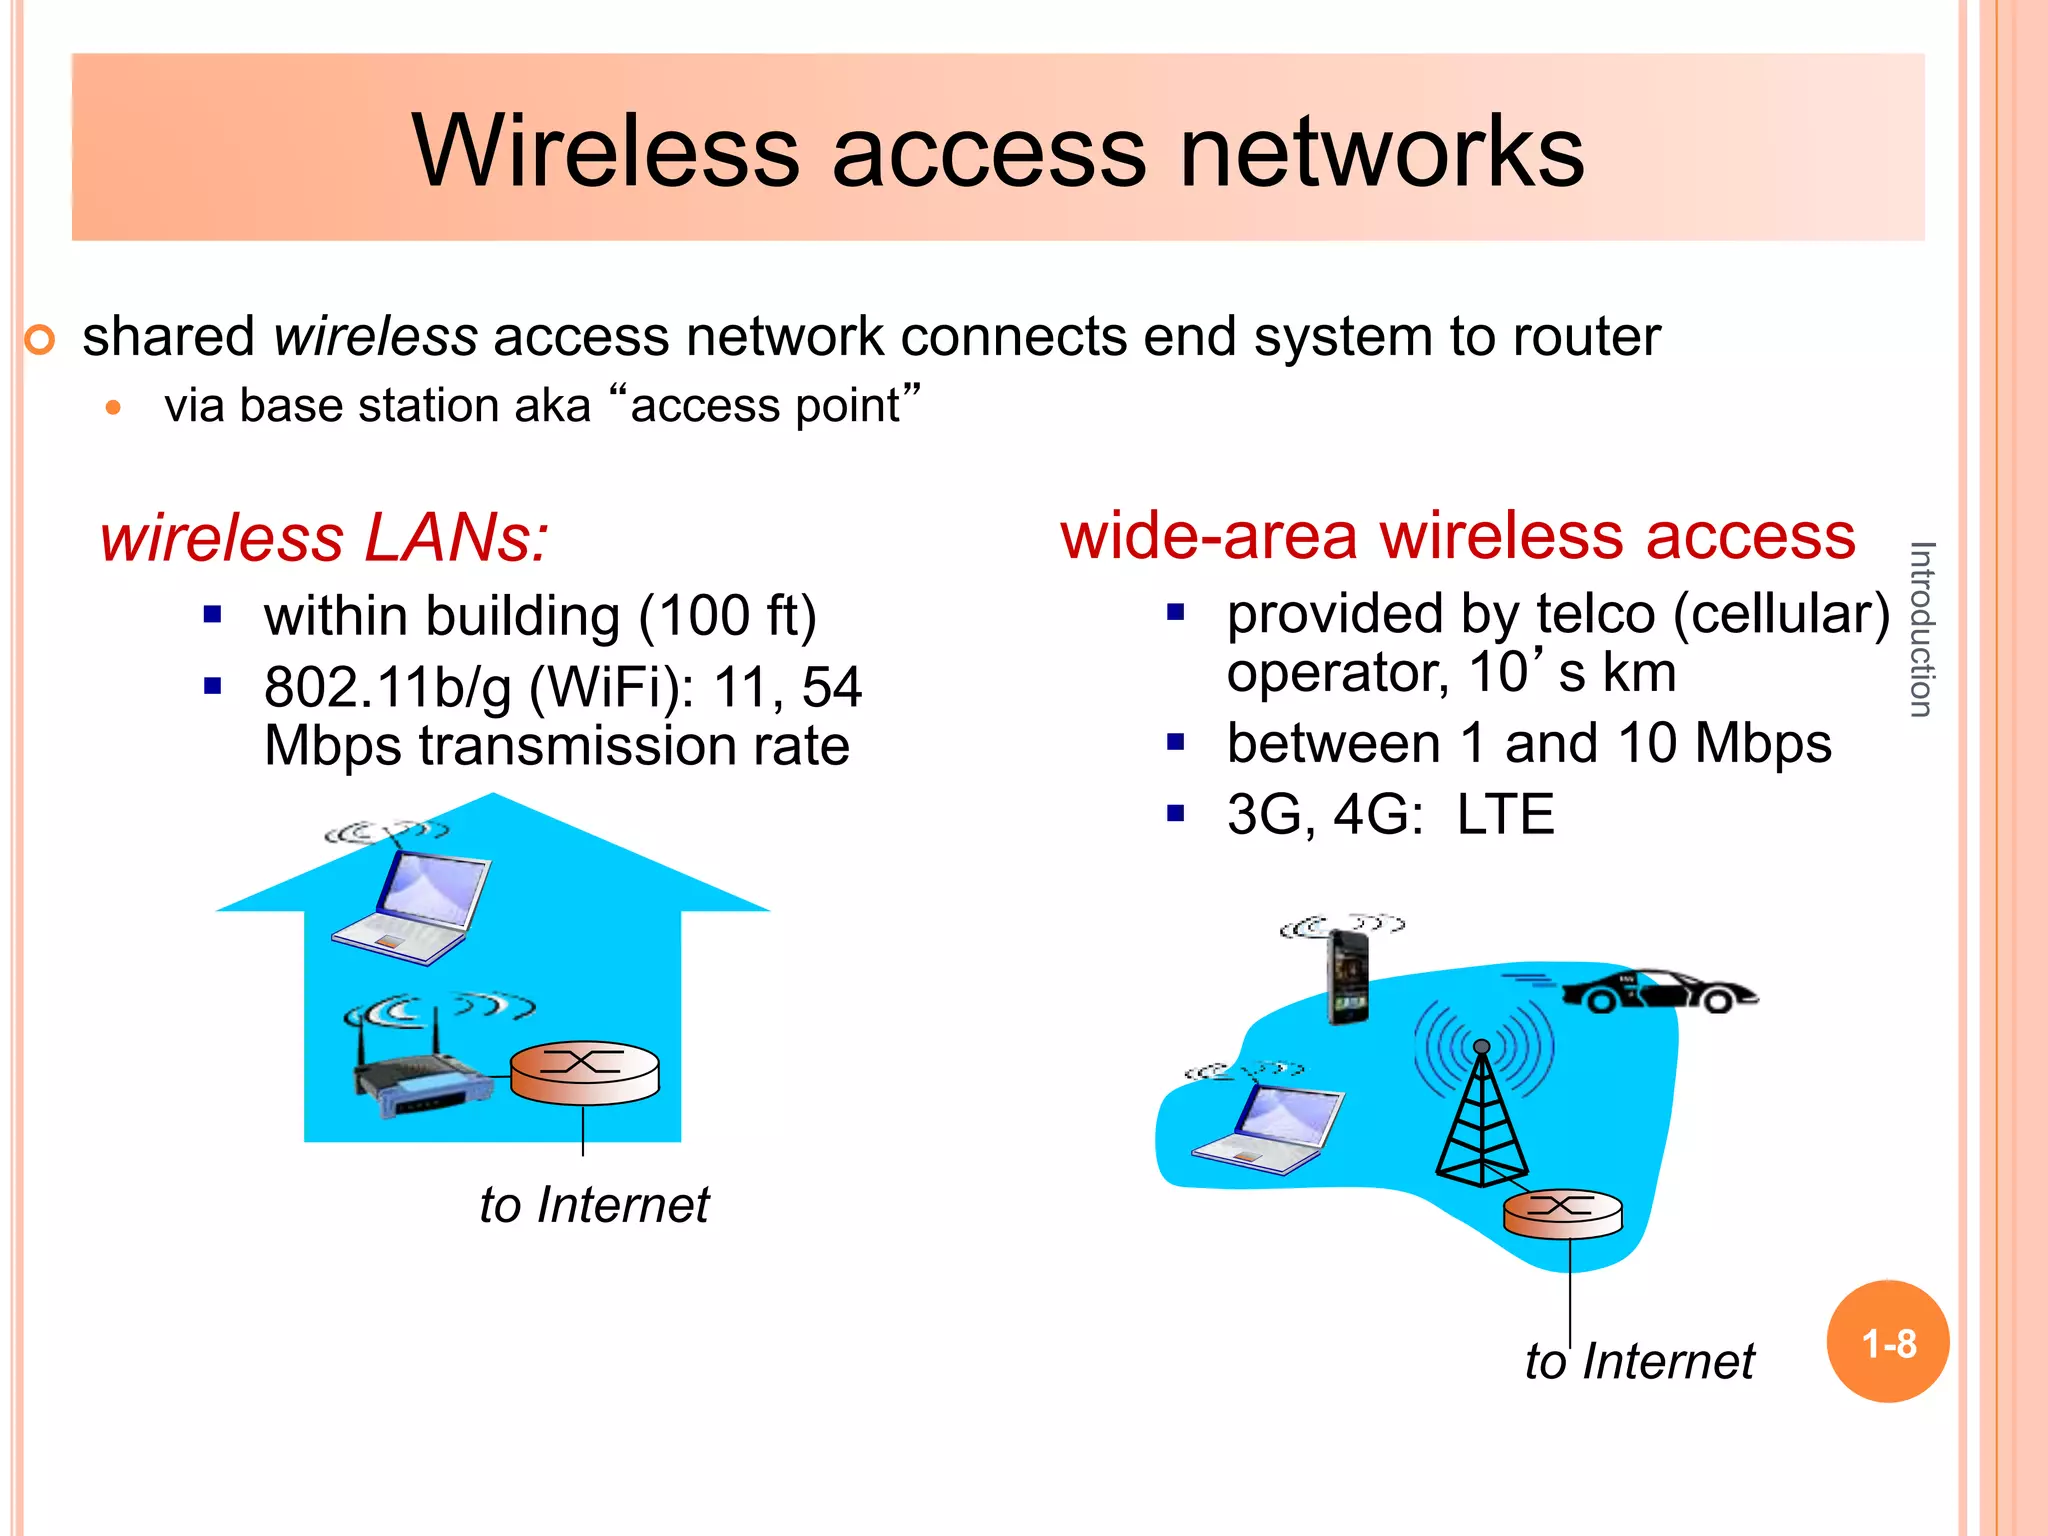
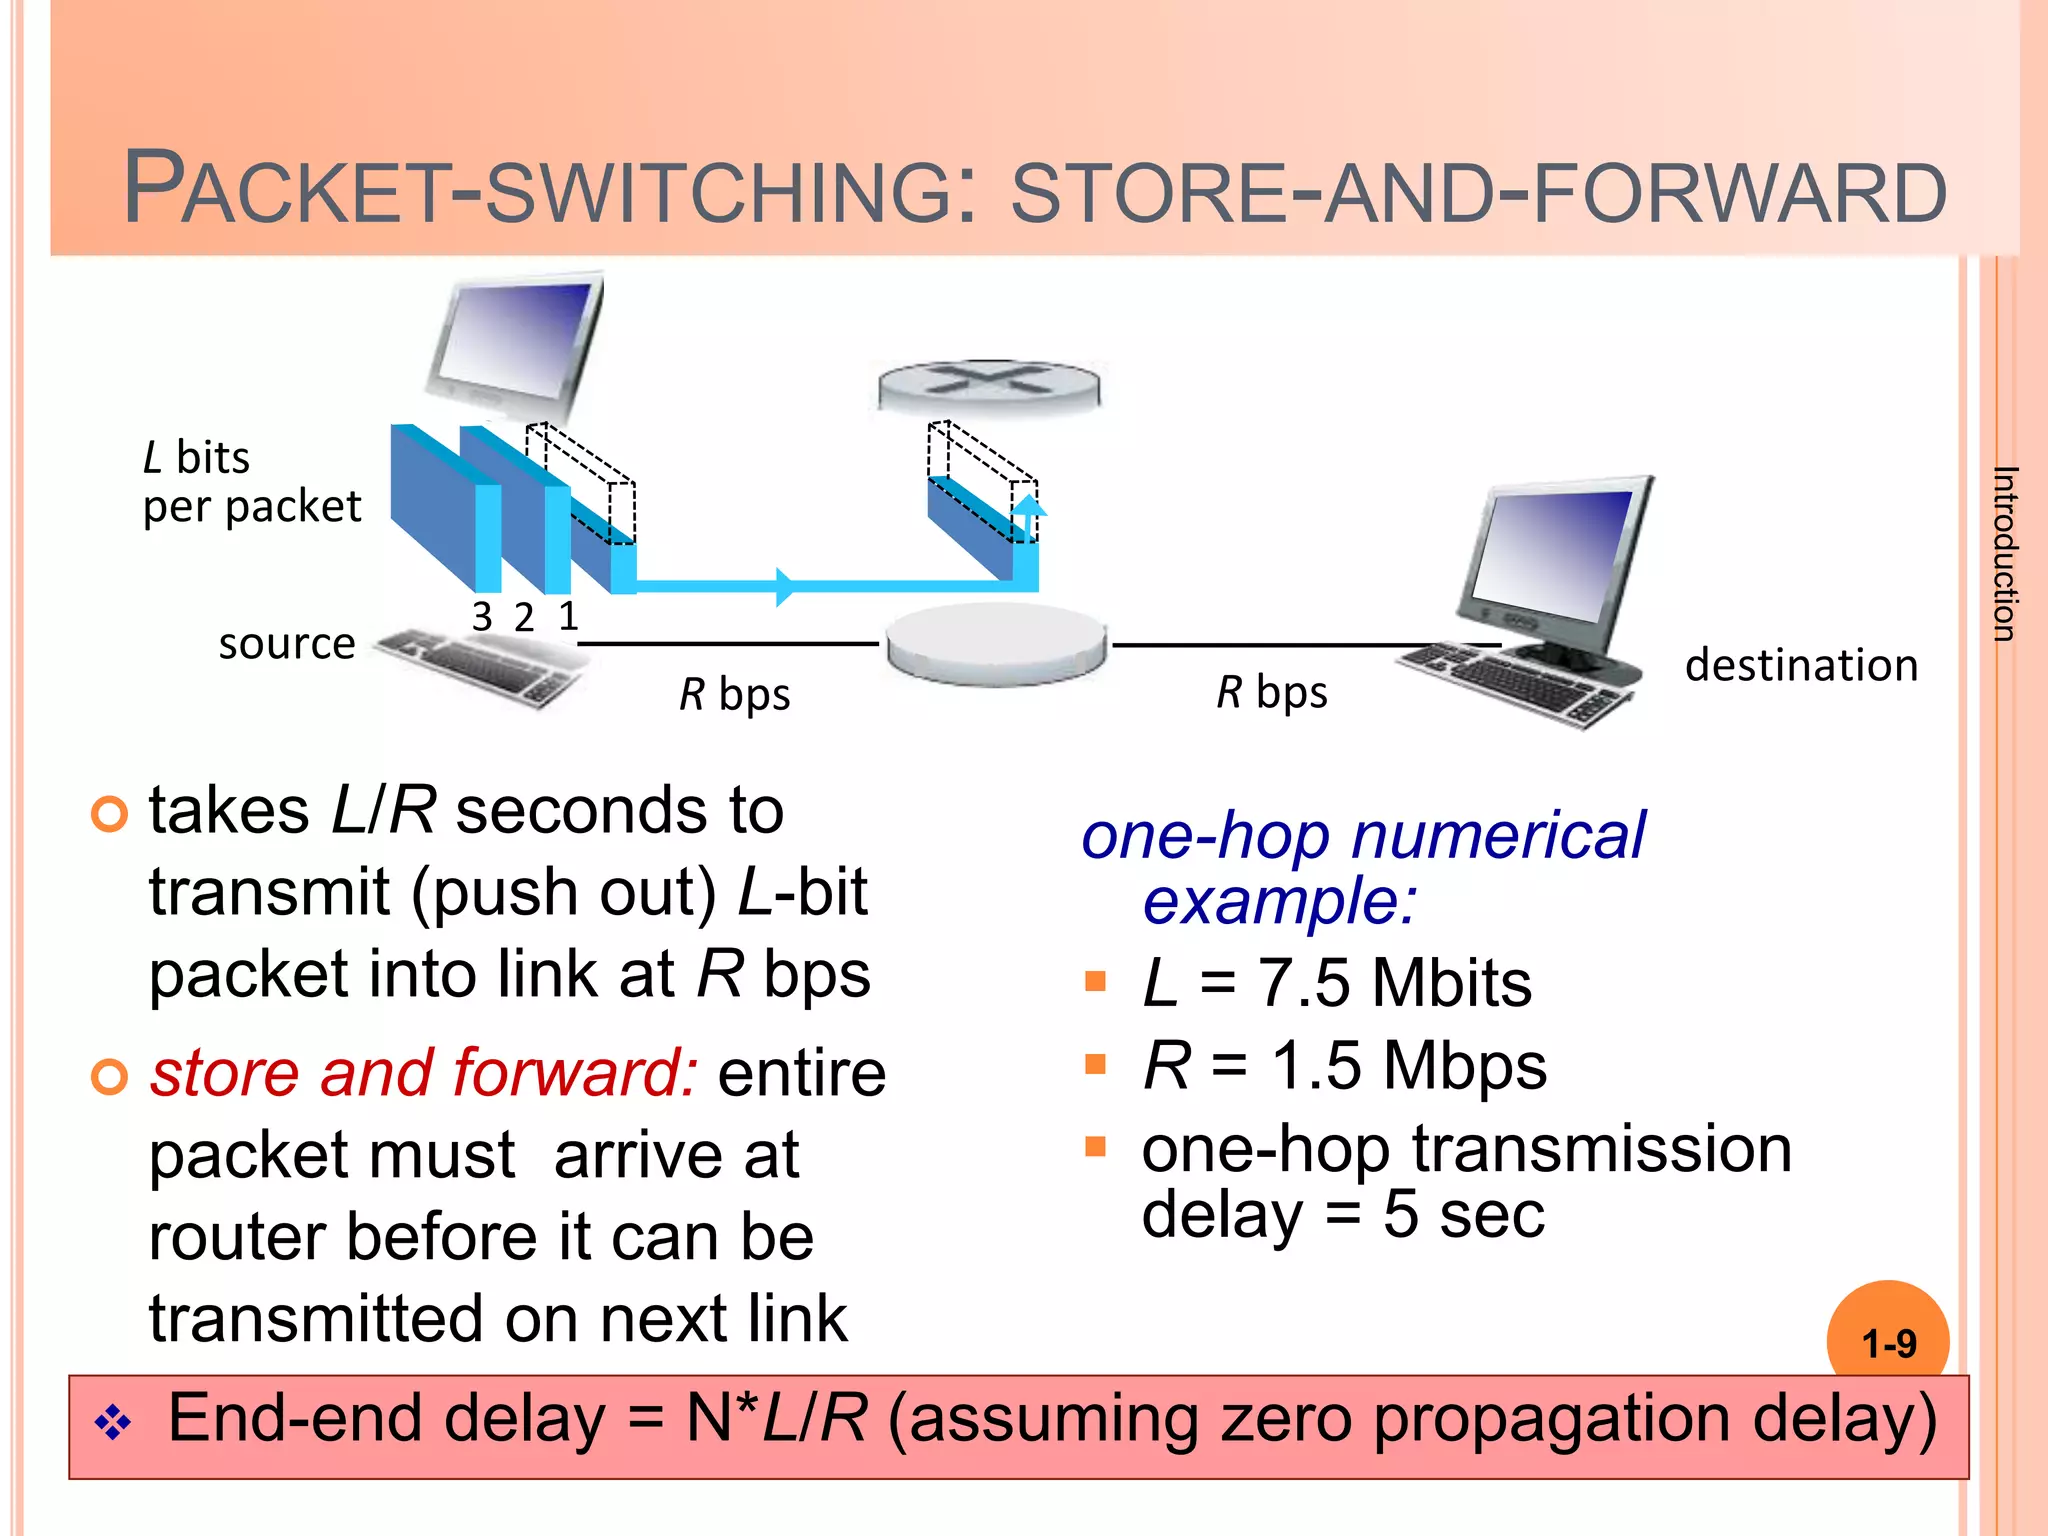
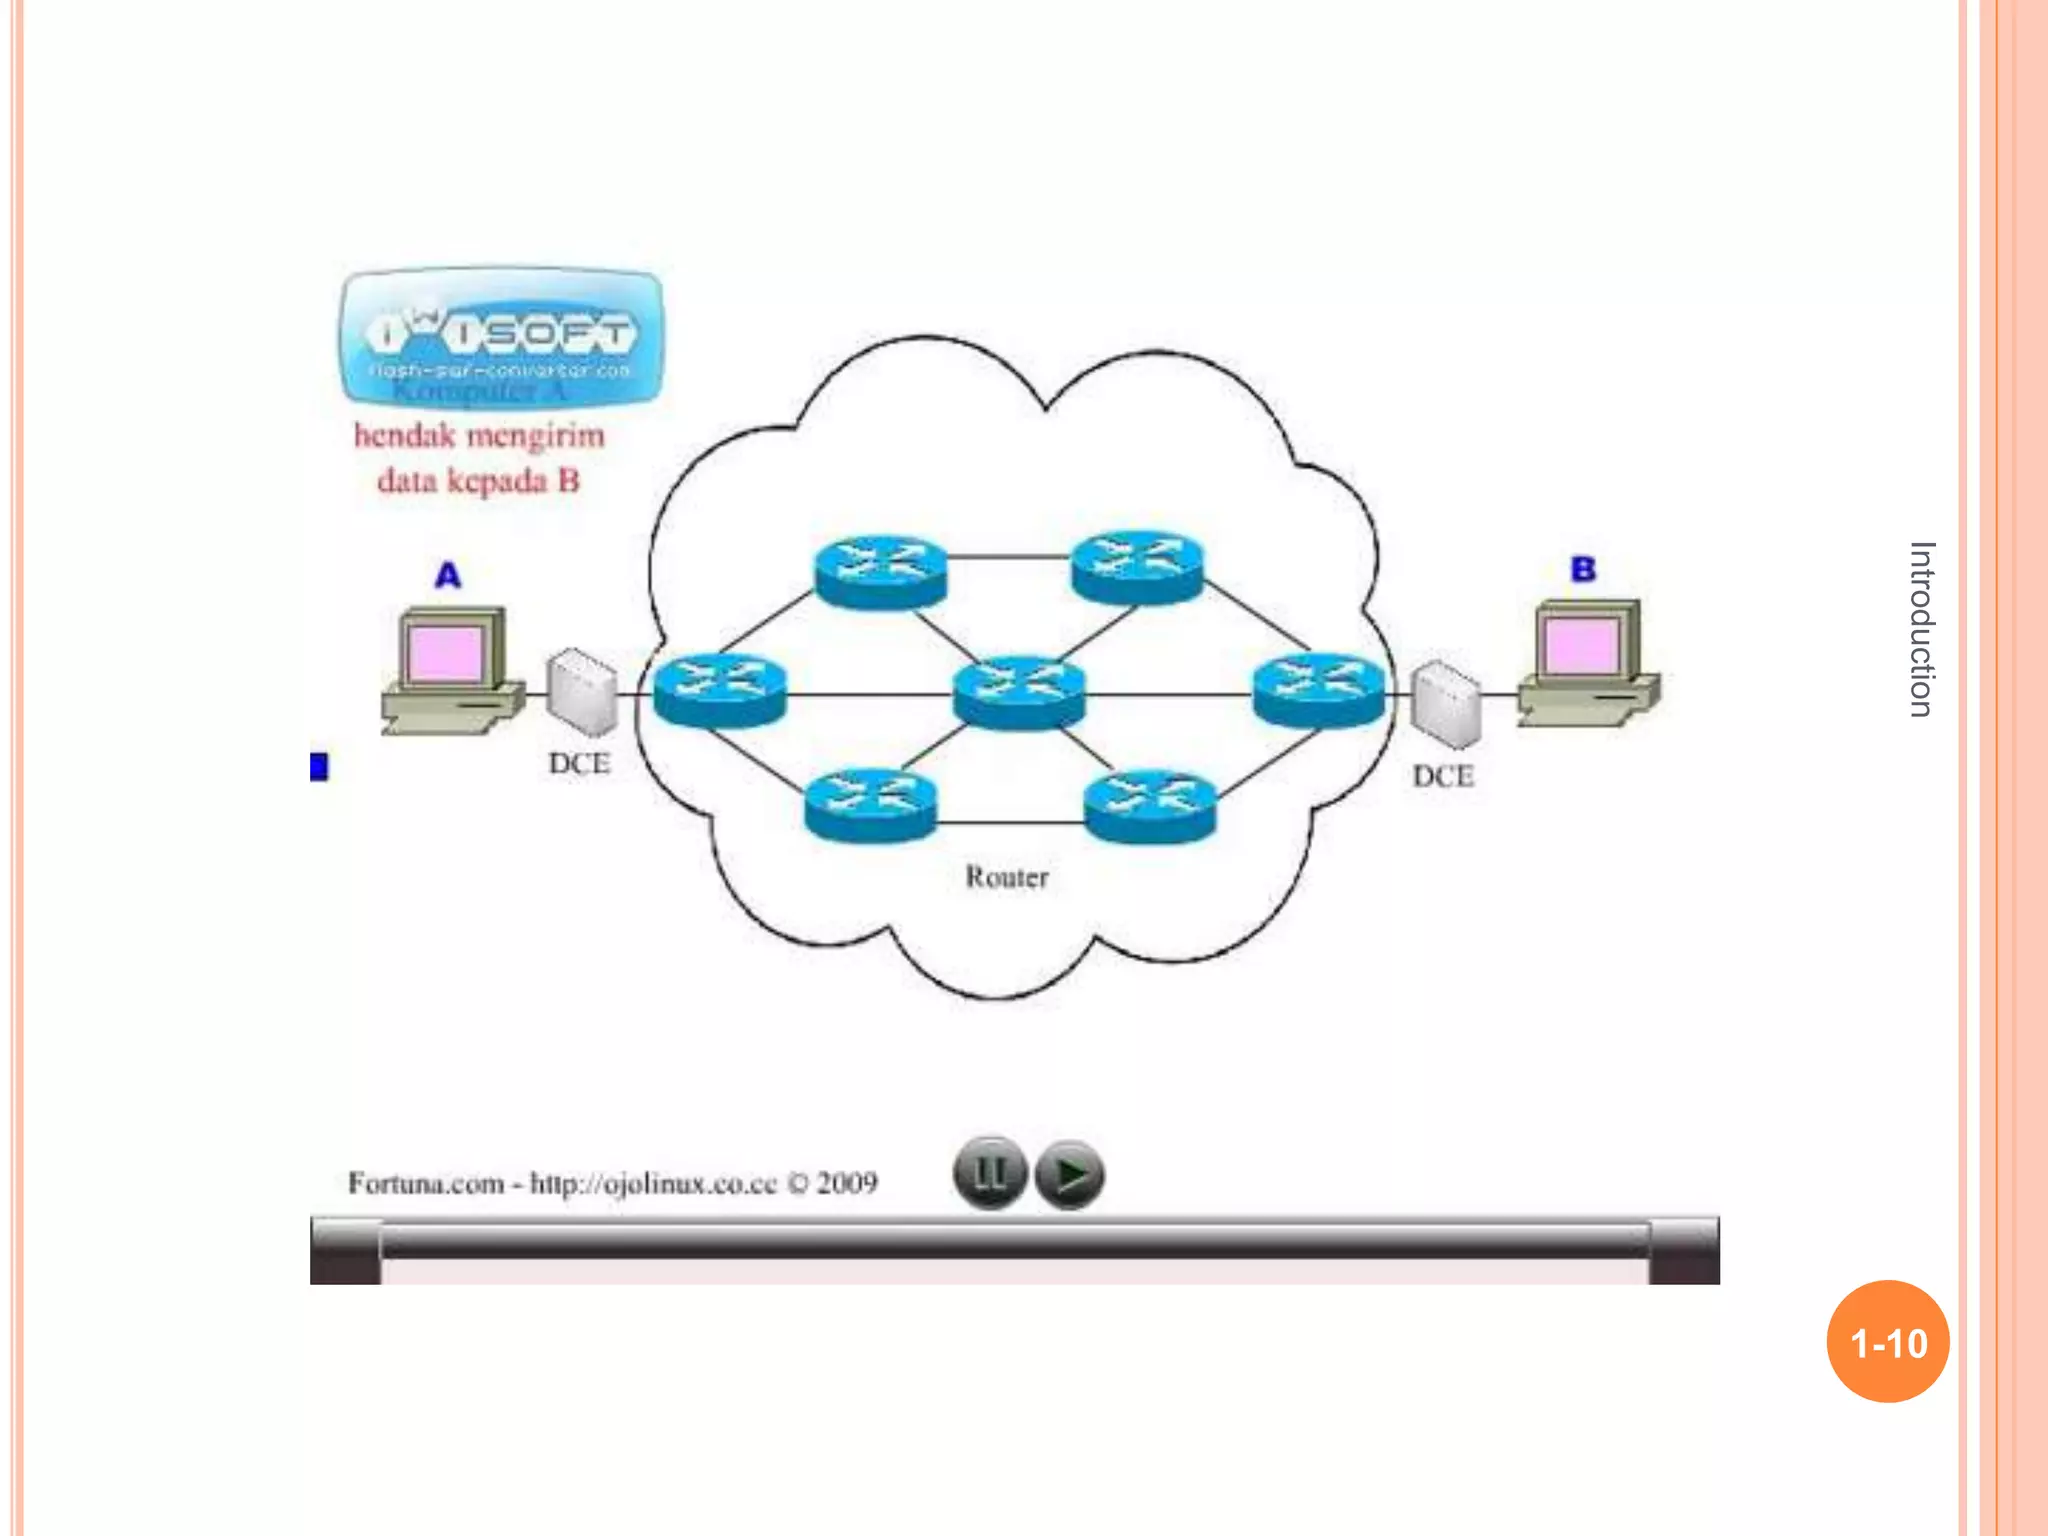
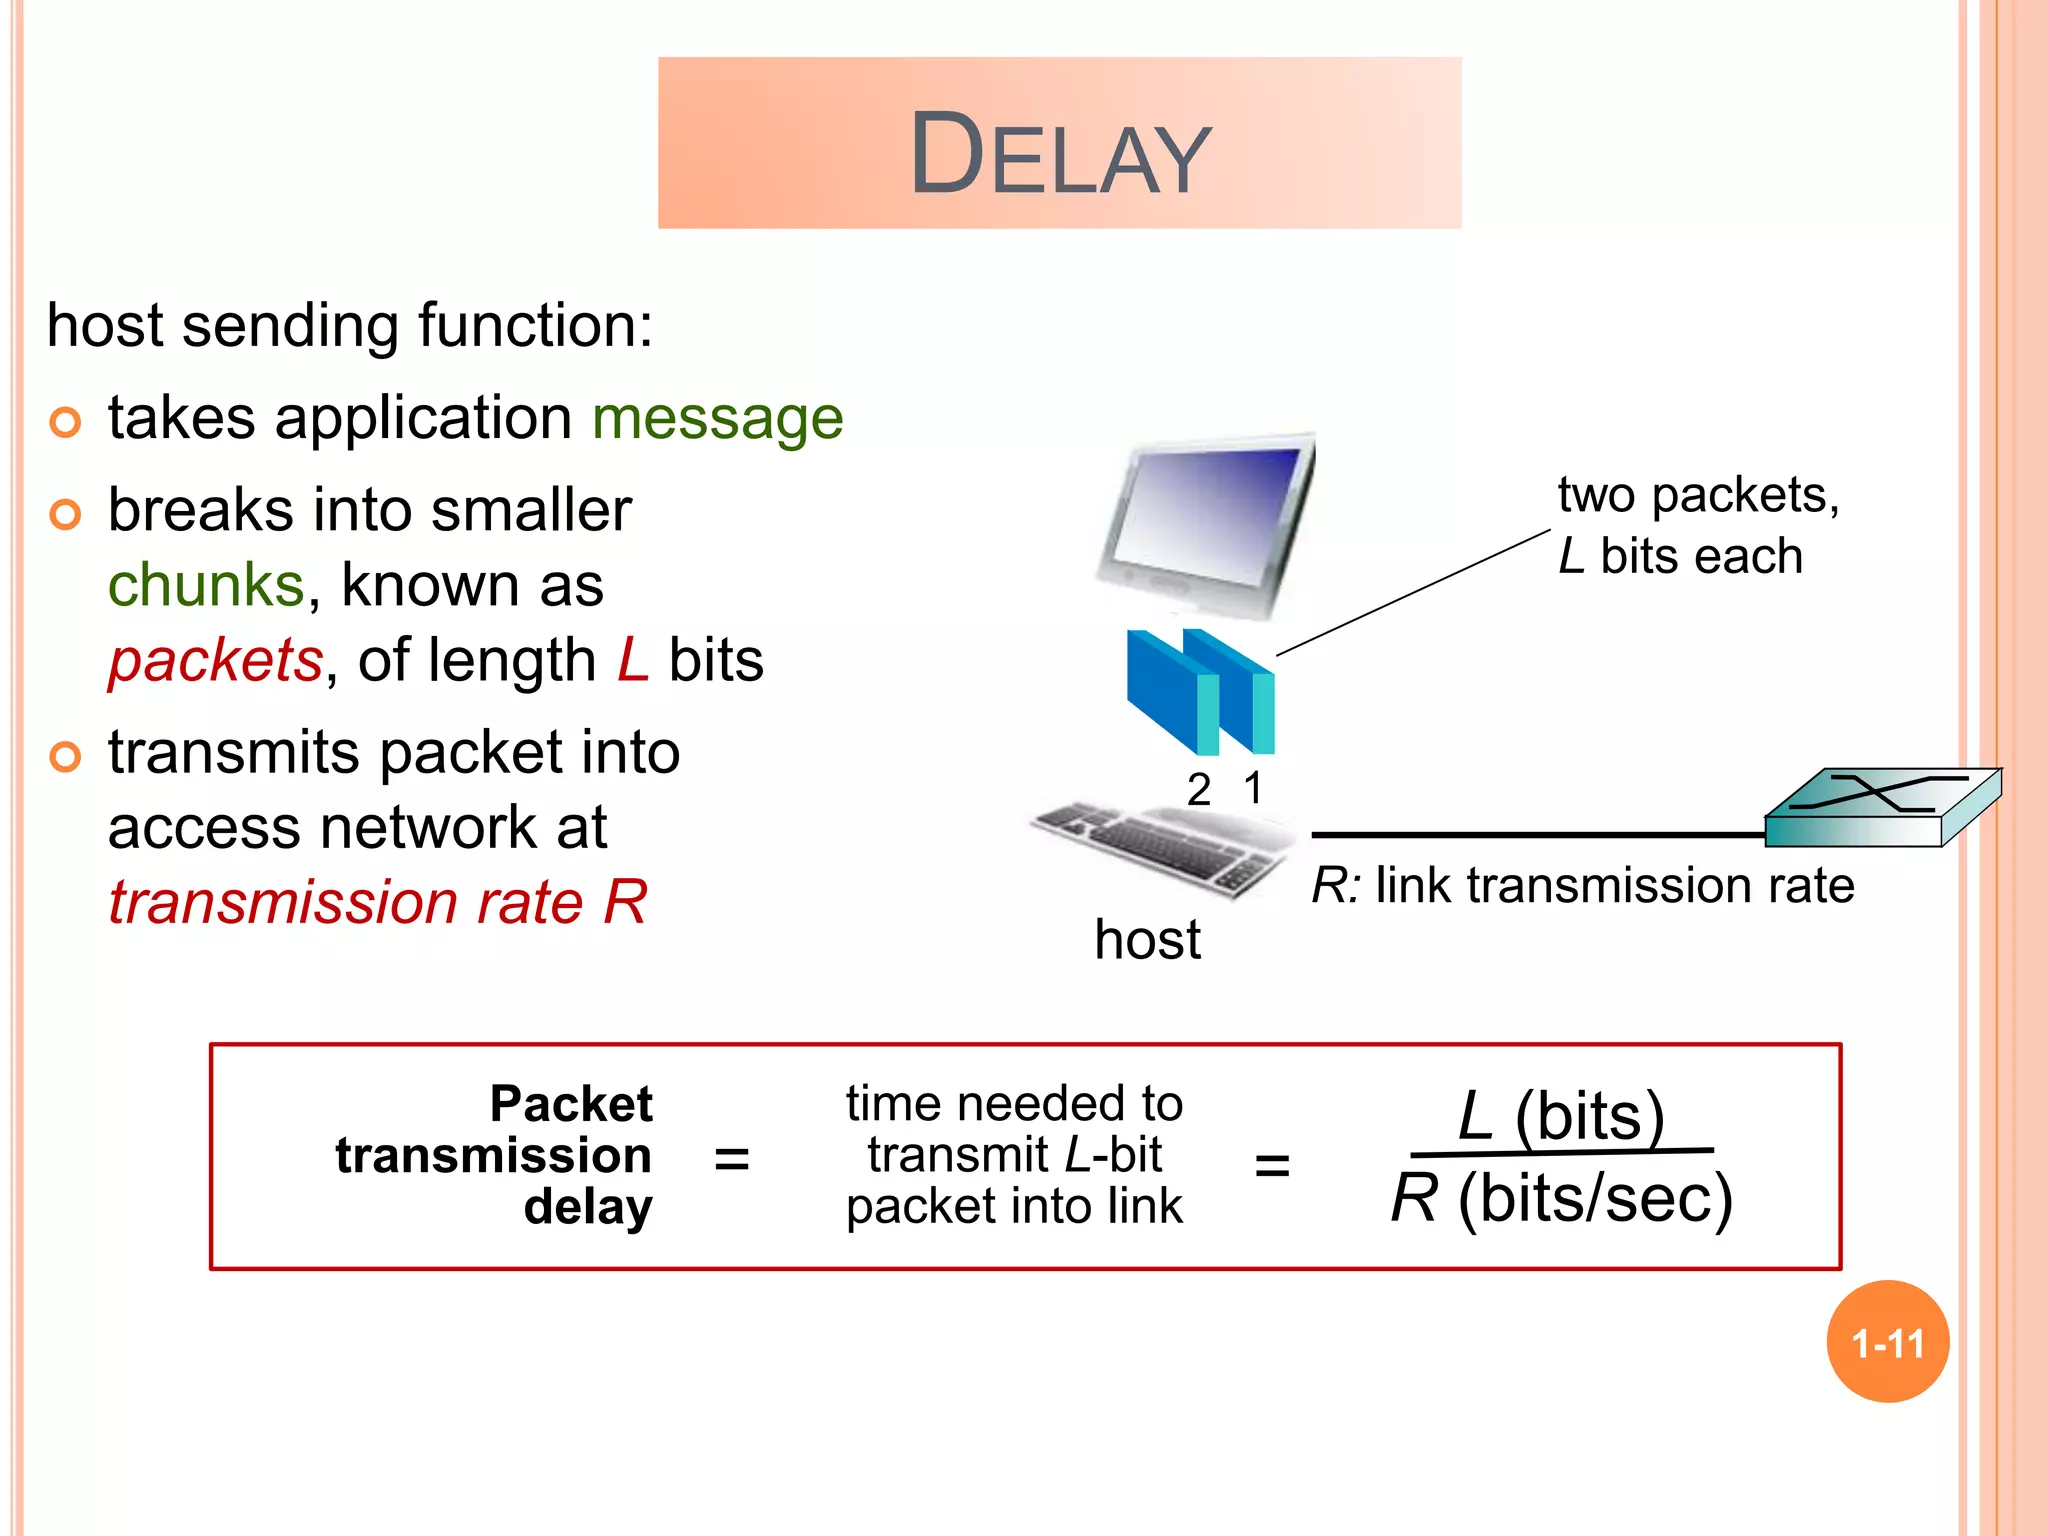
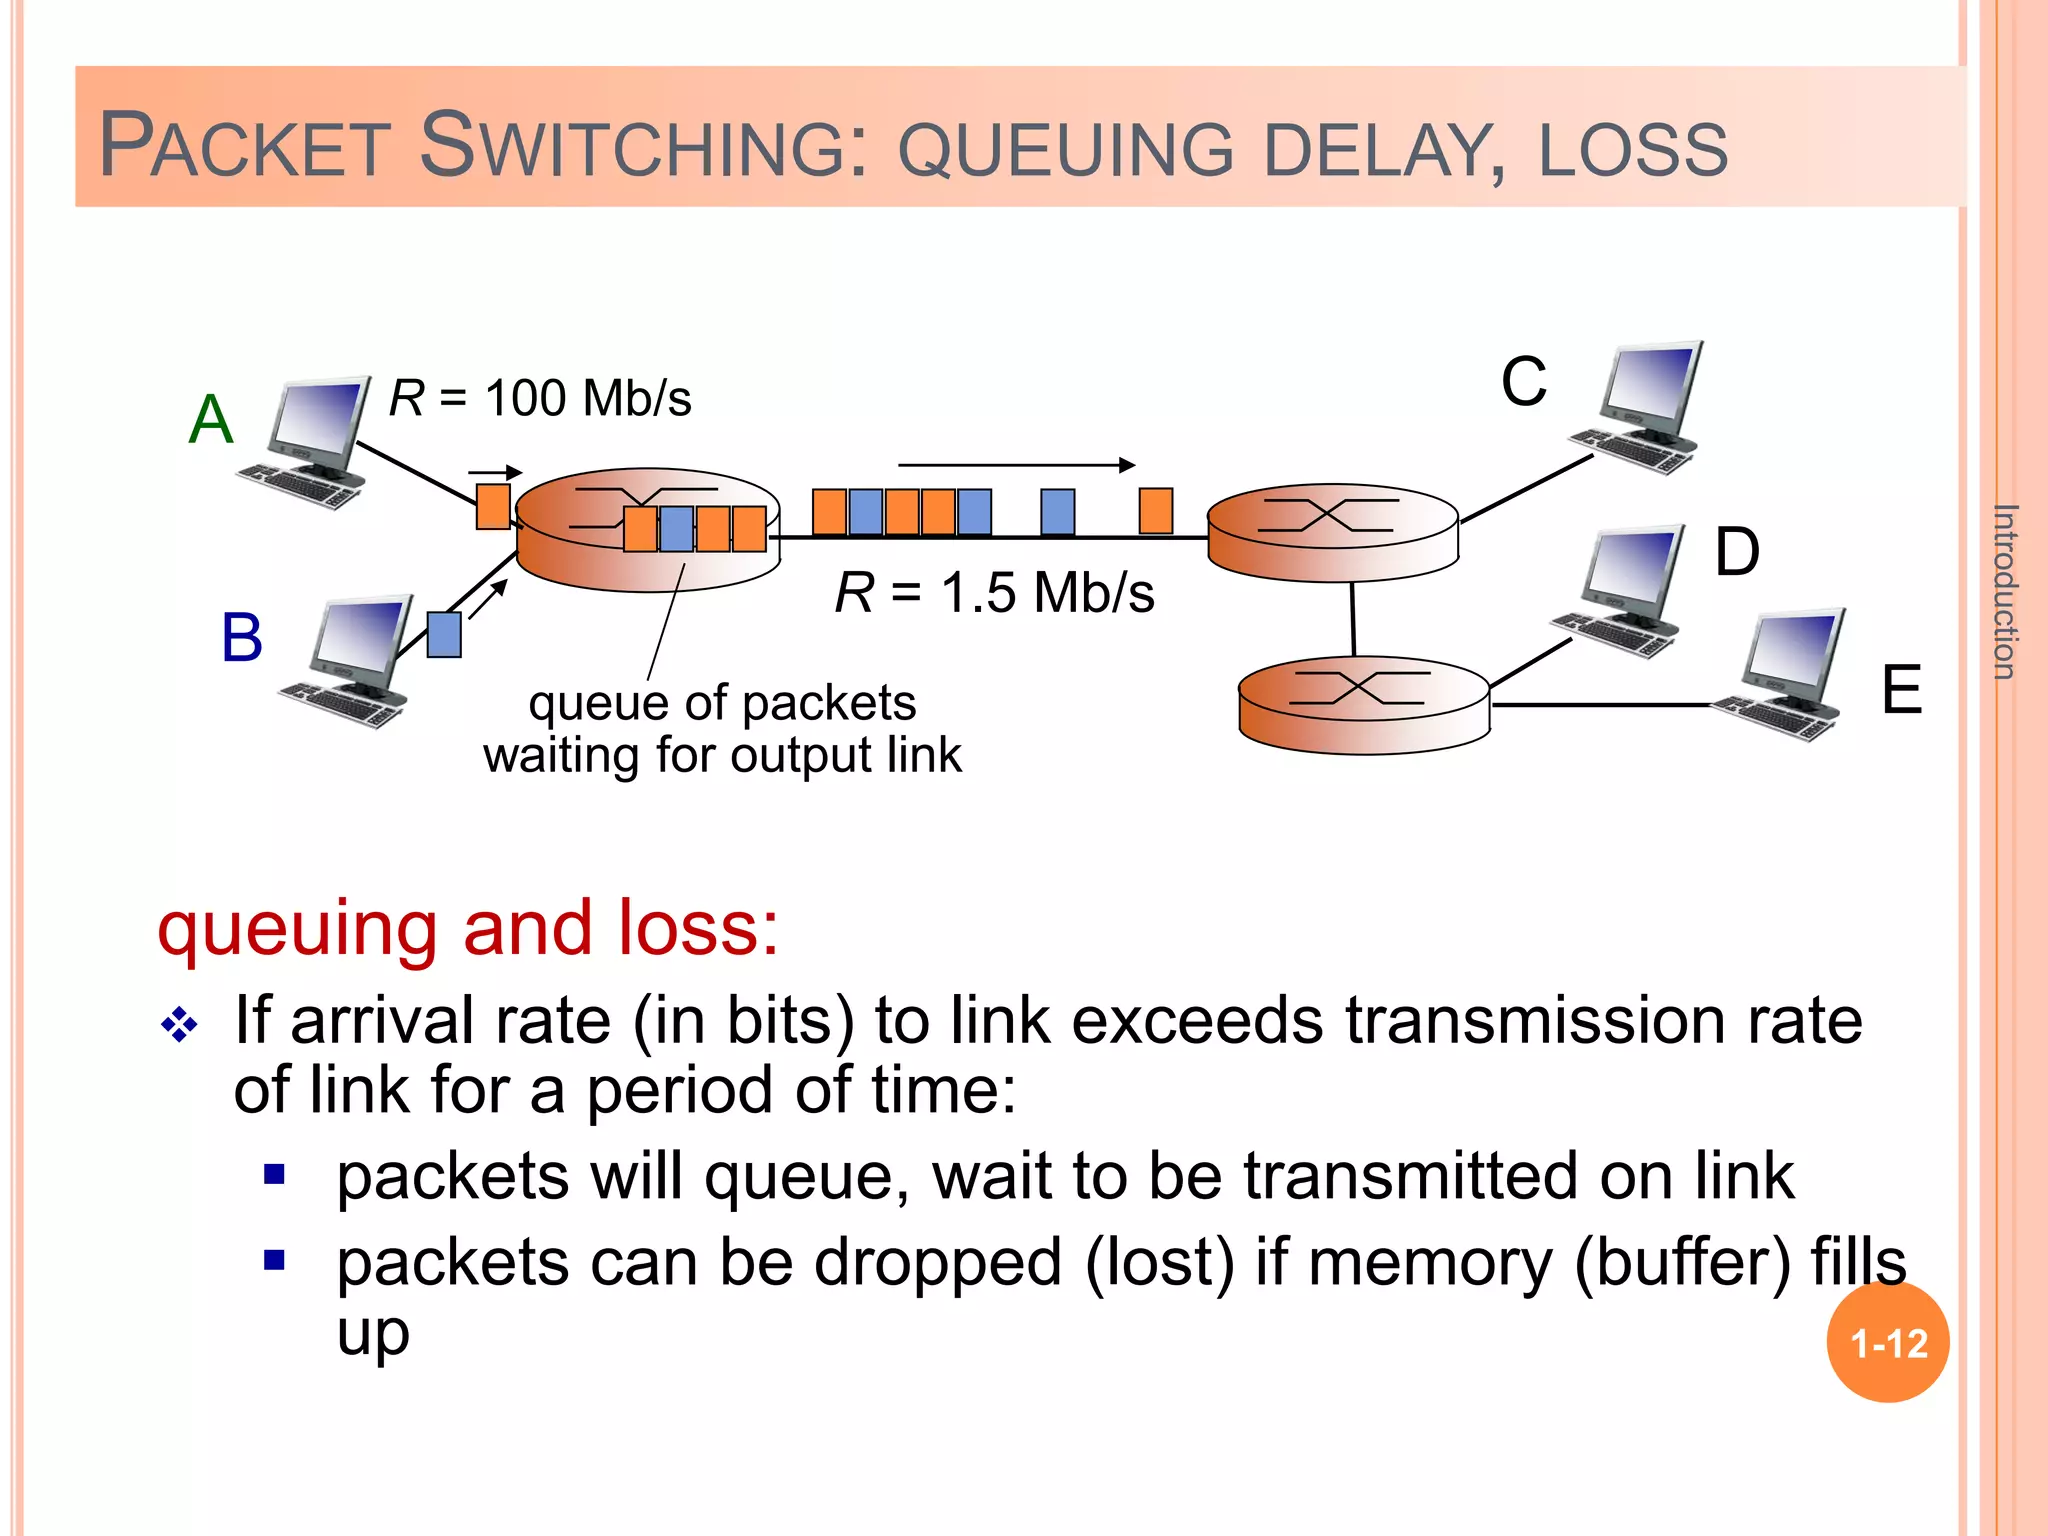
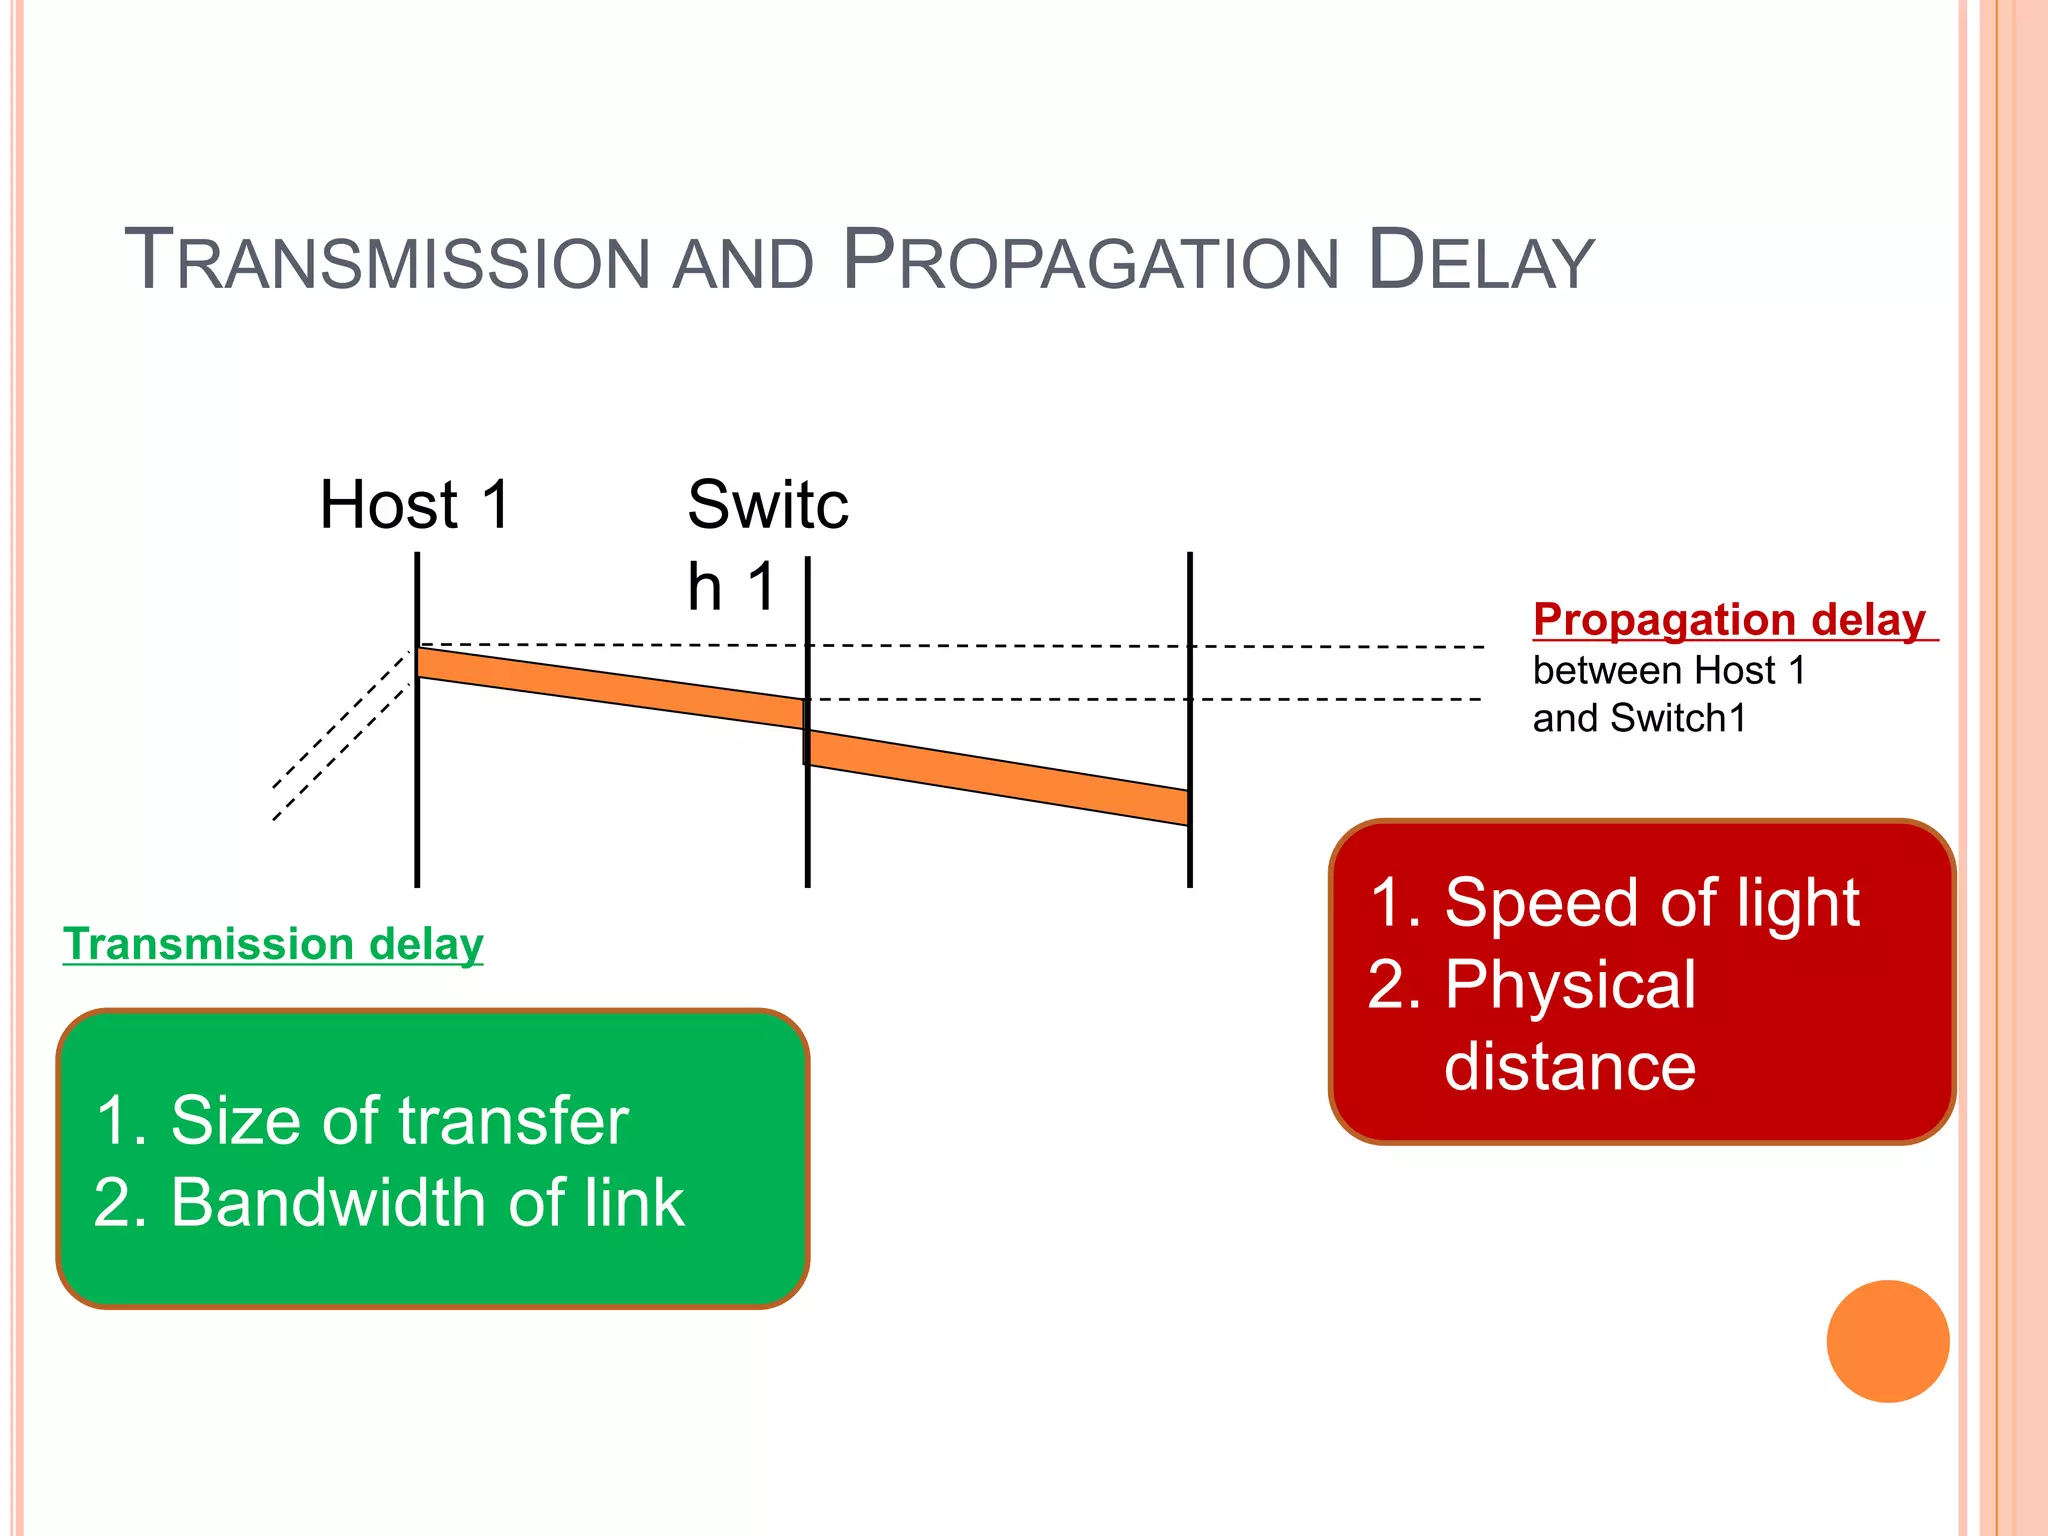
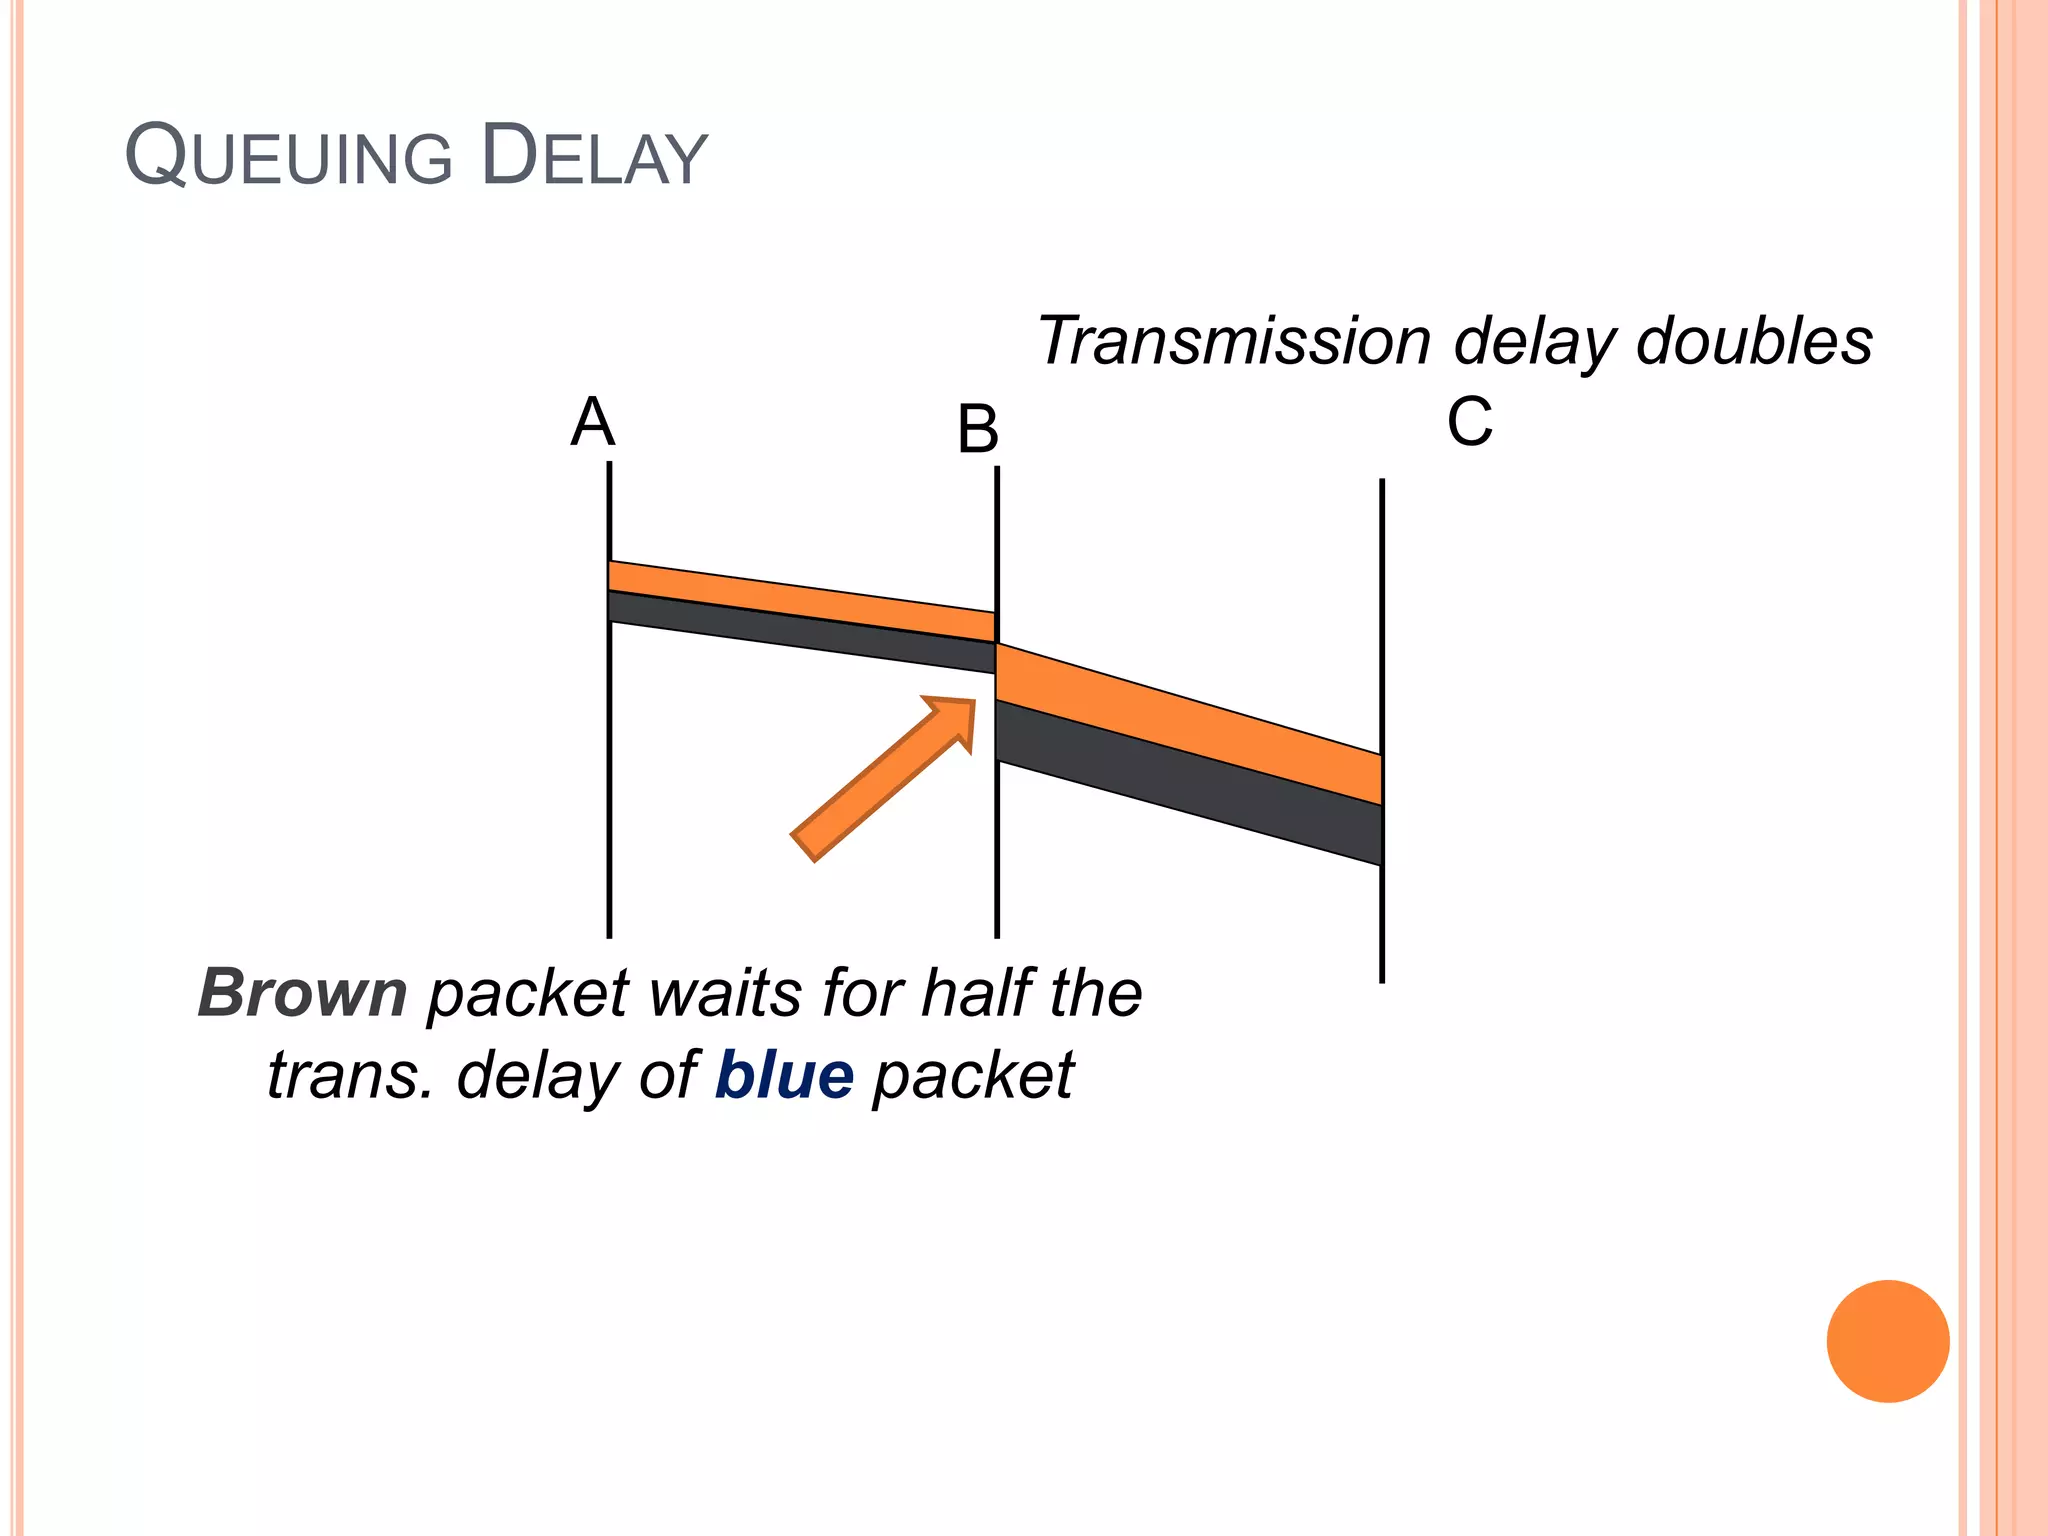
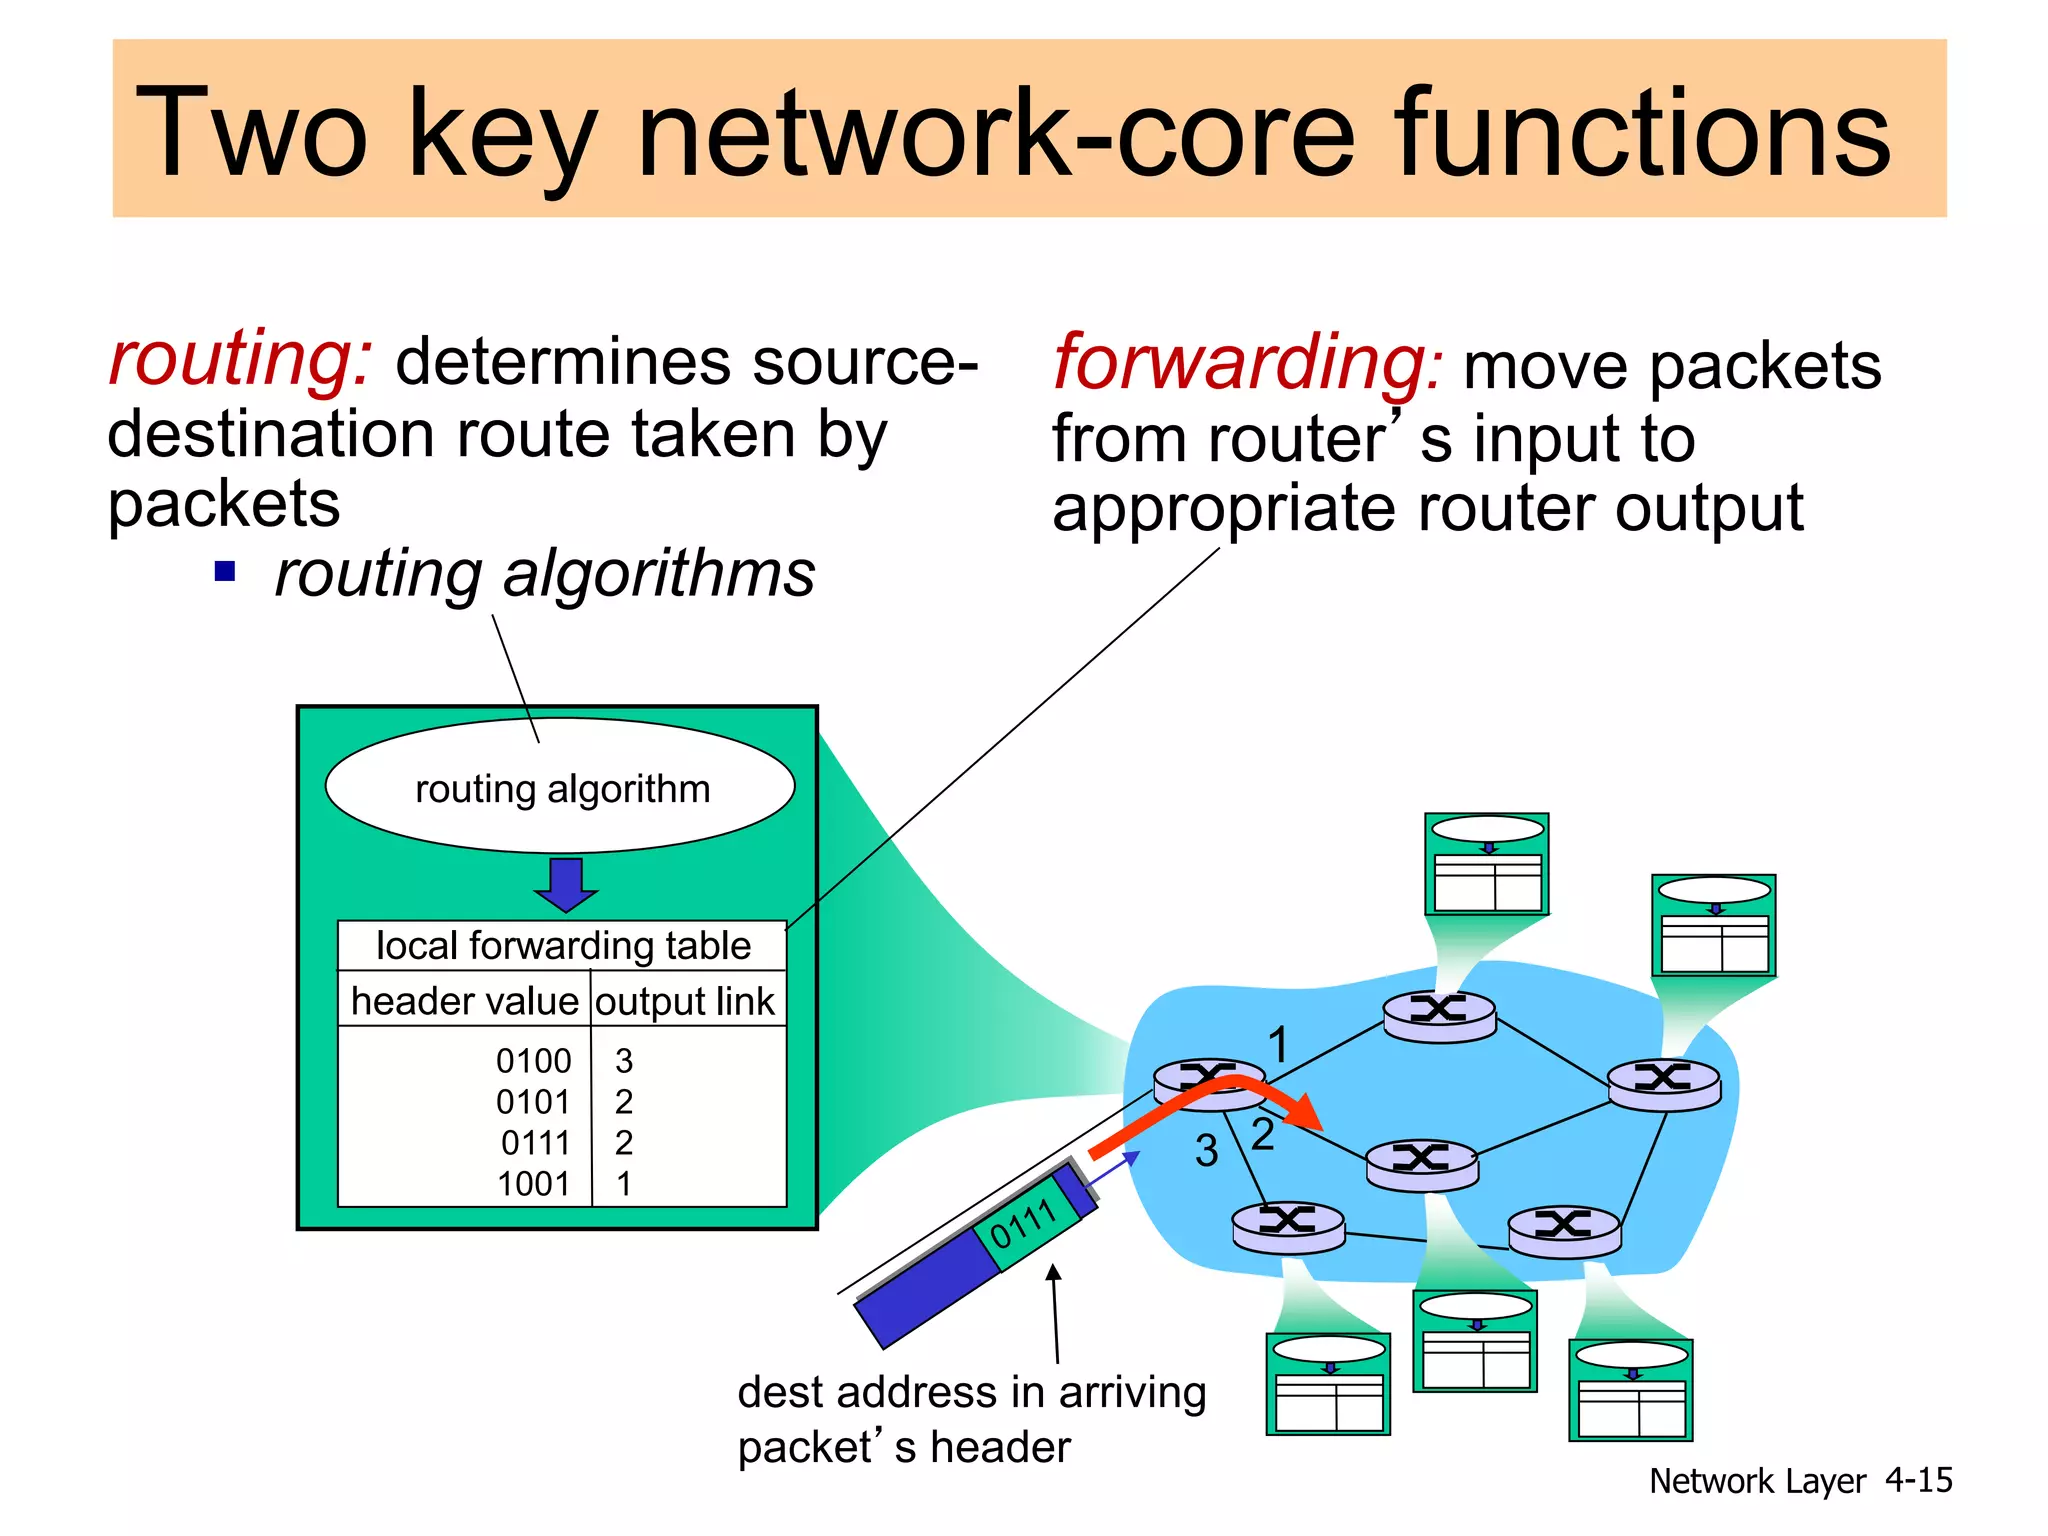
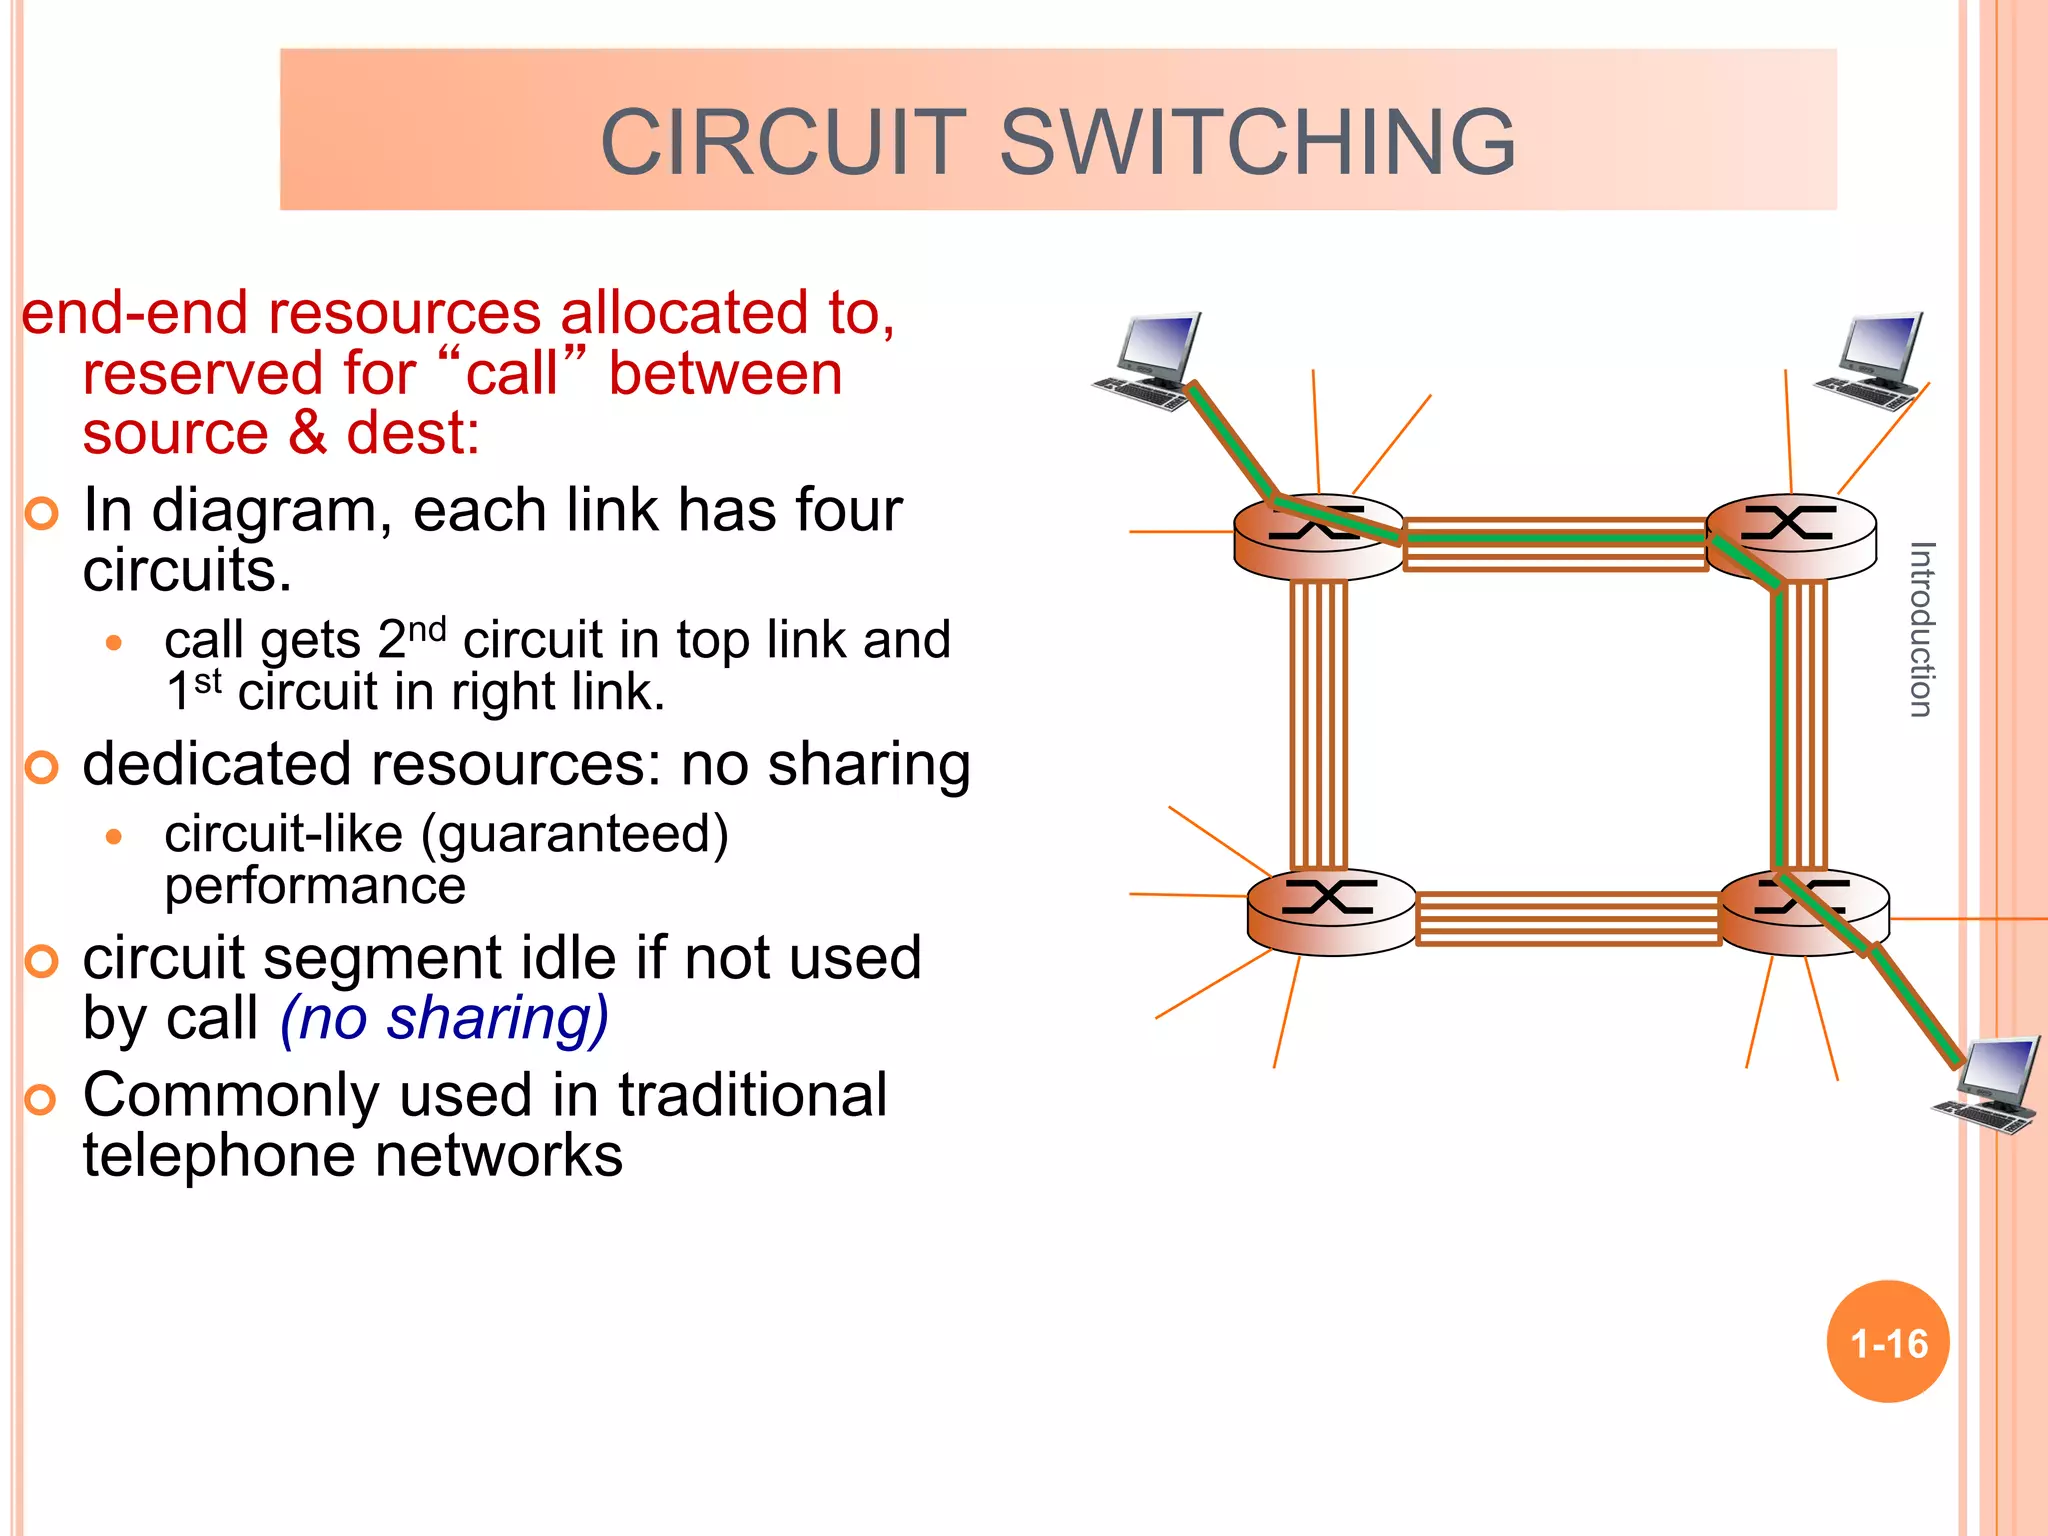
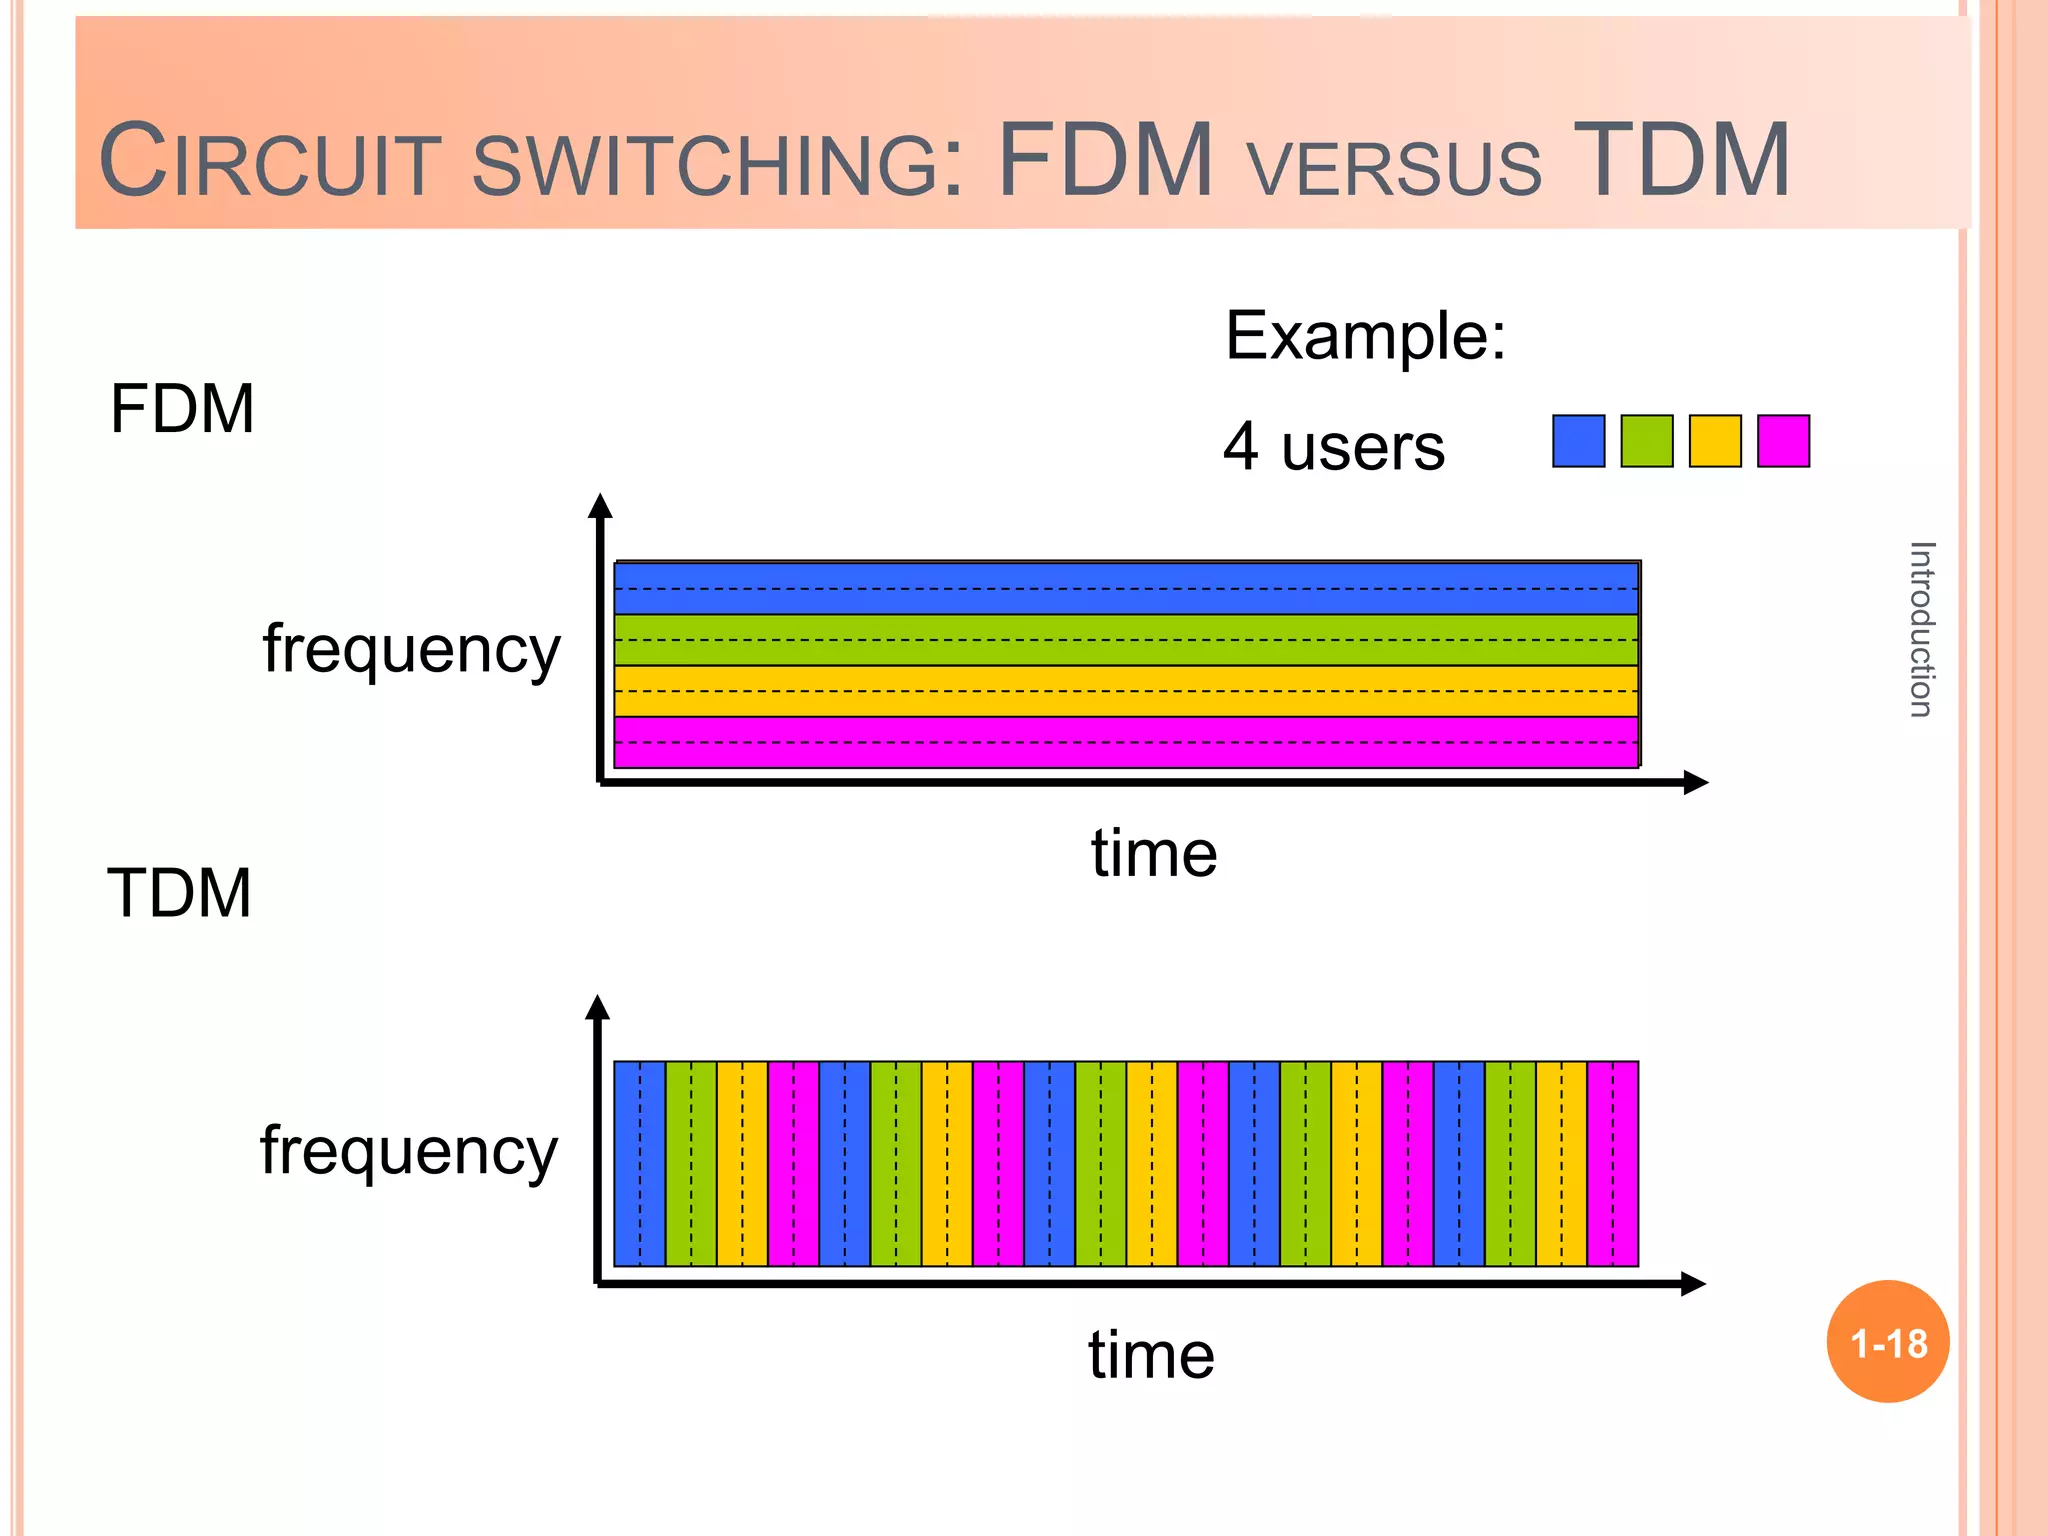
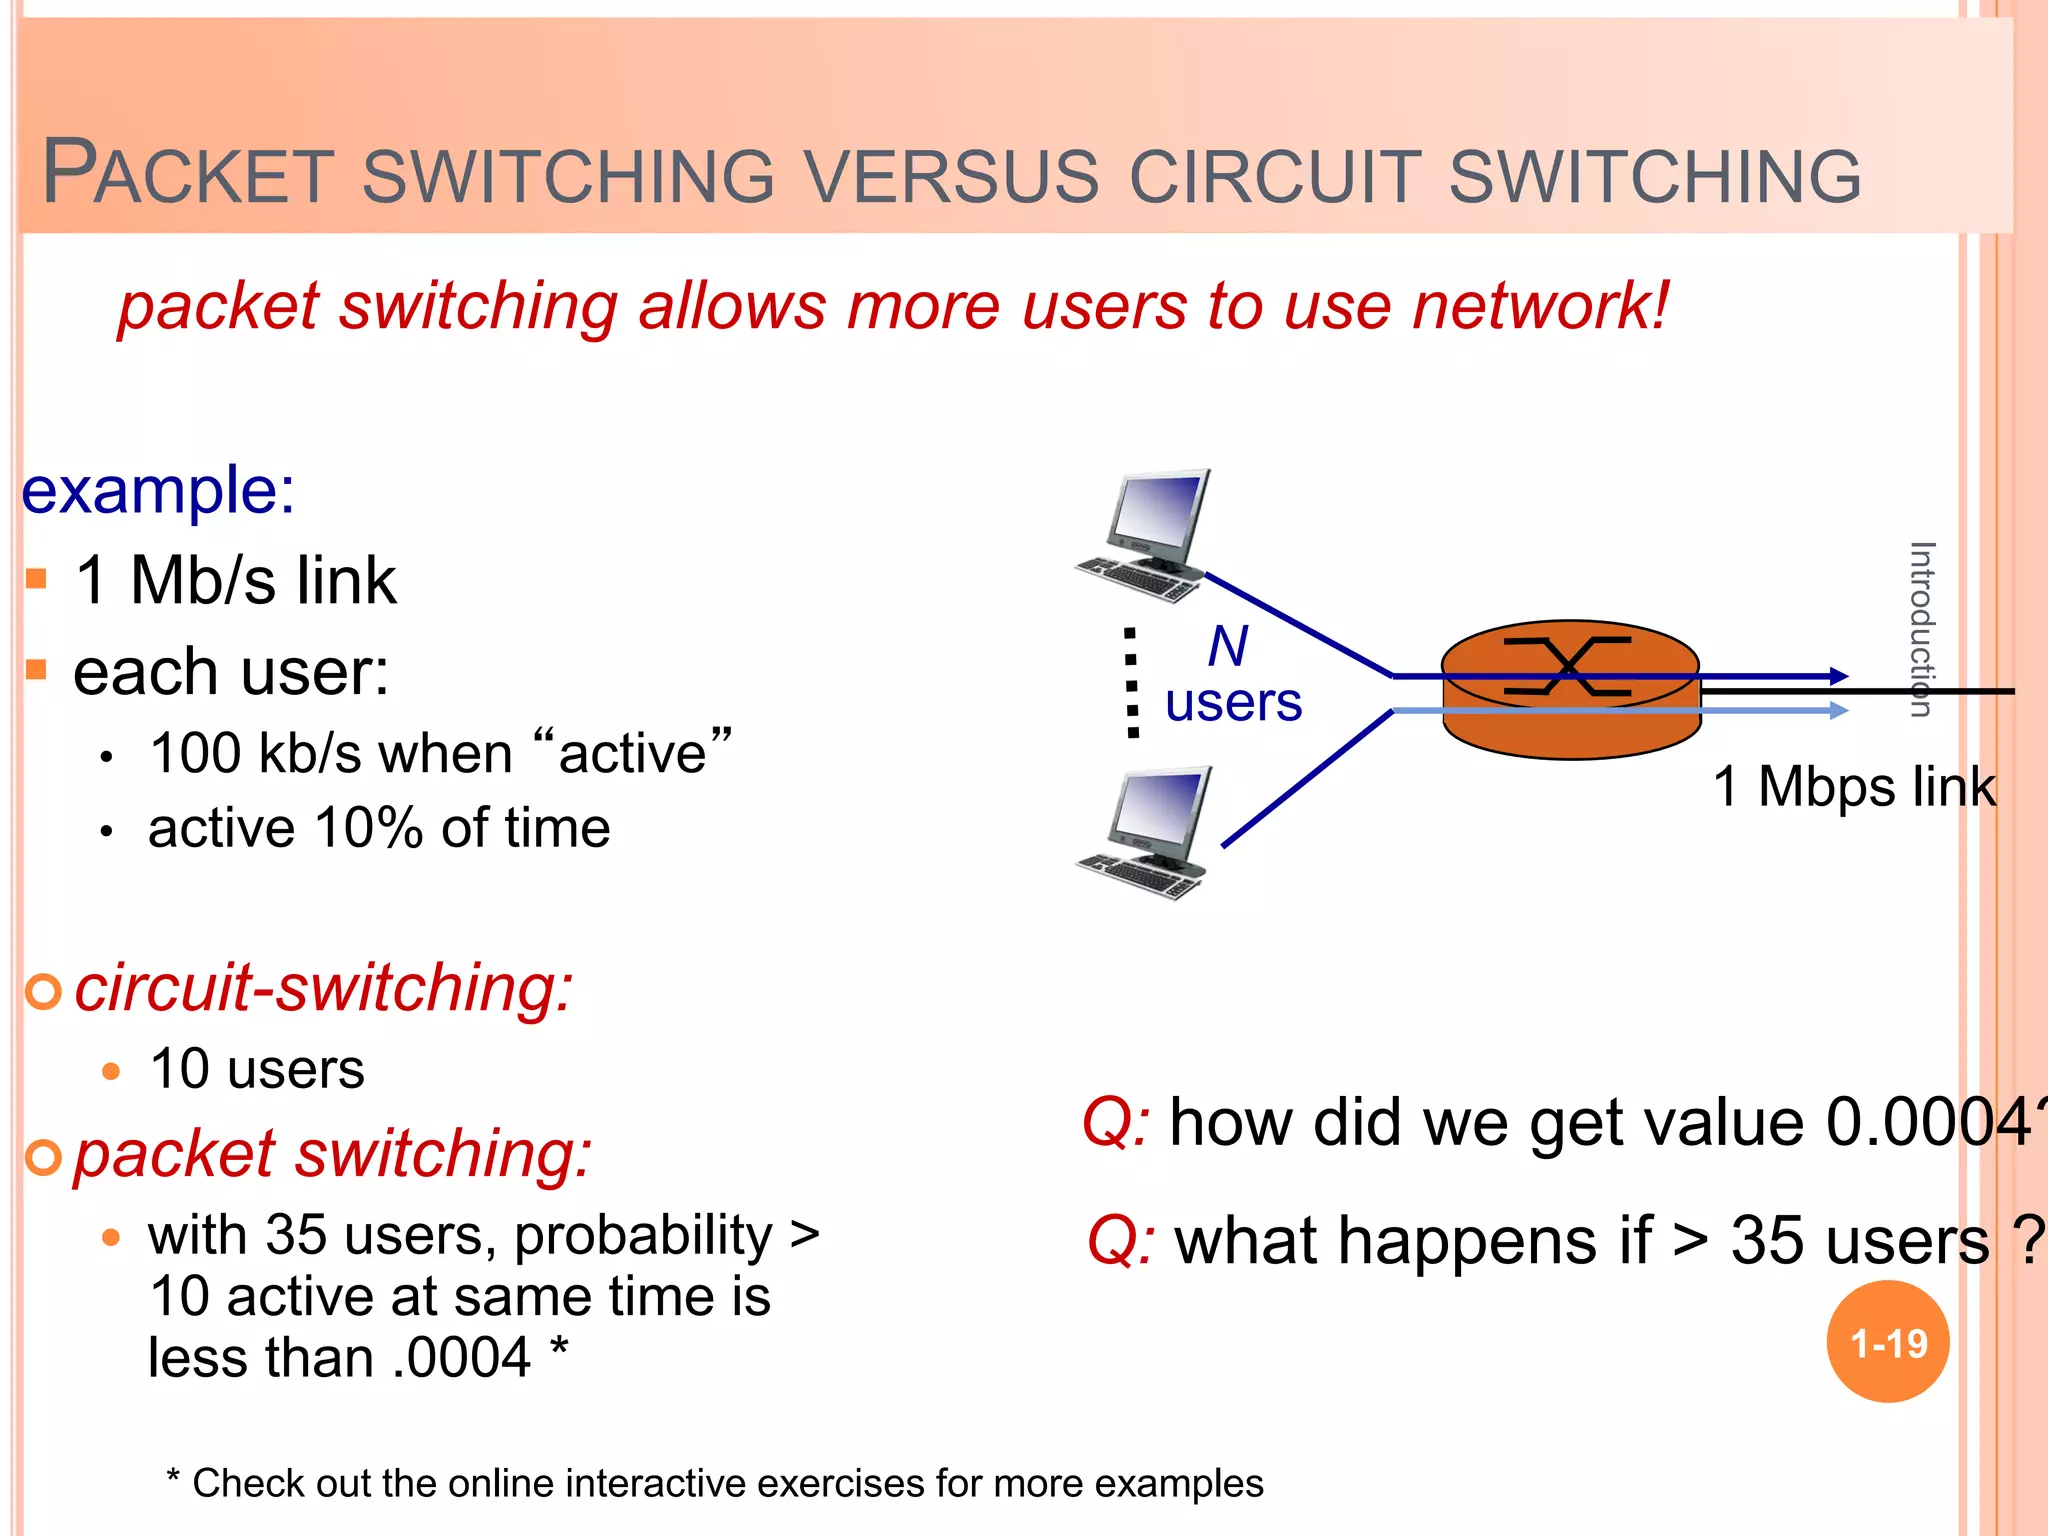
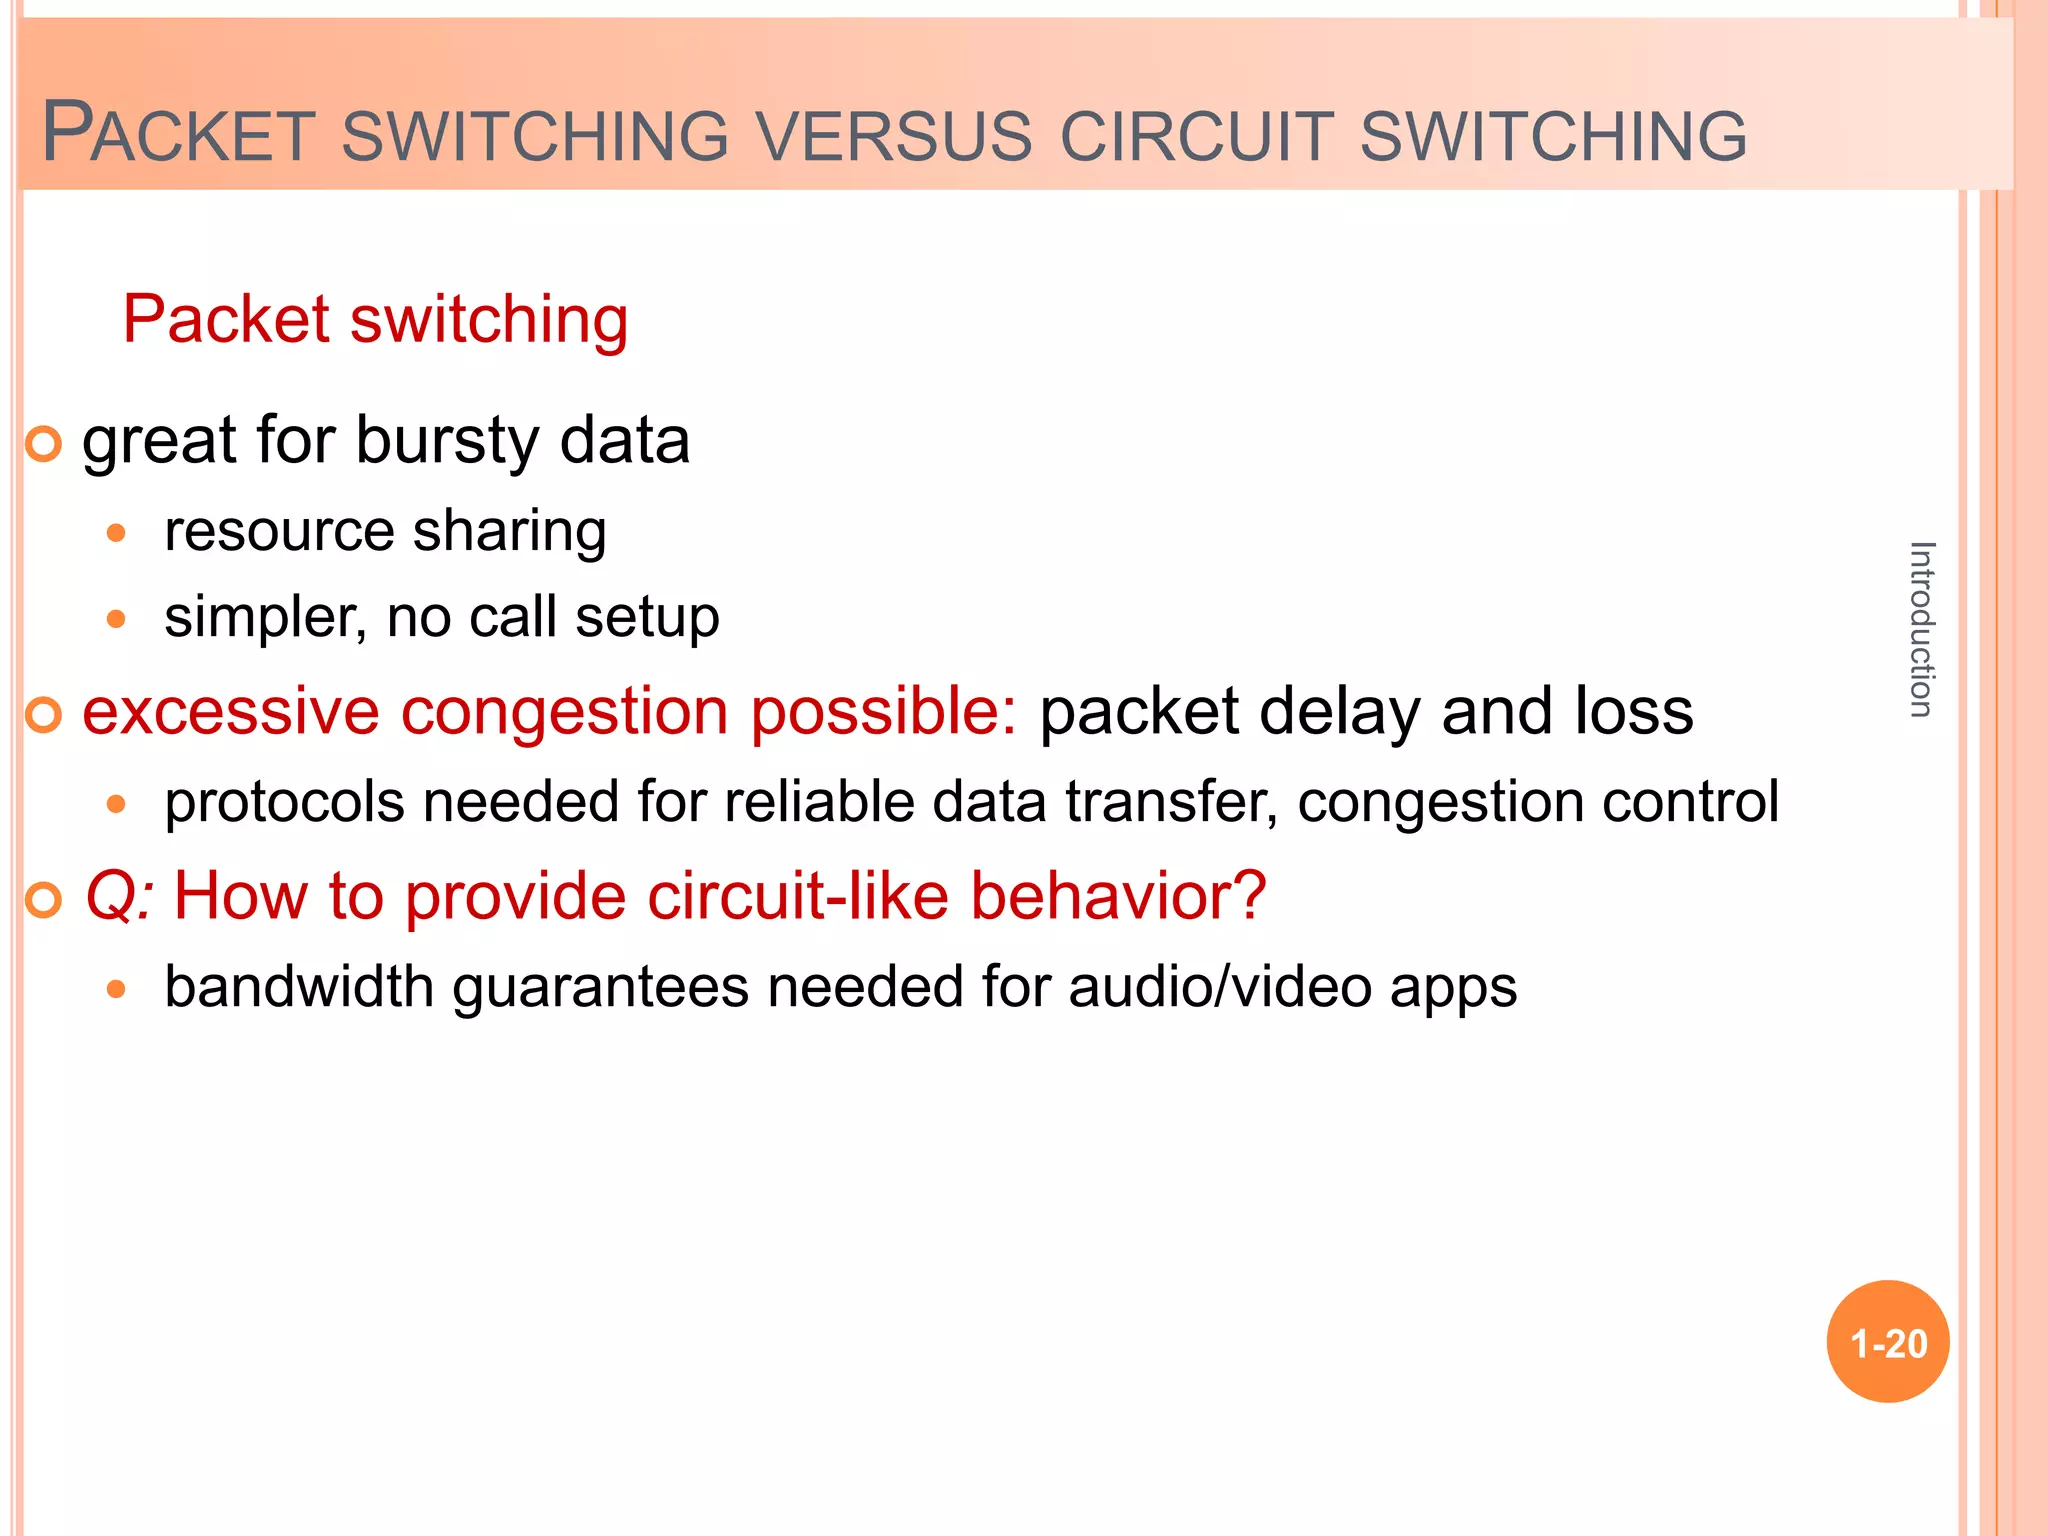
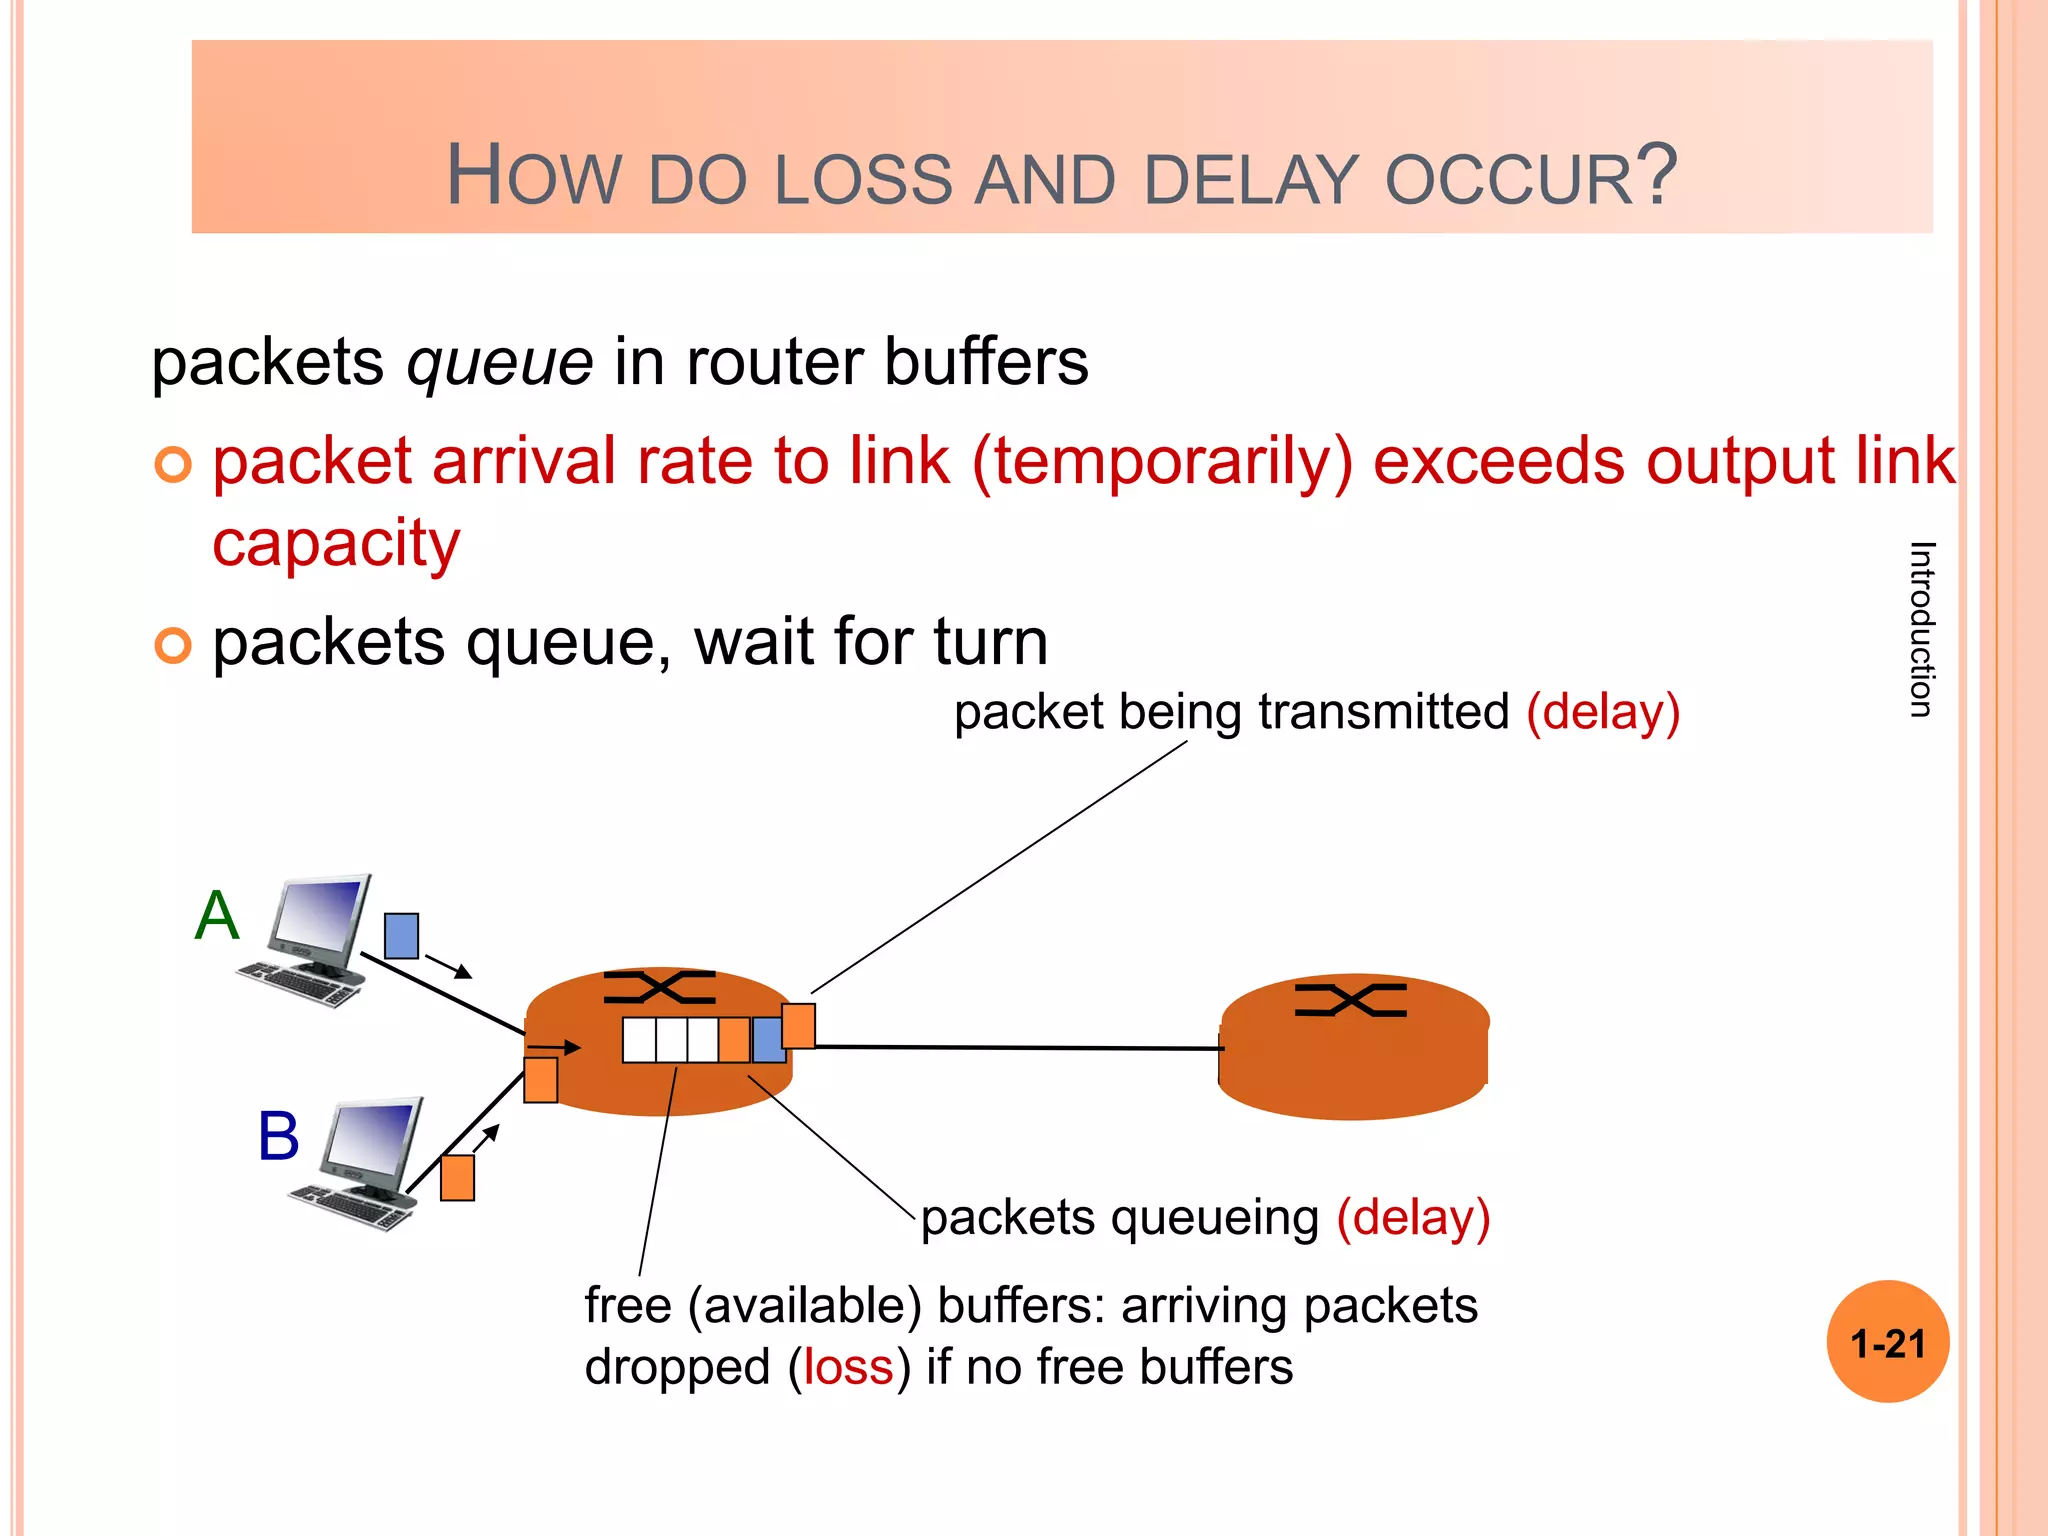
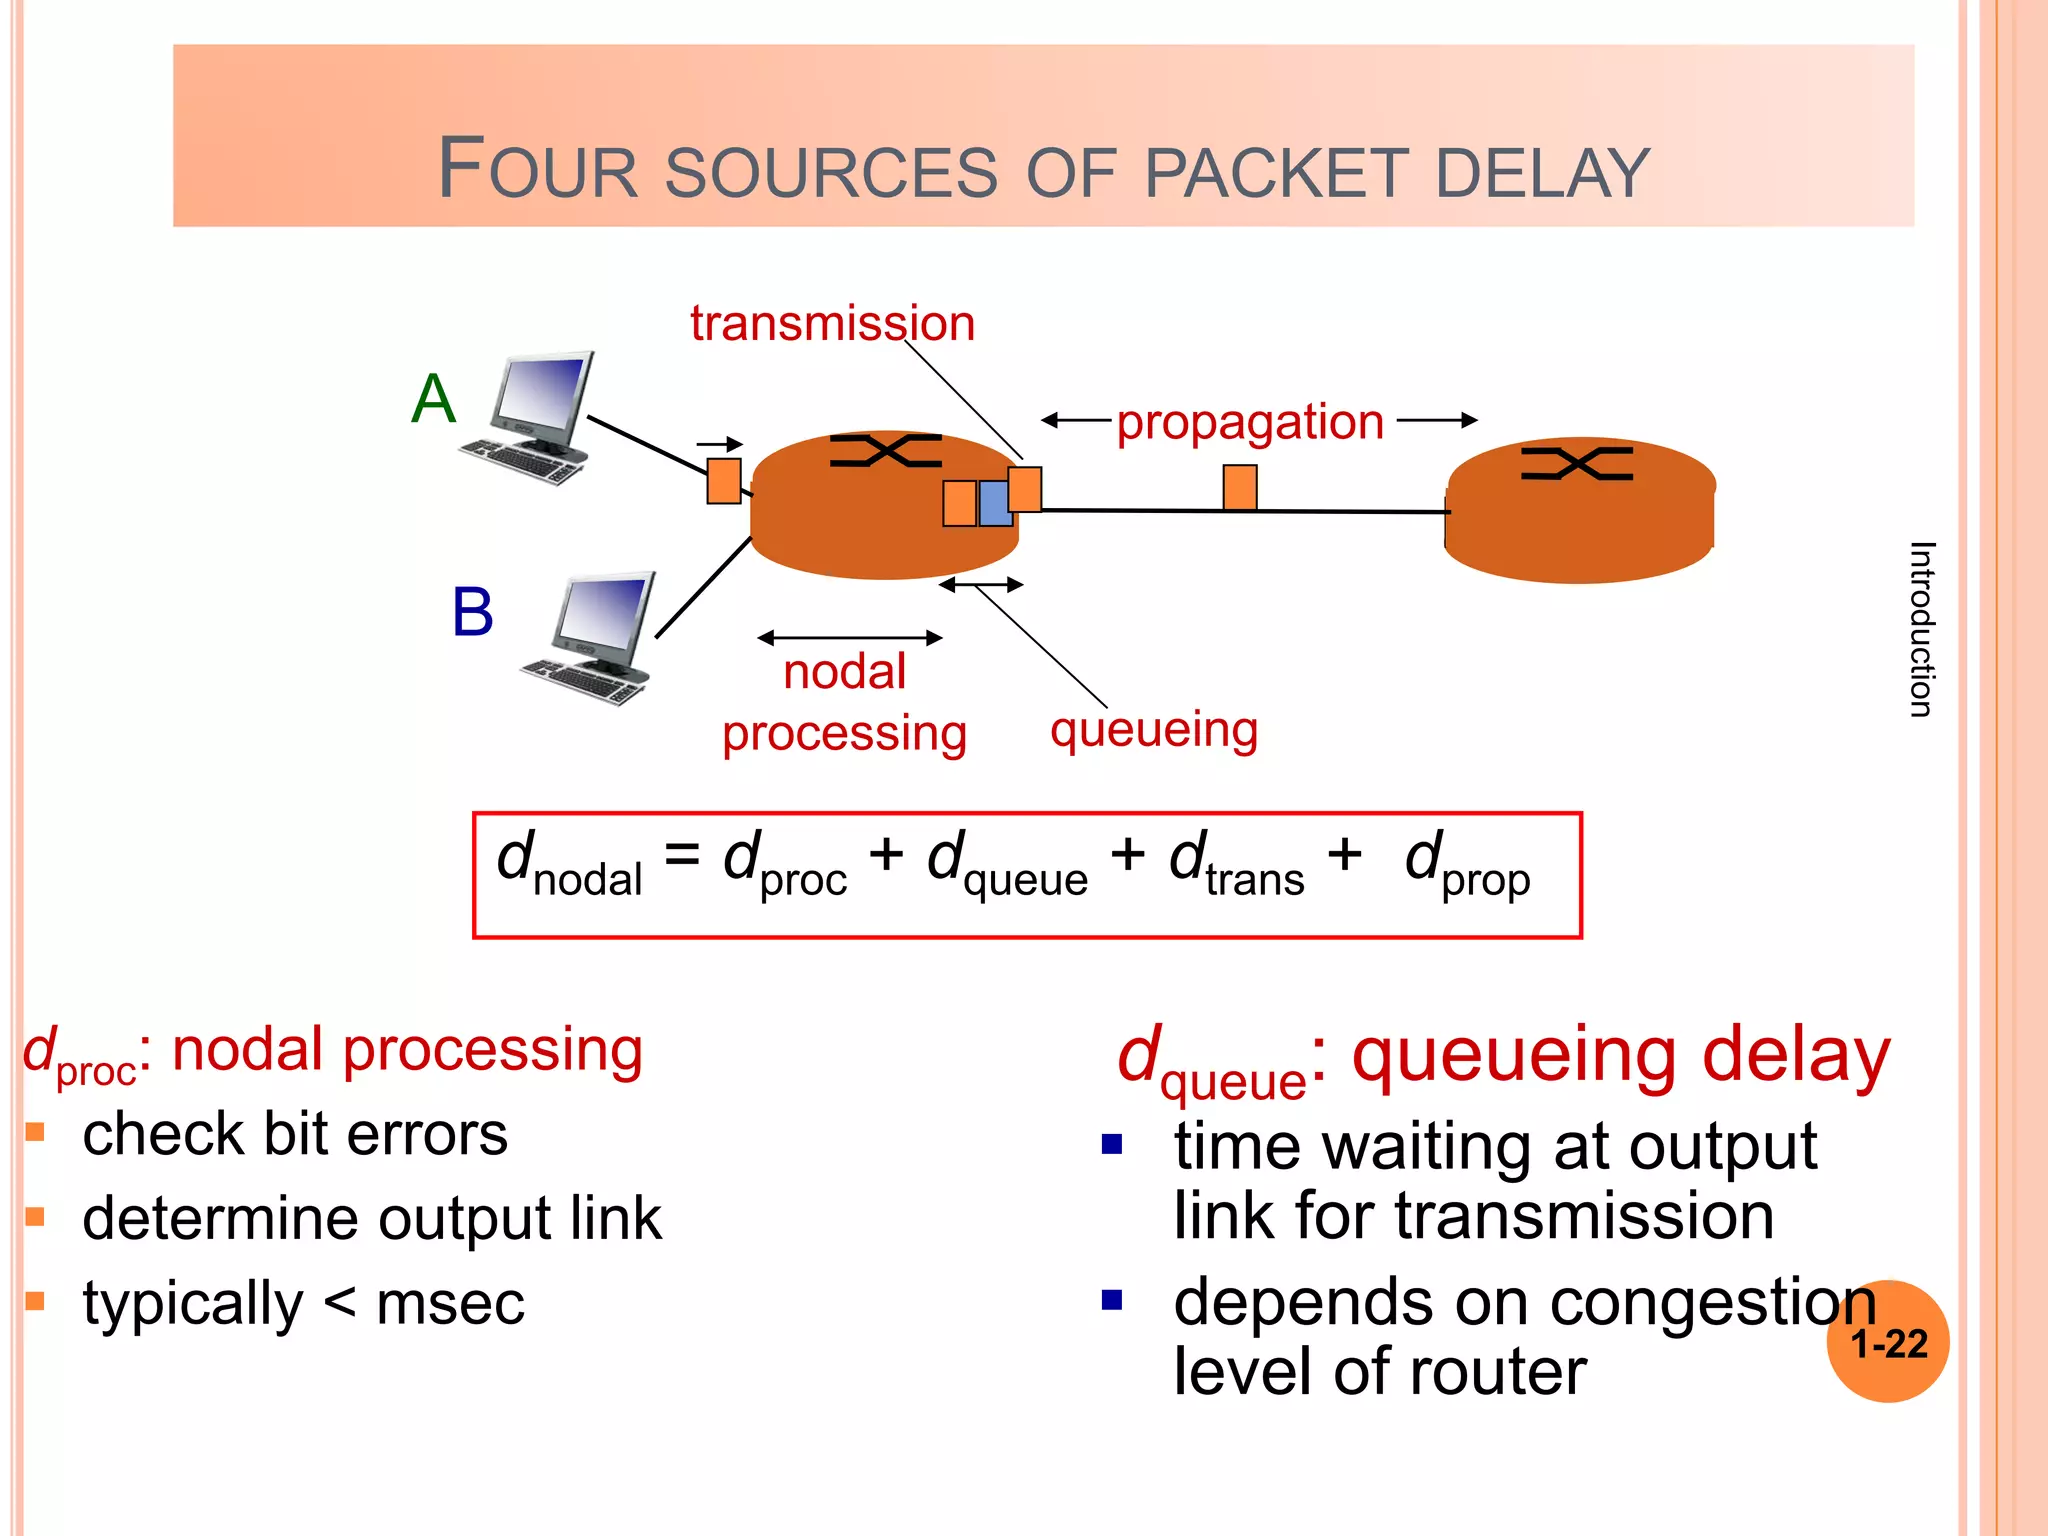
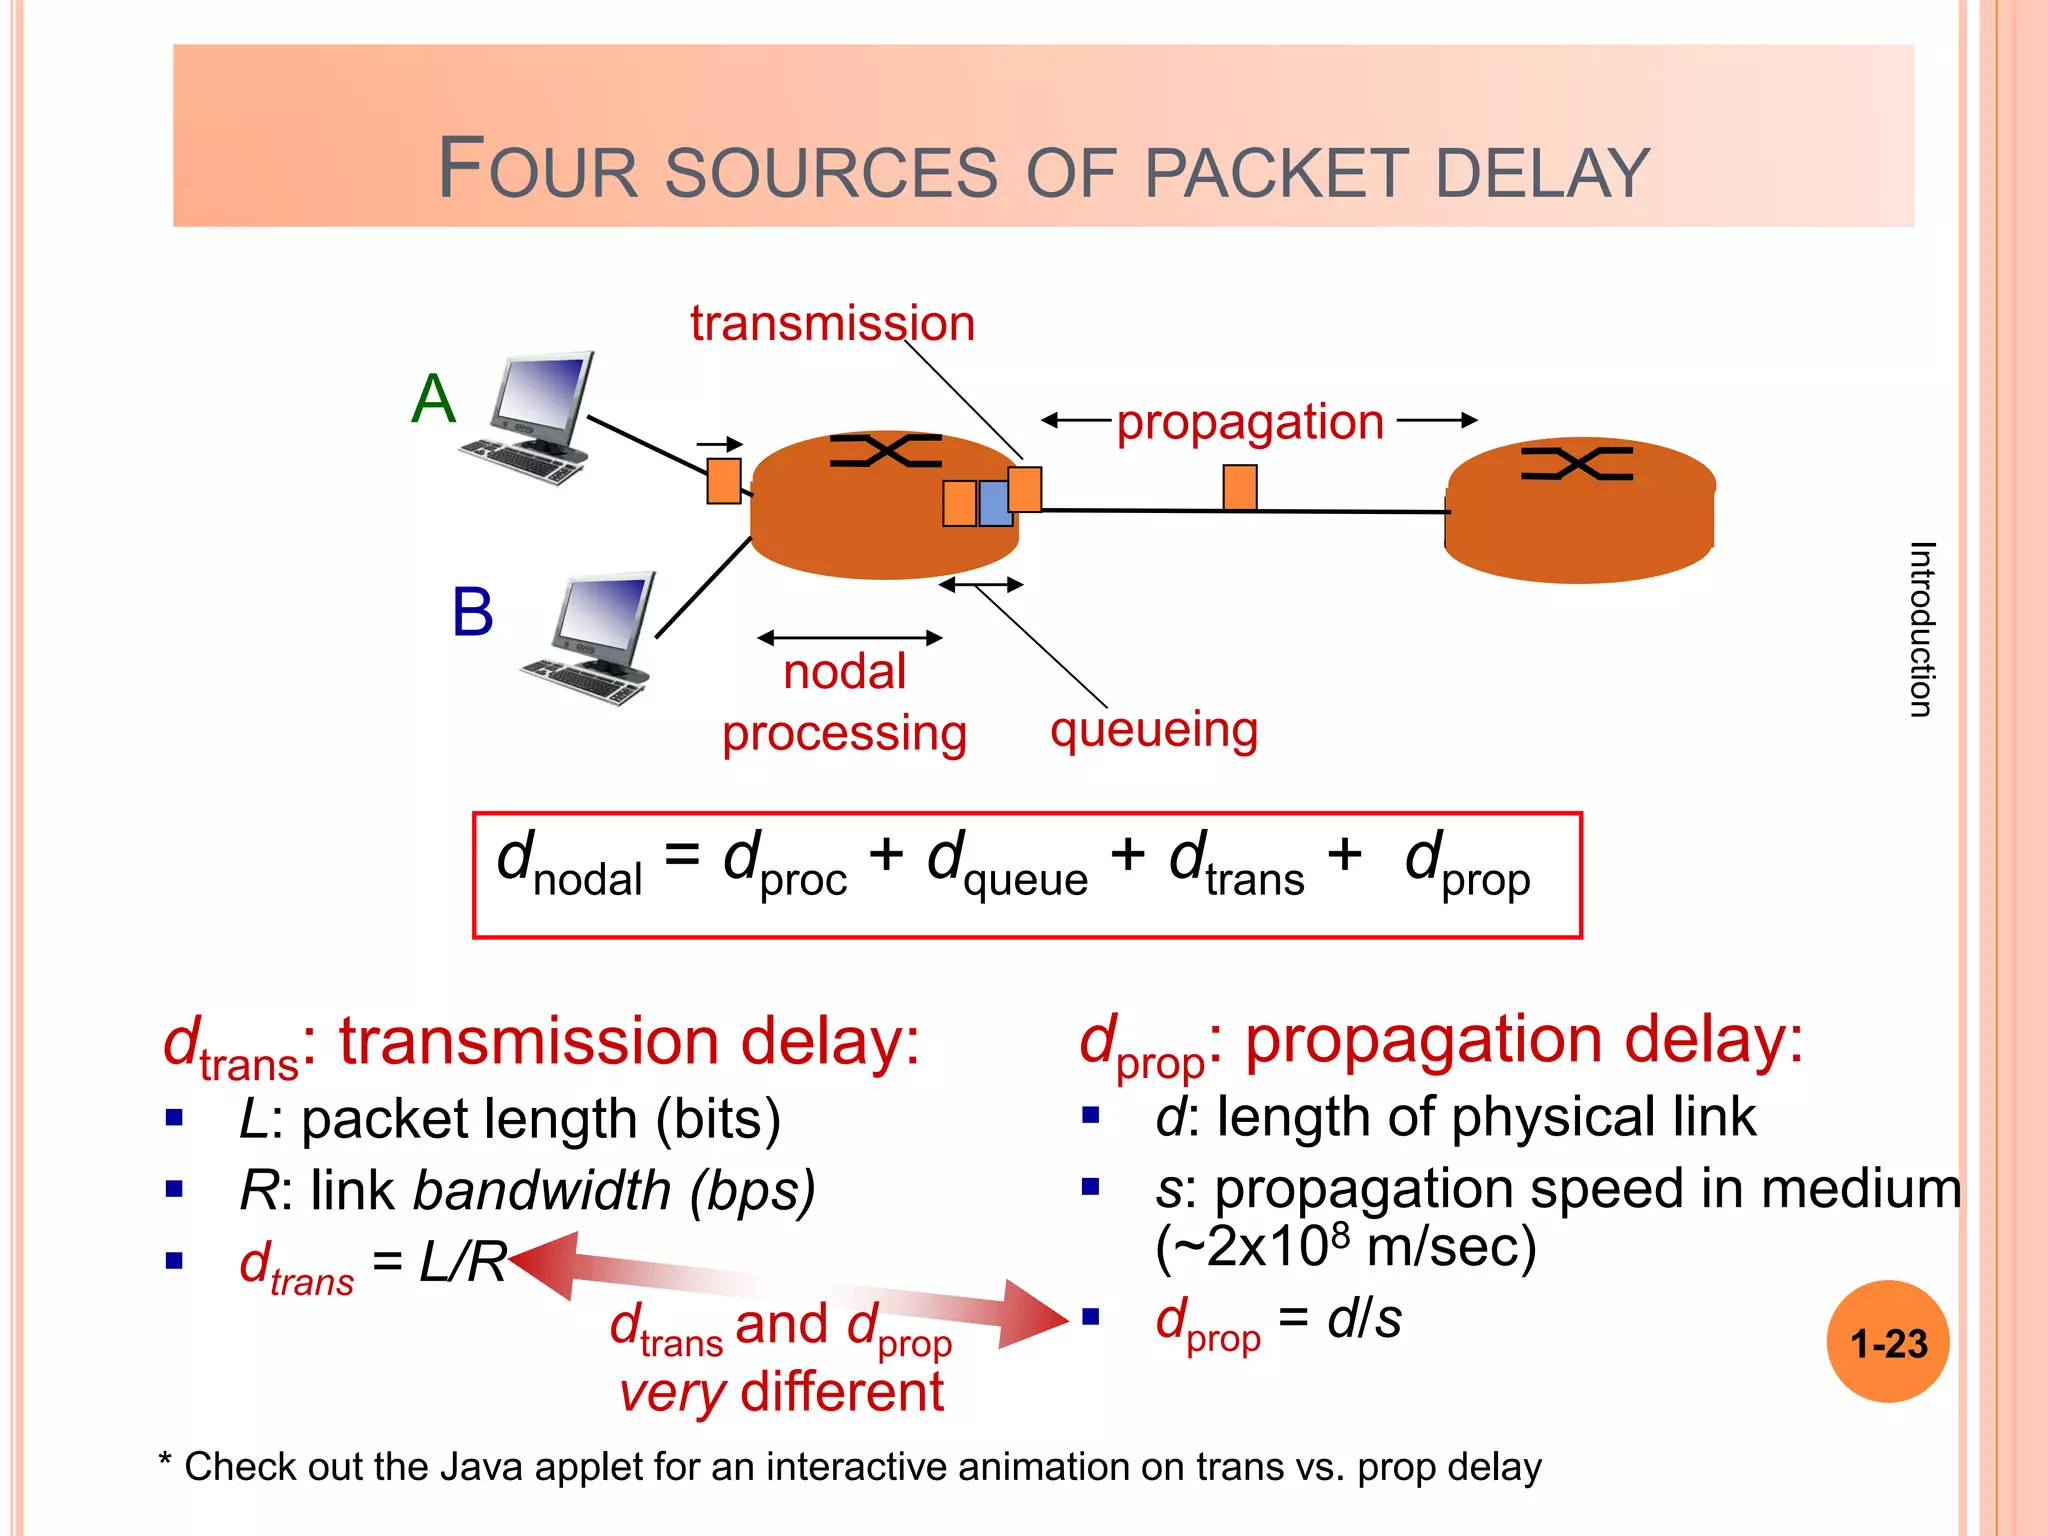
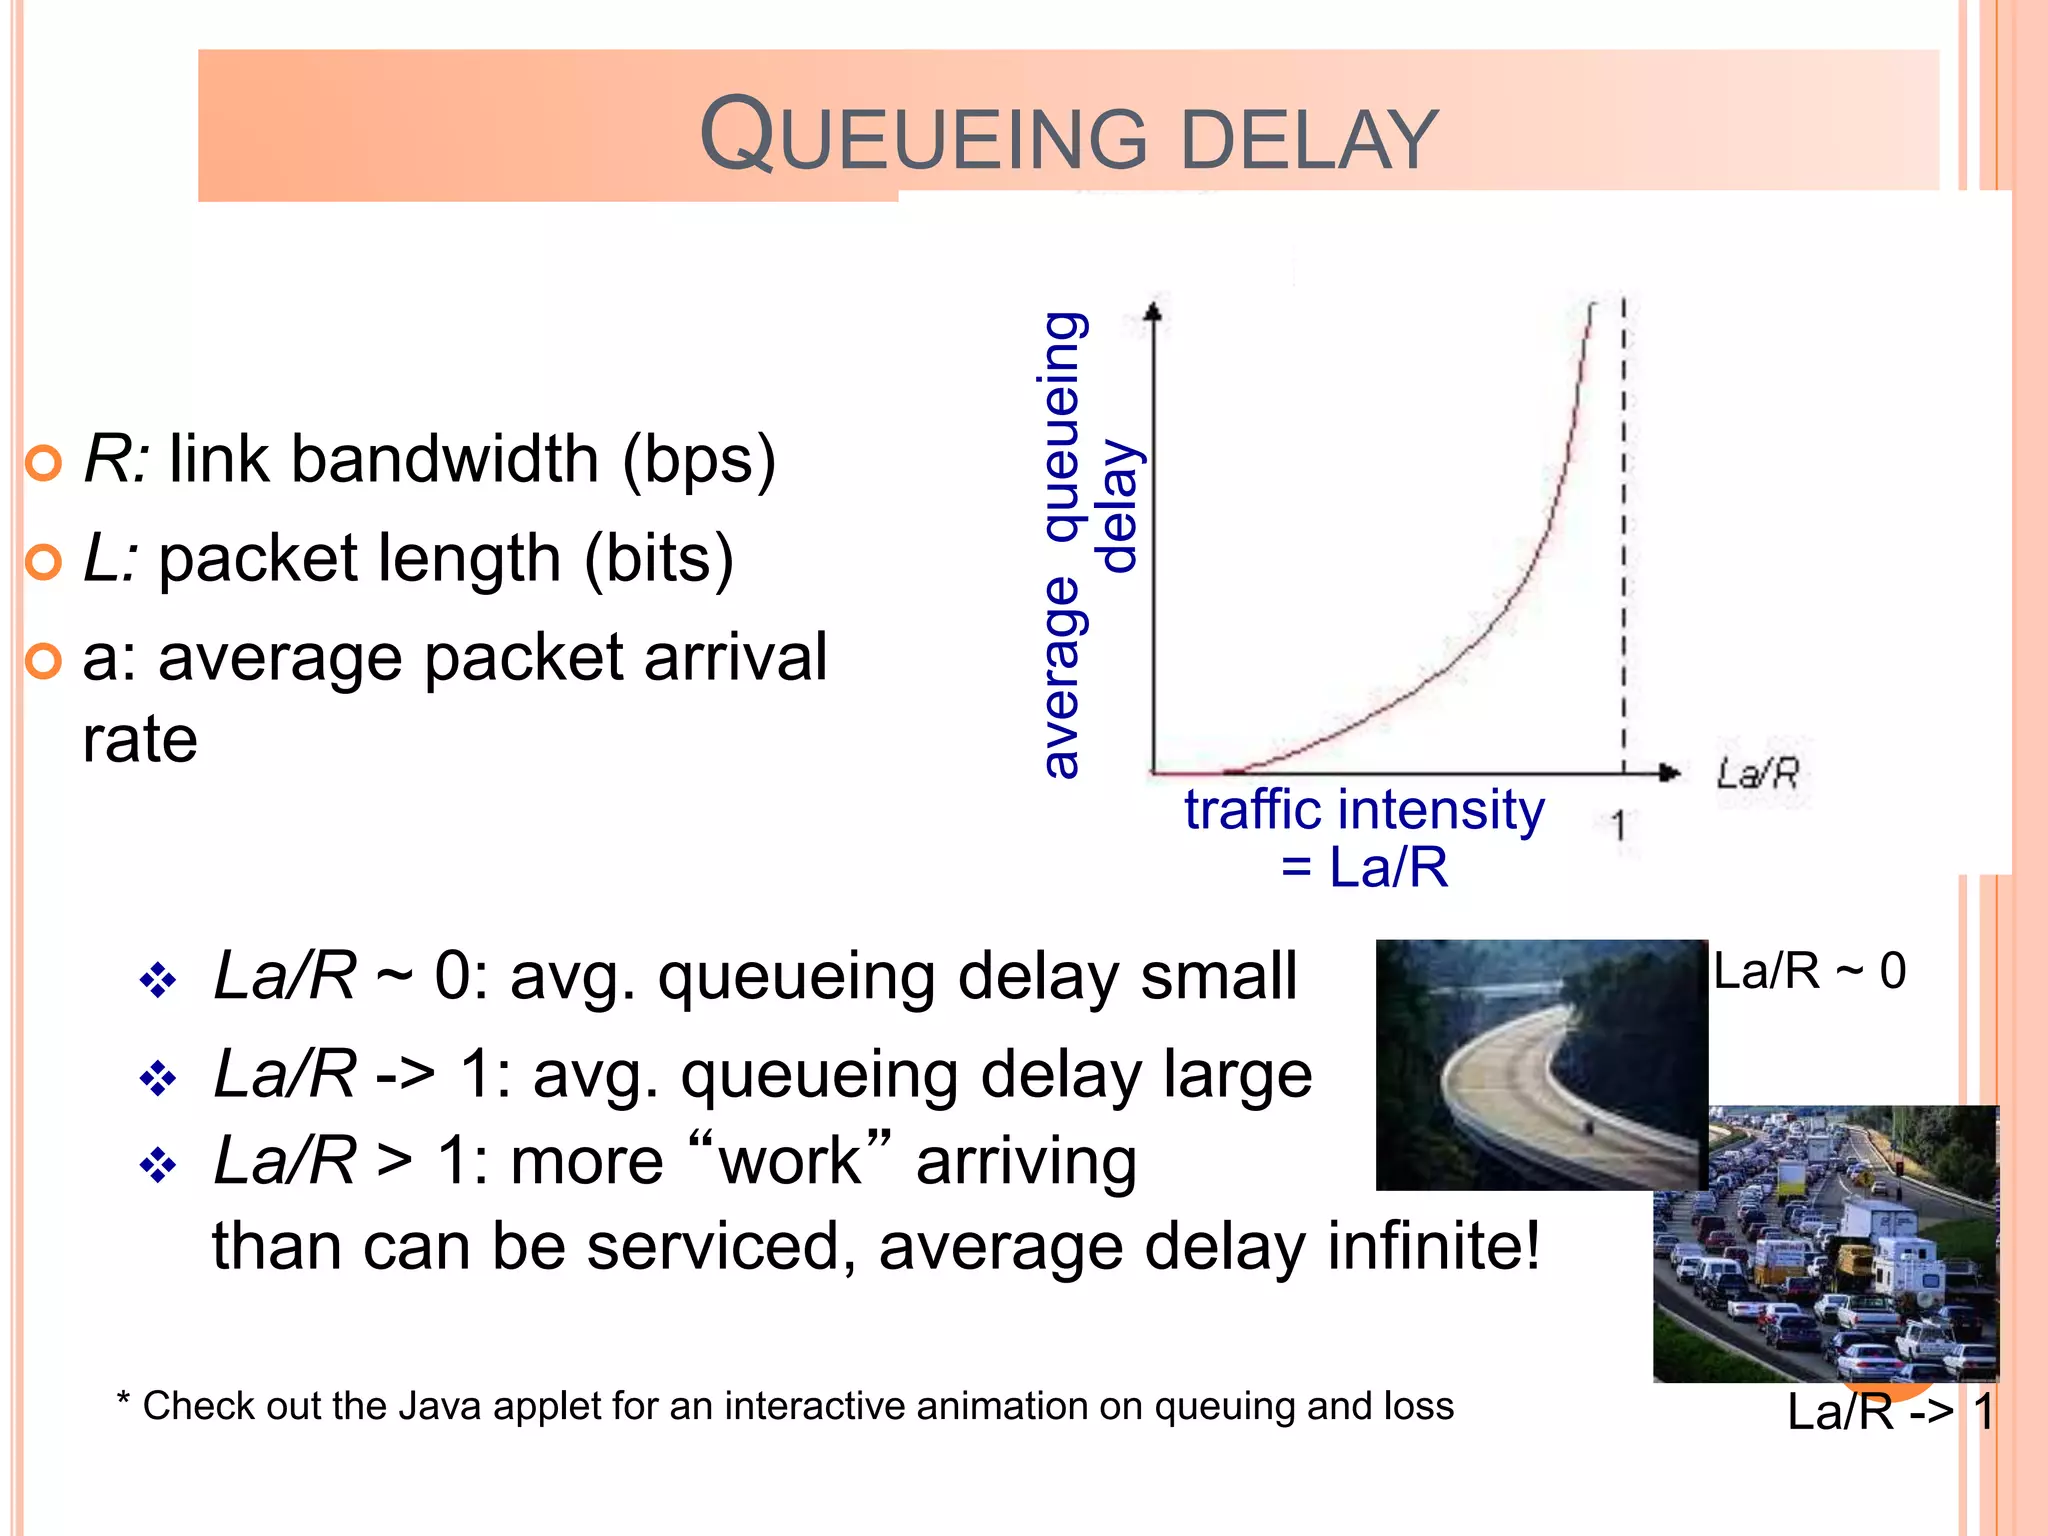
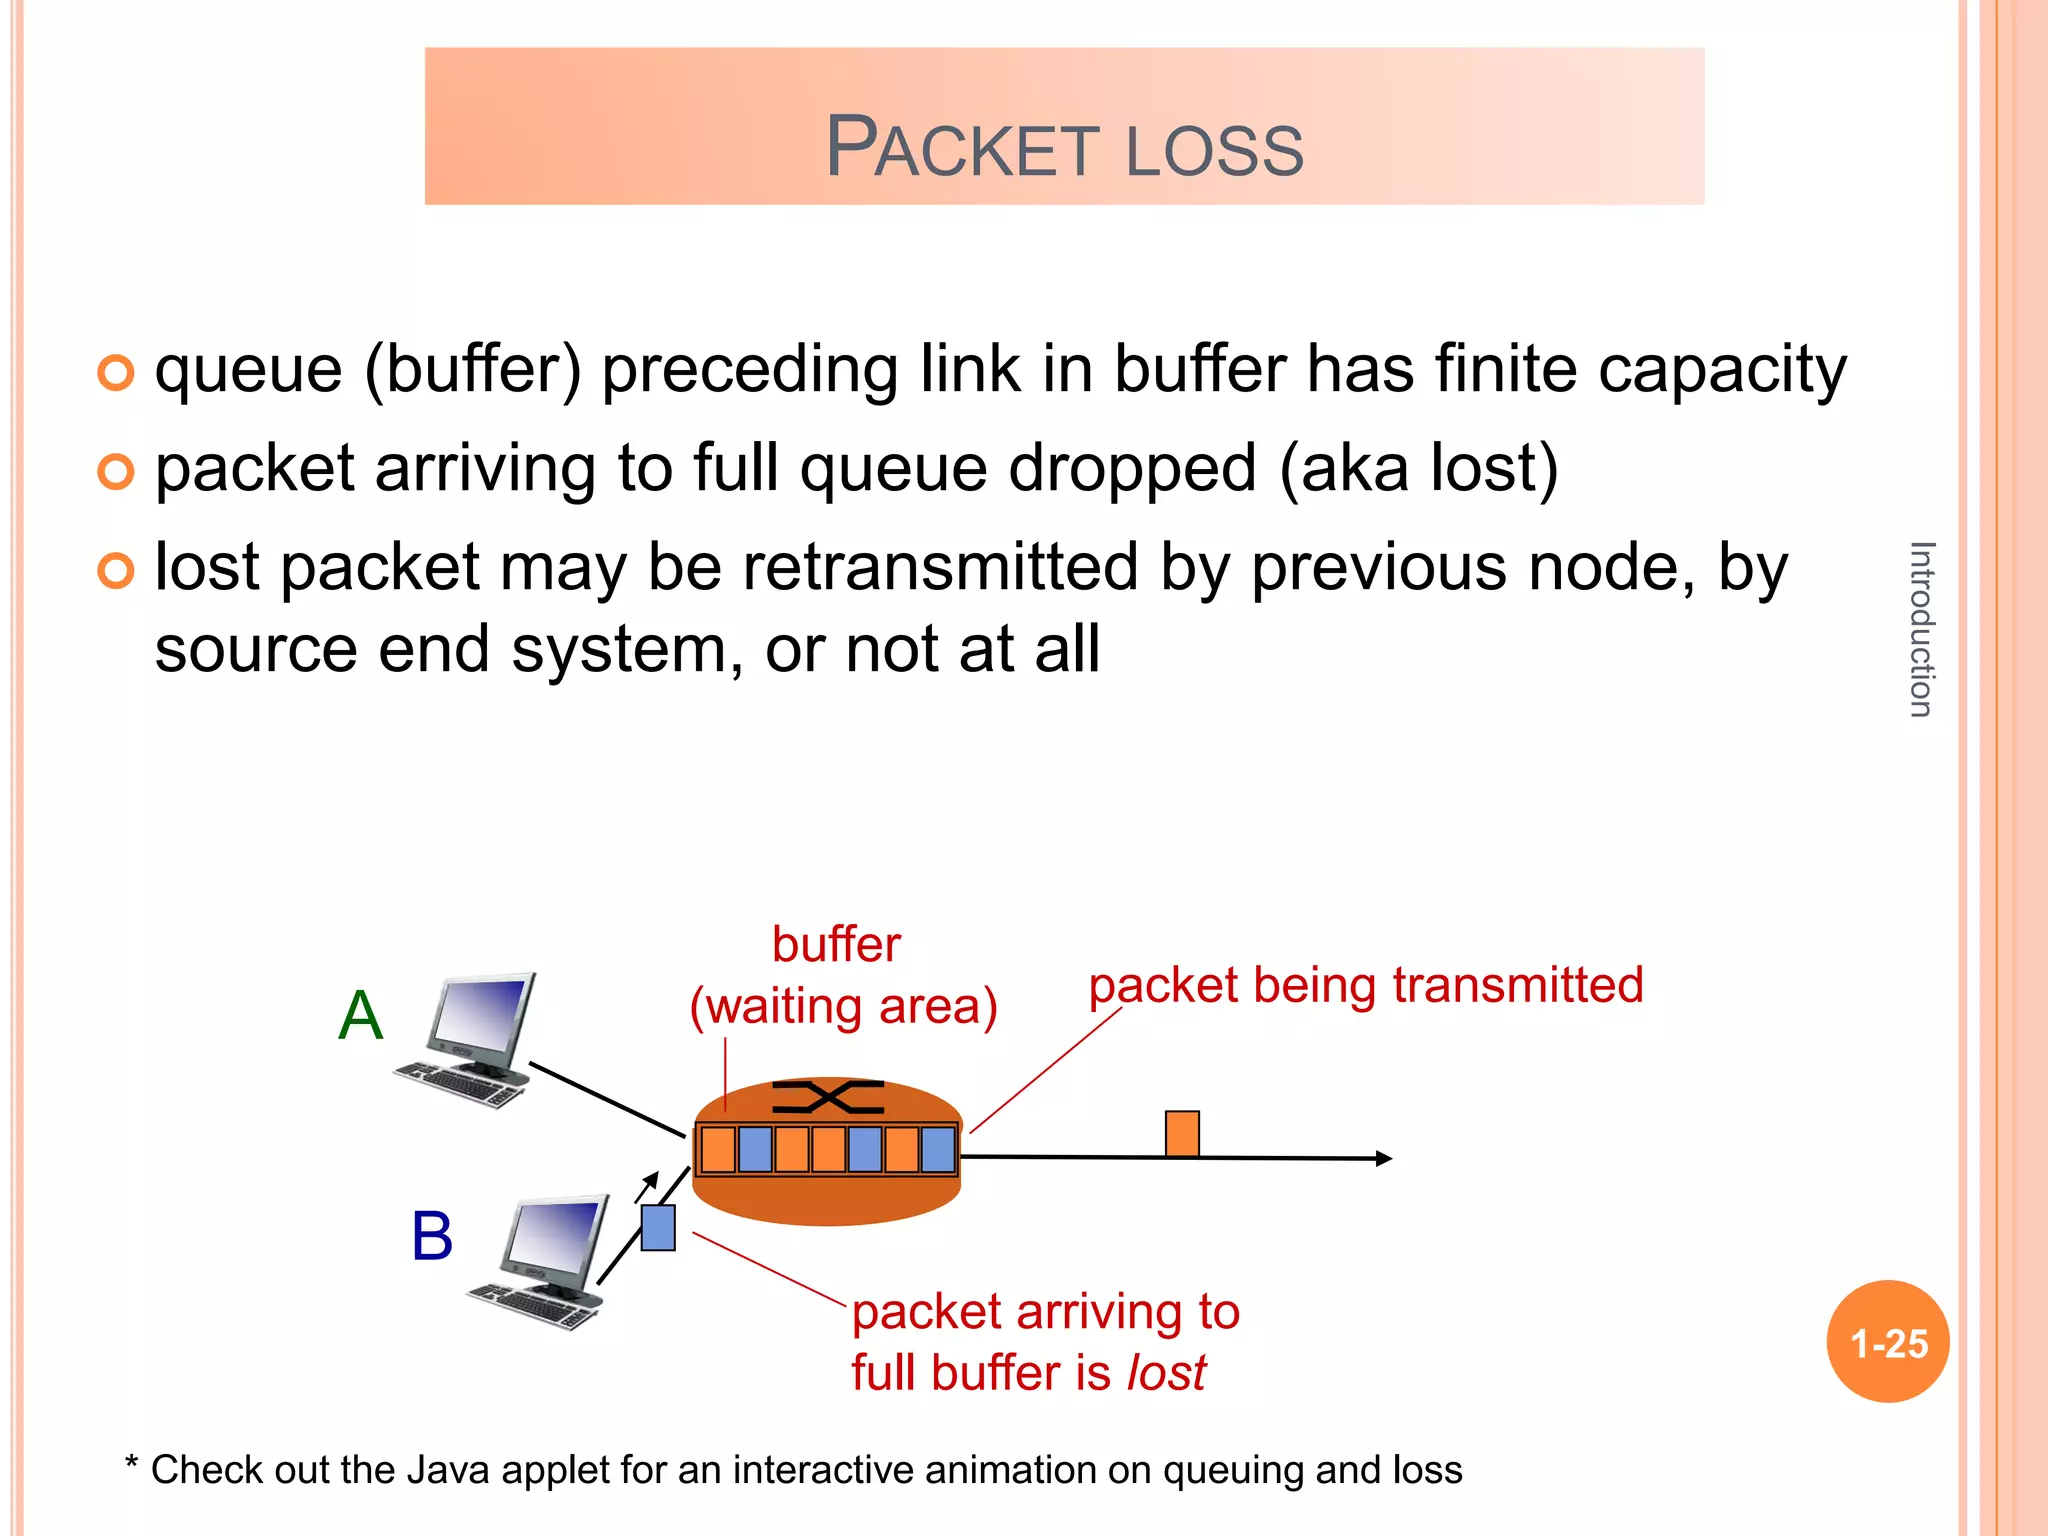
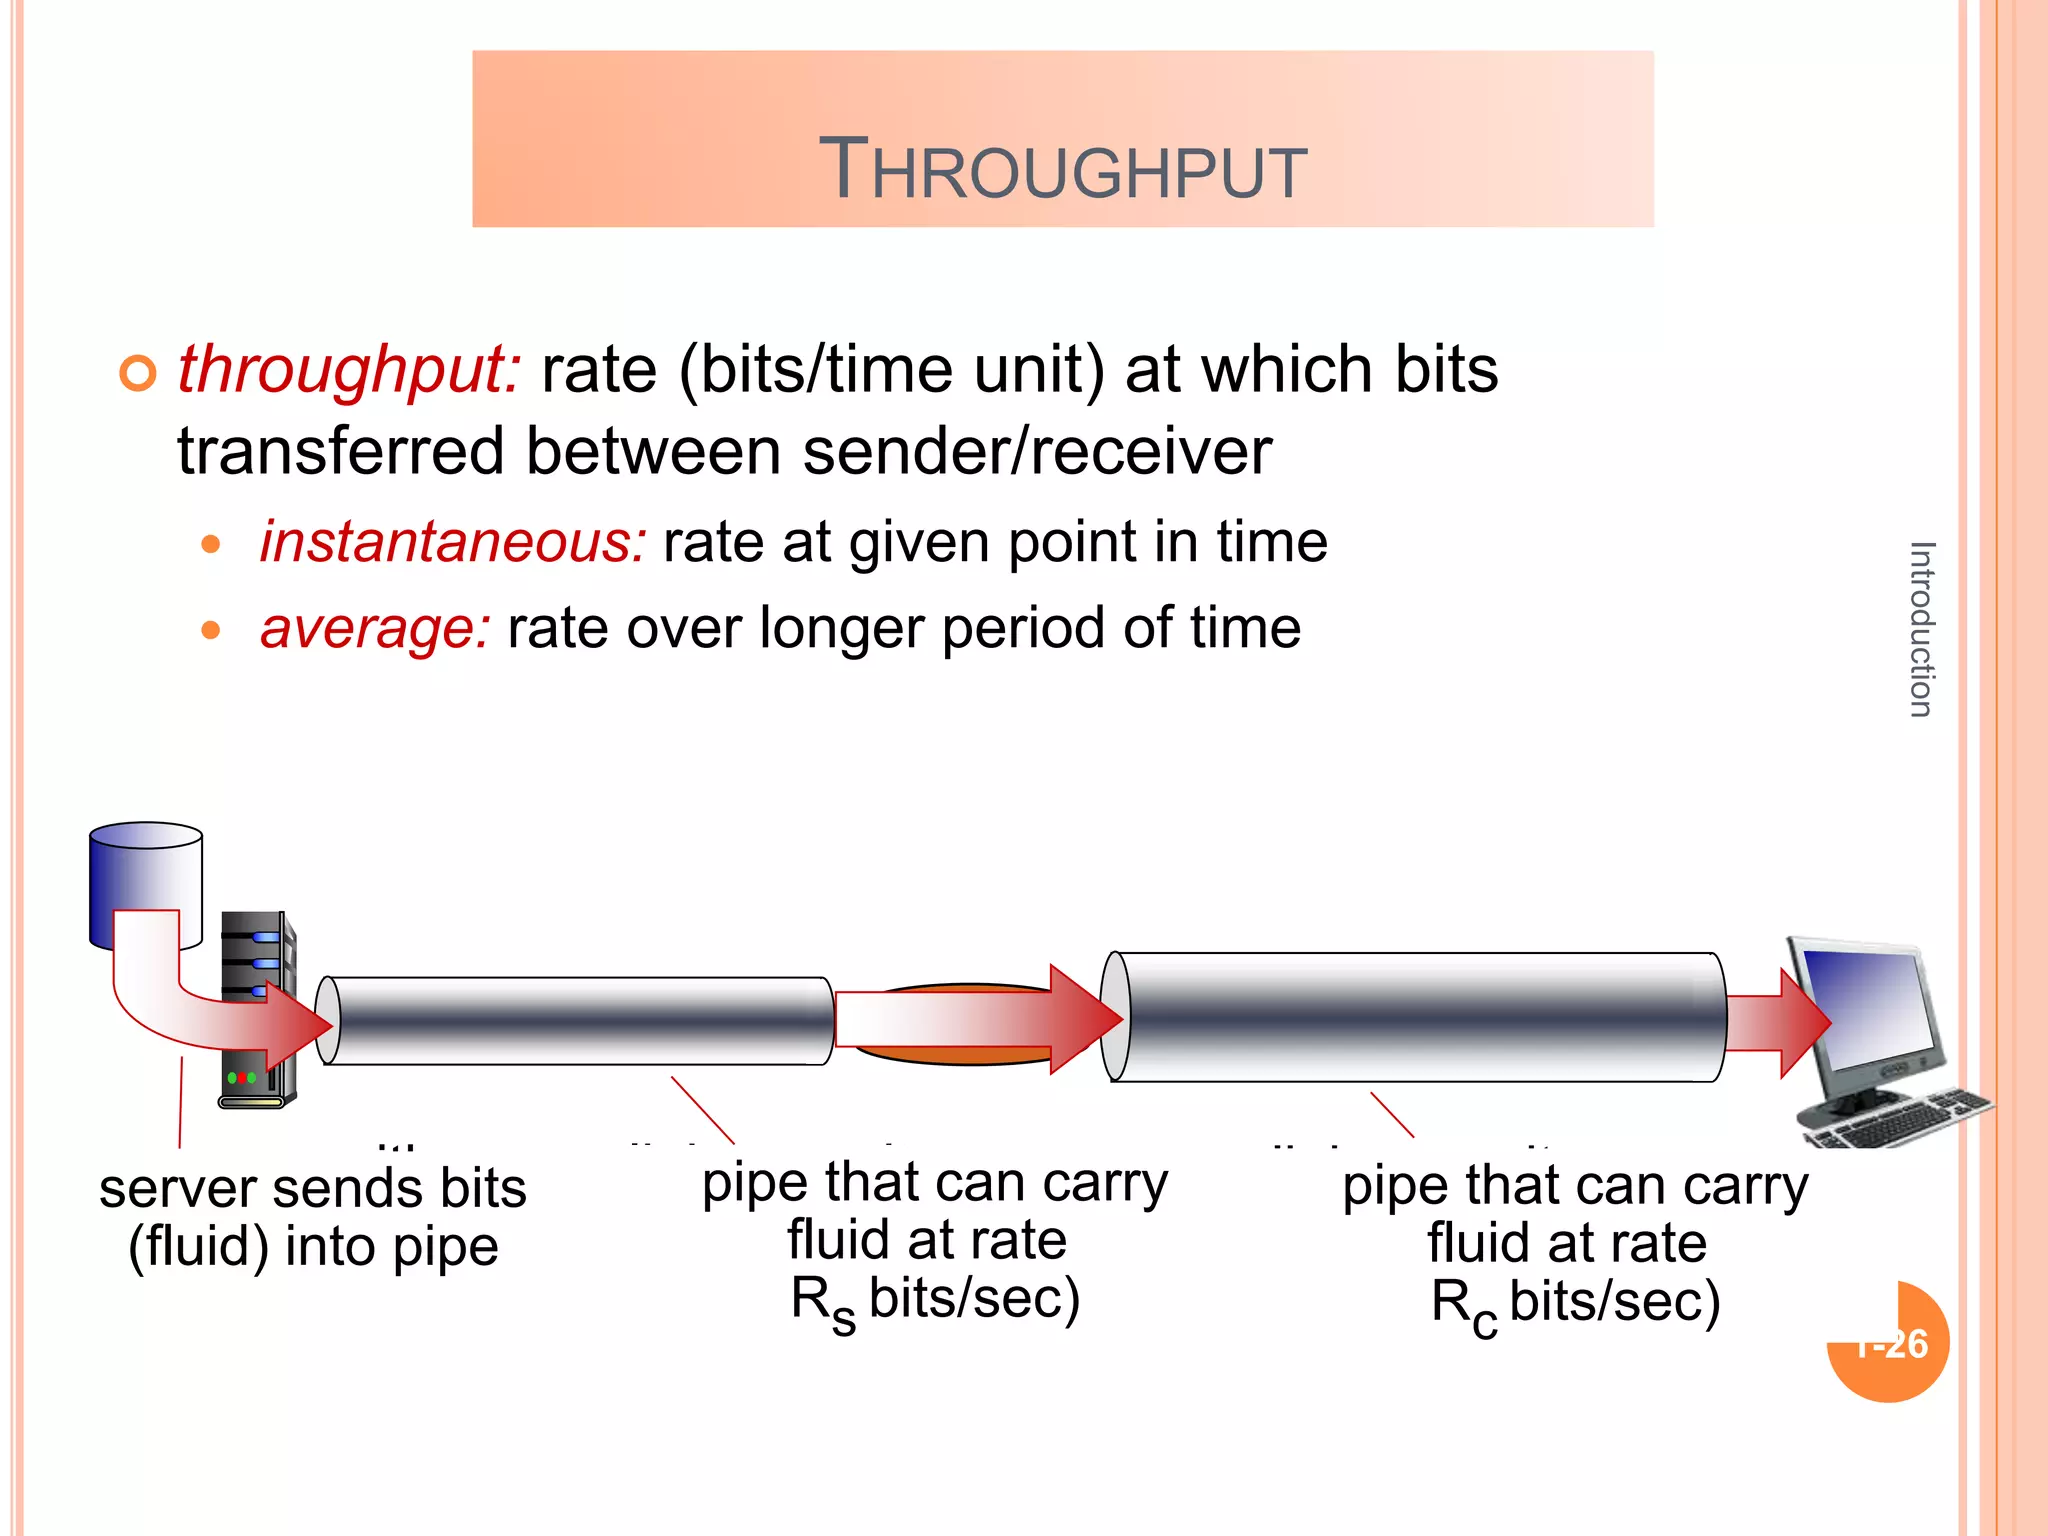
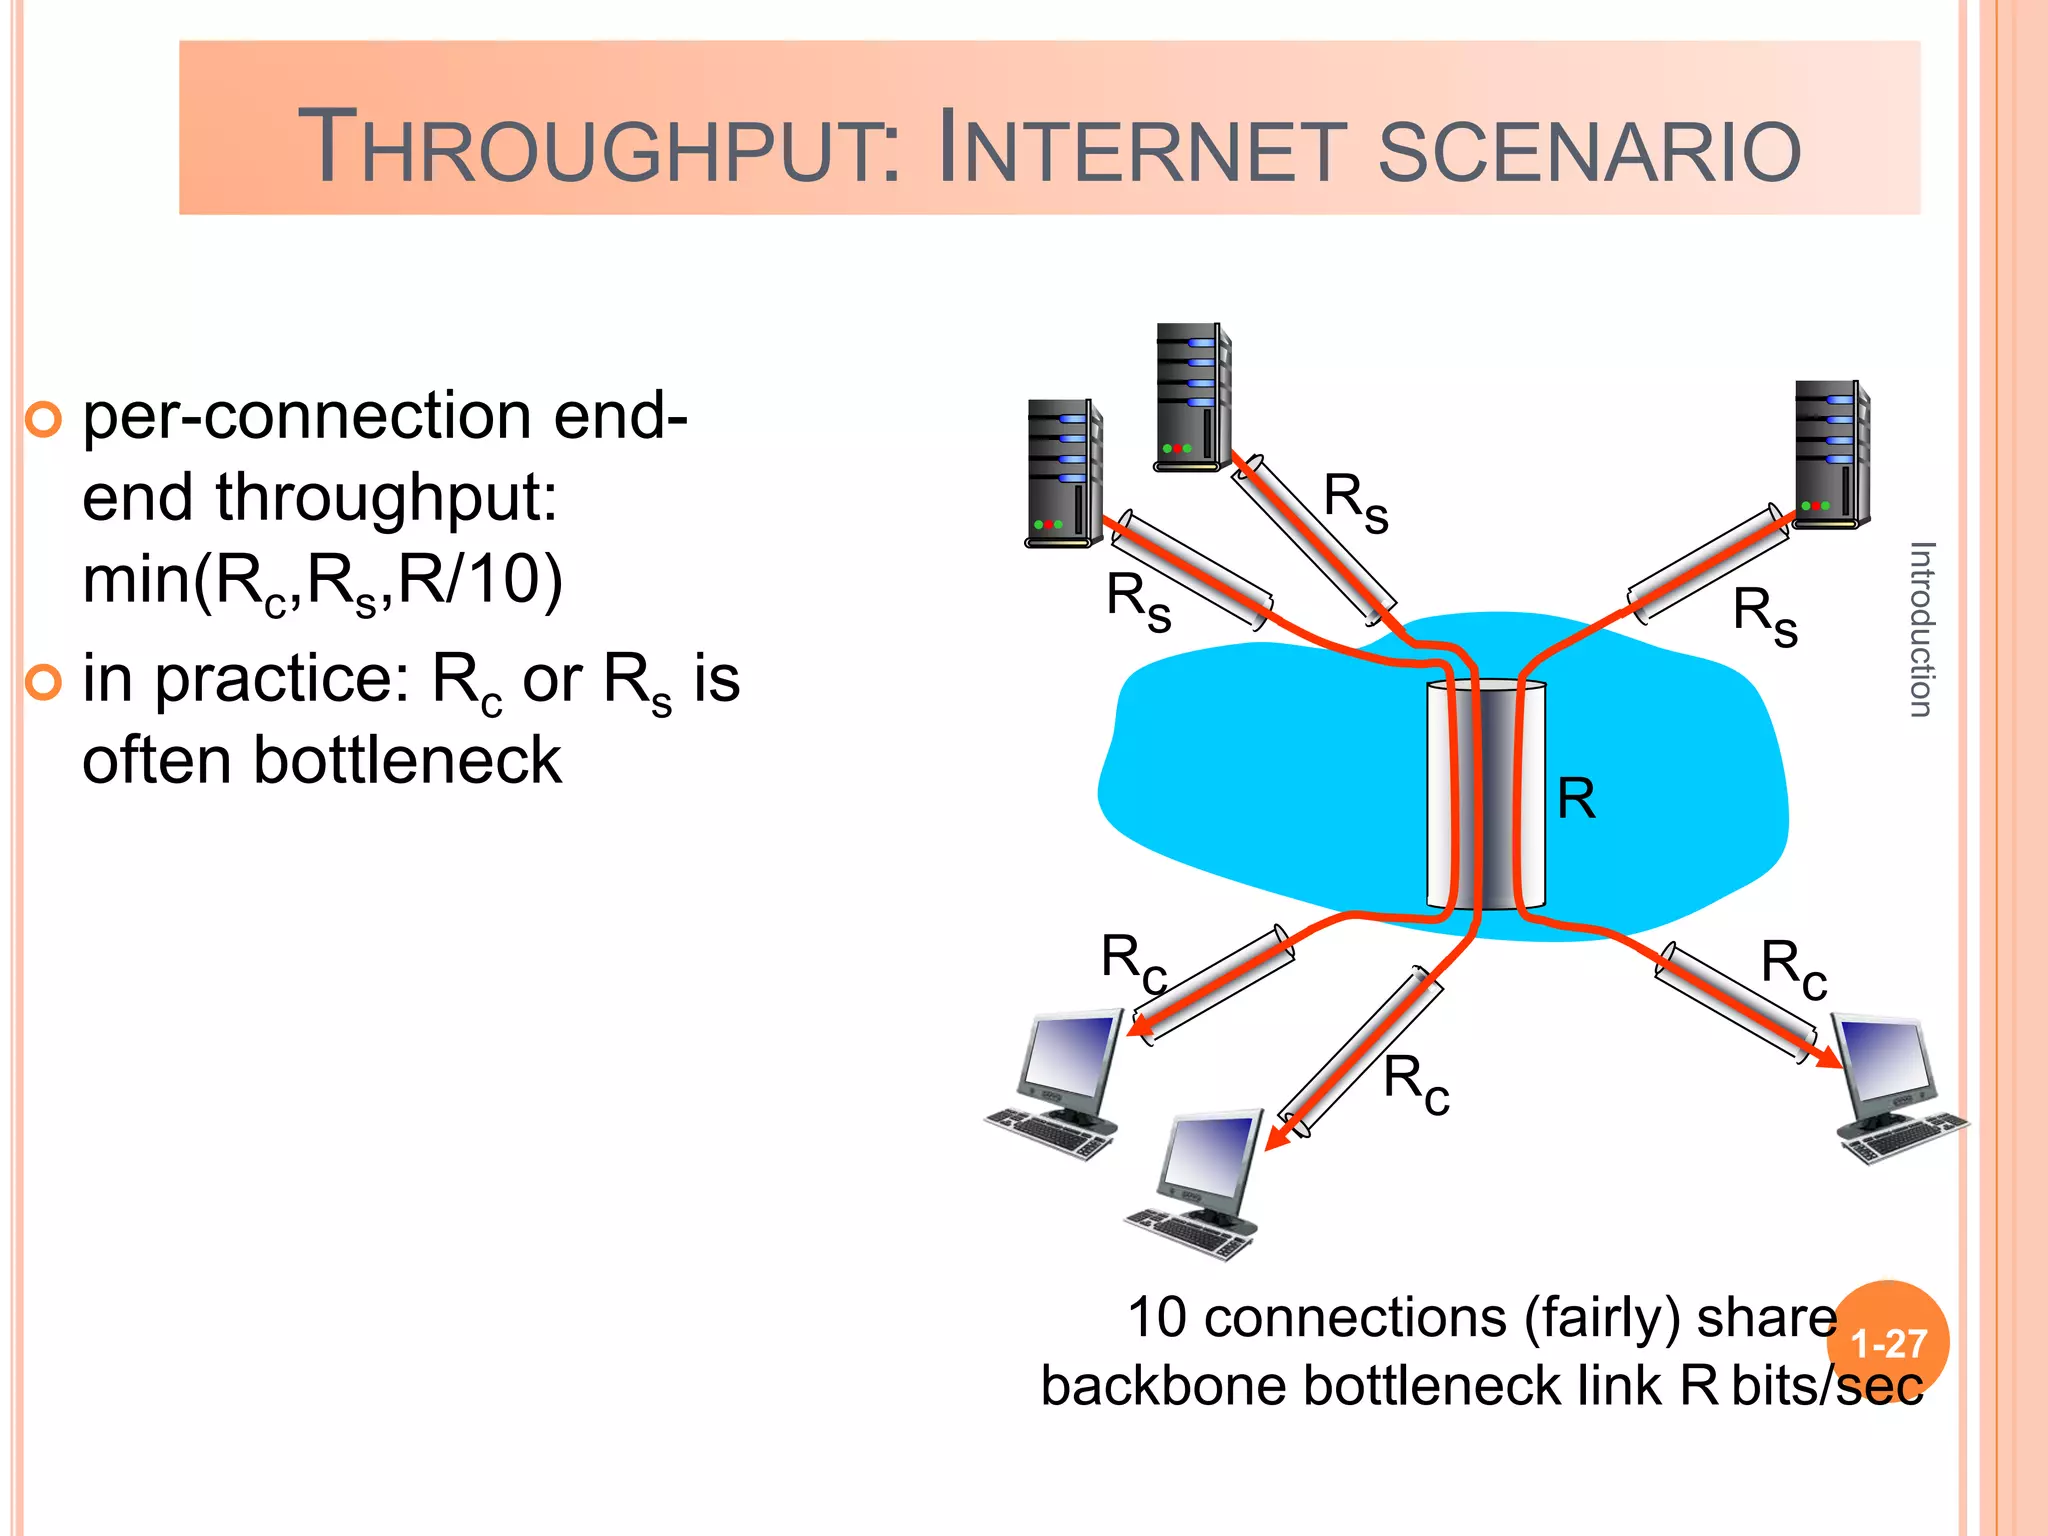
Chapter 1
Week 01
Introduction
Introduction
1-2
what’s the Internet?
Network edge:
 Access networks
Network core:
 Packet/Circuit switching,
 Internet structure
Network performance:
 Loss, Delay, Throughput
Overview
Introduction
1-3
INTERNET
Internet is a computer network that
interconnects hundreds of millions of
computing devices throughout the world.
Introduction
1-4
INTERNET APPLIANCES
IP picture frame
http://www.ceiva.com/
Web-enabled toaster +
weather forecaster
Internet phones
Internet
refrigerator
Slingbox: watch,
control cable TV remotely
Tweet-a-watt:
monitor energy use
Introduction
1-5
 millions of connected
computing devices:
 hosts = end systems
 running network apps
communication links
 fiber, copper,
radio, satellite
 transmission rate:
bandwidth
Packet switches:
forward packets (chunks
of data)
 routers and switches
wired
links
wireless
links
router
mobile network
global ISP
regional ISP
home
network
institutional
network
smartphone
PC
server
wireless
laptop
INTERNET : “nuts and bolts” view
Introduction
1-6
mobile network
global ISP
regional ISP
home
network
institutional
network
INTERNET : “nuts and bolts” view
 Internet: “network of networks”
 Interconnected ISPs
 protocols control sending,
receiving of msgs
 e.g., TCP, IP, HTTP, Skype,
802.11
 Internet standards
 RFC: Request for comments
 IETF: Internet Engineering Task
Force
Introduction
1-7
ACCESS NETWORKS
Q: How to connect end systems to
edge router?
 residential access nets
 institutional access networks
(school, company)
 mobile access networks
keep in mind:
 bandwidth (bits per second) of
access network?
 shared or dedicated?
Introduction
1-8
 shared wireless access network connects end system to router
 via base station aka “access point”
wireless LANs:
 within building (100 ft)
 802.11b/g (WiFi): 11, 54
Mbps transmission rate
wide-area wireless access
 provided by telco (cellular)
operator, 10’s km
 between 1 and 10 Mbps
 3G, 4G: LTE
to Internet
to Internet
Wireless access networks
Introduction
1-9
PACKET-SWITCHING: STORE-AND-FORWARD
 takes L/R seconds to
transmit (push out) L-bit
packet into link at R bps
 store and forward: entire
packet must arrive at
router before it can be
transmitted on next link
one-hop numerical
example:
 L = 7.5 Mbits
 R = 1.5 Mbps
 one-hop transmission
delay = 5 sec
source
R bps
destination
1
2
3
L bits
per packet
R bps
 End-end delay = N*L/R (assuming zero propagation delay)
Introduction
1-10
1-11
DELAY
host sending function:
 takes application message
 breaks into smaller
chunks, known as
packets, of length L bits
 transmits packet into
access network at
transmission rate R R: link transmission rate
host
1
2
two packets,
L bits each
Packet
transmission
delay
time needed to
transmit L-bit
packet into link
L (bits)
R (bits/sec)
= =
Introduction
1-12
PACKET SWITCHING: QUEUING DELAY, LOSS
A
B
C
R = 100 Mb/s
R = 1.5 Mb/s
D
E
queue of packets
waiting for output link
queuing and loss:
 If arrival rate (in bits) to link exceeds transmission rate
of link for a period of time:
 packets will queue, wait to be transmitted on link
 packets can be dropped (lost) if memory (buffer) fills
up
TRANSMISSION AND PROPAGATION DELAY
Propagation delay
between Host 1
and Switch1
Transmission delay
Host 1 Switc
h 1
1. Size of transfer
2. Bandwidth of link
1. Speed of light
2. Physical
distance
A B C
Transmission delay doubles
Brown packet waits for half the
trans. delay of blue packet
QUEUING DELAY
Network Layer 4-15
Two key network-core functions
forwarding: move packets
from router’s input to
appropriate router output
routing: determines source-
destination route taken by
packets
 routing algorithms
routing algorithm
local forwarding table
header value output link
0100
0101
0111
1001
3
2
2
1
1
2
3
dest address in arriving
packet’s header
Introduction
1-16
CIRCUIT SWITCHING
end-end resources allocated to,
reserved for “call” between
source & dest:
 In diagram, each link has four
circuits.
 call gets 2nd circuit in top link and
1st circuit in right link.
 dedicated resources: no sharing
 circuit-like (guaranteed)
performance
 circuit segment idle if not used
by call (no sharing)
 Commonly used in traditional
telephone networks
Introduction
1-17
Introduction
1-18
CIRCUIT SWITCHING: FDM VERSUS TDM
FDM
frequency
time
TDM
frequency
time
4 users
Example:
Introduction
1-19
PACKET SWITCHING VERSUS CIRCUIT SWITCHING
example:
 1 Mb/s link
 each user:
• 100 kb/s when “active”
• active 10% of time
circuit-switching:
 10 users
packet switching:
 with 35 users, probability >
10 active at same time is
less than .0004 *
packet switching allows more users to use network!
N
users
1 Mbps link
Q: how did we get value 0.0004?
Q: what happens if > 35 users ?
* Check out the online interactive exercises for more examples
Introduction
1-20
 great for bursty data
 resource sharing
 simpler, no call setup
 excessive congestion possible: packet delay and loss
 protocols needed for reliable data transfer, congestion control
 Q: How to provide circuit-like behavior?
 bandwidth guarantees needed for audio/video apps
Packet switching
PACKET SWITCHING VERSUS CIRCUIT SWITCHING
Introduction
1-21
HOW DO LOSS AND DELAY OCCUR?
packets queue in router buffers
 packet arrival rate to link (temporarily) exceeds output link
capacity
 packets queue, wait for turn
A
B
packet being transmitted (delay)
packets queueing (delay)
free (available) buffers: arriving packets
dropped (loss) if no free buffers
Introduction
1-22
FOUR SOURCES OF PACKET DELAY
dproc: nodal processing
 check bit errors
 determine output link
 typically < msec
A
B
propagation
transmission
nodal
processing queueing
dqueue: queueing delay
 time waiting at output
link for transmission
 depends on congestion
level of router
dnodal = dproc + dqueue + dtrans + dprop
Introduction
1-23
dtrans: transmission delay:
 L: packet length (bits)
 R: link bandwidth (bps)
 dtrans = L/R
dprop: propagation delay:
 d: length of physical link
 s: propagation speed in medium
(~2x10⁸ m/sec)
 dprop = d/s
dtrans and dprop
very different
propagation
nodal
processing queueing
dnodal = dproc + dqueue + dtrans + dprop
A
B
transmission
* Check out the Java applet for an interactive animation on trans vs. prop delay
FOUR SOURCES OF PACKET DELAY
Introduction
1-24
 R: link bandwidth (bps)
 L: packet length (bits)
 a: average packet arrival
rate
QUEUEING DELAY
traffic intensity
= La/R
 La/R ~ 0: avg. queueing delay small
 La/R -> 1: avg. queueing delay large
 La/R > 1: more “work” arriving
than can be serviced, average delay infinite!
average
queueing
delay
La/R ~ 0
La/R -> 1
* Check out the Java applet for an interactive animation on queuing and loss
Introduction
1-25
PACKET LOSS
 queue (buffer) preceding link in buffer has finite capacity
 packet arriving to full queue dropped (aka lost)
 lost packet may be retransmitted by previous node, by
source end system, or not at all
A
B
packet being transmitted
packet arriving to
full buffer is lost
buffer
(waiting area)
* Check out the Java applet for an interactive animation on queuing and loss
Introduction
1-26
THROUGHPUT
 throughput: rate (bits/time unit) at which bits
transferred between sender/receiver
 instantaneous: rate at given point in time
 average: rate over longer period of time
server, with
file of F bits
to send to client
link capacity
Rs bits/sec
link capacity
Rc bits/sec
server sends bits
(fluid) into pipe
pipe that can carry
fluid at rate
Rs bits/sec)
pipe that can carry
fluid at rate
Rc bits/sec)
Introduction
1-27
THROUGHPUT: INTERNET SCENARIO
 per-connection end-
end throughput:
min(Rc,Rs,R/10)
 in practice: Rc or Rs is
often bottleneck
10 connections (fairly) share
backbone bottleneck link R bits/sec
Rs
Rs
Rs
Rc
Rc
Rc
R
Introduction
1-28

Lec - 1_Chapter_1.ppt

  • 1.
  • 2.
    Introduction 1-2 what’s the Internet? Networkedge:  Access networks Network core:  Packet/Circuit switching,  Internet structure Network performance:  Loss, Delay, Throughput Overview
  • 3.
    Introduction 1-3 INTERNET Internet is acomputer network that interconnects hundreds of millions of computing devices throughout the world.
  • 4.
    Introduction 1-4 INTERNET APPLIANCES IP pictureframe http://www.ceiva.com/ Web-enabled toaster + weather forecaster Internet phones Internet refrigerator Slingbox: watch, control cable TV remotely Tweet-a-watt: monitor energy use
  • 5.
    Introduction 1-5  millions ofconnected computing devices:  hosts = end systems  running network apps communication links  fiber, copper, radio, satellite  transmission rate: bandwidth Packet switches: forward packets (chunks of data)  routers and switches wired links wireless links router mobile network global ISP regional ISP home network institutional network smartphone PC server wireless laptop INTERNET : “nuts and bolts” view
  • 6.
    Introduction 1-6 mobile network global ISP regionalISP home network institutional network INTERNET : “nuts and bolts” view  Internet: “network of networks”  Interconnected ISPs  protocols control sending, receiving of msgs  e.g., TCP, IP, HTTP, Skype, 802.11  Internet standards  RFC: Request for comments  IETF: Internet Engineering Task Force
  • 7.
    Introduction 1-7 ACCESS NETWORKS Q: Howto connect end systems to edge router?  residential access nets  institutional access networks (school, company)  mobile access networks keep in mind:  bandwidth (bits per second) of access network?  shared or dedicated?
  • 8.
    Introduction 1-8  shared wirelessaccess network connects end system to router  via base station aka “access point” wireless LANs:  within building (100 ft)  802.11b/g (WiFi): 11, 54 Mbps transmission rate wide-area wireless access  provided by telco (cellular) operator, 10’s km  between 1 and 10 Mbps  3G, 4G: LTE to Internet to Internet Wireless access networks
  • 9.
    Introduction 1-9 PACKET-SWITCHING: STORE-AND-FORWARD  takesL/R seconds to transmit (push out) L-bit packet into link at R bps  store and forward: entire packet must arrive at router before it can be transmitted on next link one-hop numerical example:  L = 7.5 Mbits  R = 1.5 Mbps  one-hop transmission delay = 5 sec source R bps destination 1 2 3 L bits per packet R bps  End-end delay = N*L/R (assuming zero propagation delay)
  • 10.
  • 11.
    1-11 DELAY host sending function: takes application message  breaks into smaller chunks, known as packets, of length L bits  transmits packet into access network at transmission rate R R: link transmission rate host 1 2 two packets, L bits each Packet transmission delay time needed to transmit L-bit packet into link L (bits) R (bits/sec) = =
  • 12.
    Introduction 1-12 PACKET SWITCHING: QUEUINGDELAY, LOSS A B C R = 100 Mb/s R = 1.5 Mb/s D E queue of packets waiting for output link queuing and loss:  If arrival rate (in bits) to link exceeds transmission rate of link for a period of time:  packets will queue, wait to be transmitted on link  packets can be dropped (lost) if memory (buffer) fills up
  • 13.
    TRANSMISSION AND PROPAGATIONDELAY Propagation delay between Host 1 and Switch1 Transmission delay Host 1 Switc h 1 1. Size of transfer 2. Bandwidth of link 1. Speed of light 2. Physical distance
  • 14.
    A B C Transmissiondelay doubles Brown packet waits for half the trans. delay of blue packet QUEUING DELAY
  • 15.
    Network Layer 4-15 Twokey network-core functions forwarding: move packets from router’s input to appropriate router output routing: determines source- destination route taken by packets  routing algorithms routing algorithm local forwarding table header value output link 0100 0101 0111 1001 3 2 2 1 1 2 3 dest address in arriving packet’s header
  • 16.
    Introduction 1-16 CIRCUIT SWITCHING end-end resourcesallocated to, reserved for “call” between source & dest:  In diagram, each link has four circuits.  call gets 2nd circuit in top link and 1st circuit in right link.  dedicated resources: no sharing  circuit-like (guaranteed) performance  circuit segment idle if not used by call (no sharing)  Commonly used in traditional telephone networks
  • 17.
  • 18.
    Introduction 1-18 CIRCUIT SWITCHING: FDMVERSUS TDM FDM frequency time TDM frequency time 4 users Example:
  • 19.
    Introduction 1-19 PACKET SWITCHING VERSUSCIRCUIT SWITCHING example:  1 Mb/s link  each user: • 100 kb/s when “active” • active 10% of time circuit-switching:  10 users packet switching:  with 35 users, probability > 10 active at same time is less than .0004 * packet switching allows more users to use network! N users 1 Mbps link Q: how did we get value 0.0004? Q: what happens if > 35 users ? * Check out the online interactive exercises for more examples
  • 20.
    Introduction 1-20  great forbursty data  resource sharing  simpler, no call setup  excessive congestion possible: packet delay and loss  protocols needed for reliable data transfer, congestion control  Q: How to provide circuit-like behavior?  bandwidth guarantees needed for audio/video apps Packet switching PACKET SWITCHING VERSUS CIRCUIT SWITCHING
  • 21.
    Introduction 1-21 HOW DO LOSSAND DELAY OCCUR? packets queue in router buffers  packet arrival rate to link (temporarily) exceeds output link capacity  packets queue, wait for turn A B packet being transmitted (delay) packets queueing (delay) free (available) buffers: arriving packets dropped (loss) if no free buffers
  • 22.
    Introduction 1-22 FOUR SOURCES OFPACKET DELAY dproc: nodal processing  check bit errors  determine output link  typically < msec A B propagation transmission nodal processing queueing dqueue: queueing delay  time waiting at output link for transmission  depends on congestion level of router dnodal = dproc + dqueue + dtrans + dprop
  • 23.
    Introduction 1-23 dtrans: transmission delay: L: packet length (bits)  R: link bandwidth (bps)  dtrans = L/R dprop: propagation delay:  d: length of physical link  s: propagation speed in medium (~2x10⁸ m/sec)  dprop = d/s dtrans and dprop very different propagation nodal processing queueing dnodal = dproc + dqueue + dtrans + dprop A B transmission * Check out the Java applet for an interactive animation on trans vs. prop delay FOUR SOURCES OF PACKET DELAY
  • 24.
    Introduction 1-24  R: linkbandwidth (bps)  L: packet length (bits)  a: average packet arrival rate QUEUEING DELAY traffic intensity = La/R  La/R ~ 0: avg. queueing delay small  La/R -> 1: avg. queueing delay large  La/R > 1: more “work” arriving than can be serviced, average delay infinite! average queueing delay La/R ~ 0 La/R -> 1 * Check out the Java applet for an interactive animation on queuing and loss
  • 25.
    Introduction 1-25 PACKET LOSS  queue(buffer) preceding link in buffer has finite capacity  packet arriving to full queue dropped (aka lost)  lost packet may be retransmitted by previous node, by source end system, or not at all A B packet being transmitted packet arriving to full buffer is lost buffer (waiting area) * Check out the Java applet for an interactive animation on queuing and loss
  • 26.
    Introduction 1-26 THROUGHPUT  throughput: rate(bits/time unit) at which bits transferred between sender/receiver  instantaneous: rate at given point in time  average: rate over longer period of time server, with file of F bits to send to client link capacity Rs bits/sec link capacity Rc bits/sec server sends bits (fluid) into pipe pipe that can carry fluid at rate Rs bits/sec) pipe that can carry fluid at rate Rc bits/sec)
  • 27.
    Introduction 1-27 THROUGHPUT: INTERNET SCENARIO per-connection end- end throughput: min(Rc,Rs,R/10)  in practice: Rc or Rs is often bottleneck 10 connections (fairly) share backbone bottleneck link R bits/sec Rs Rs Rs Rc Rc Rc R
  • 28.