Download to read offline

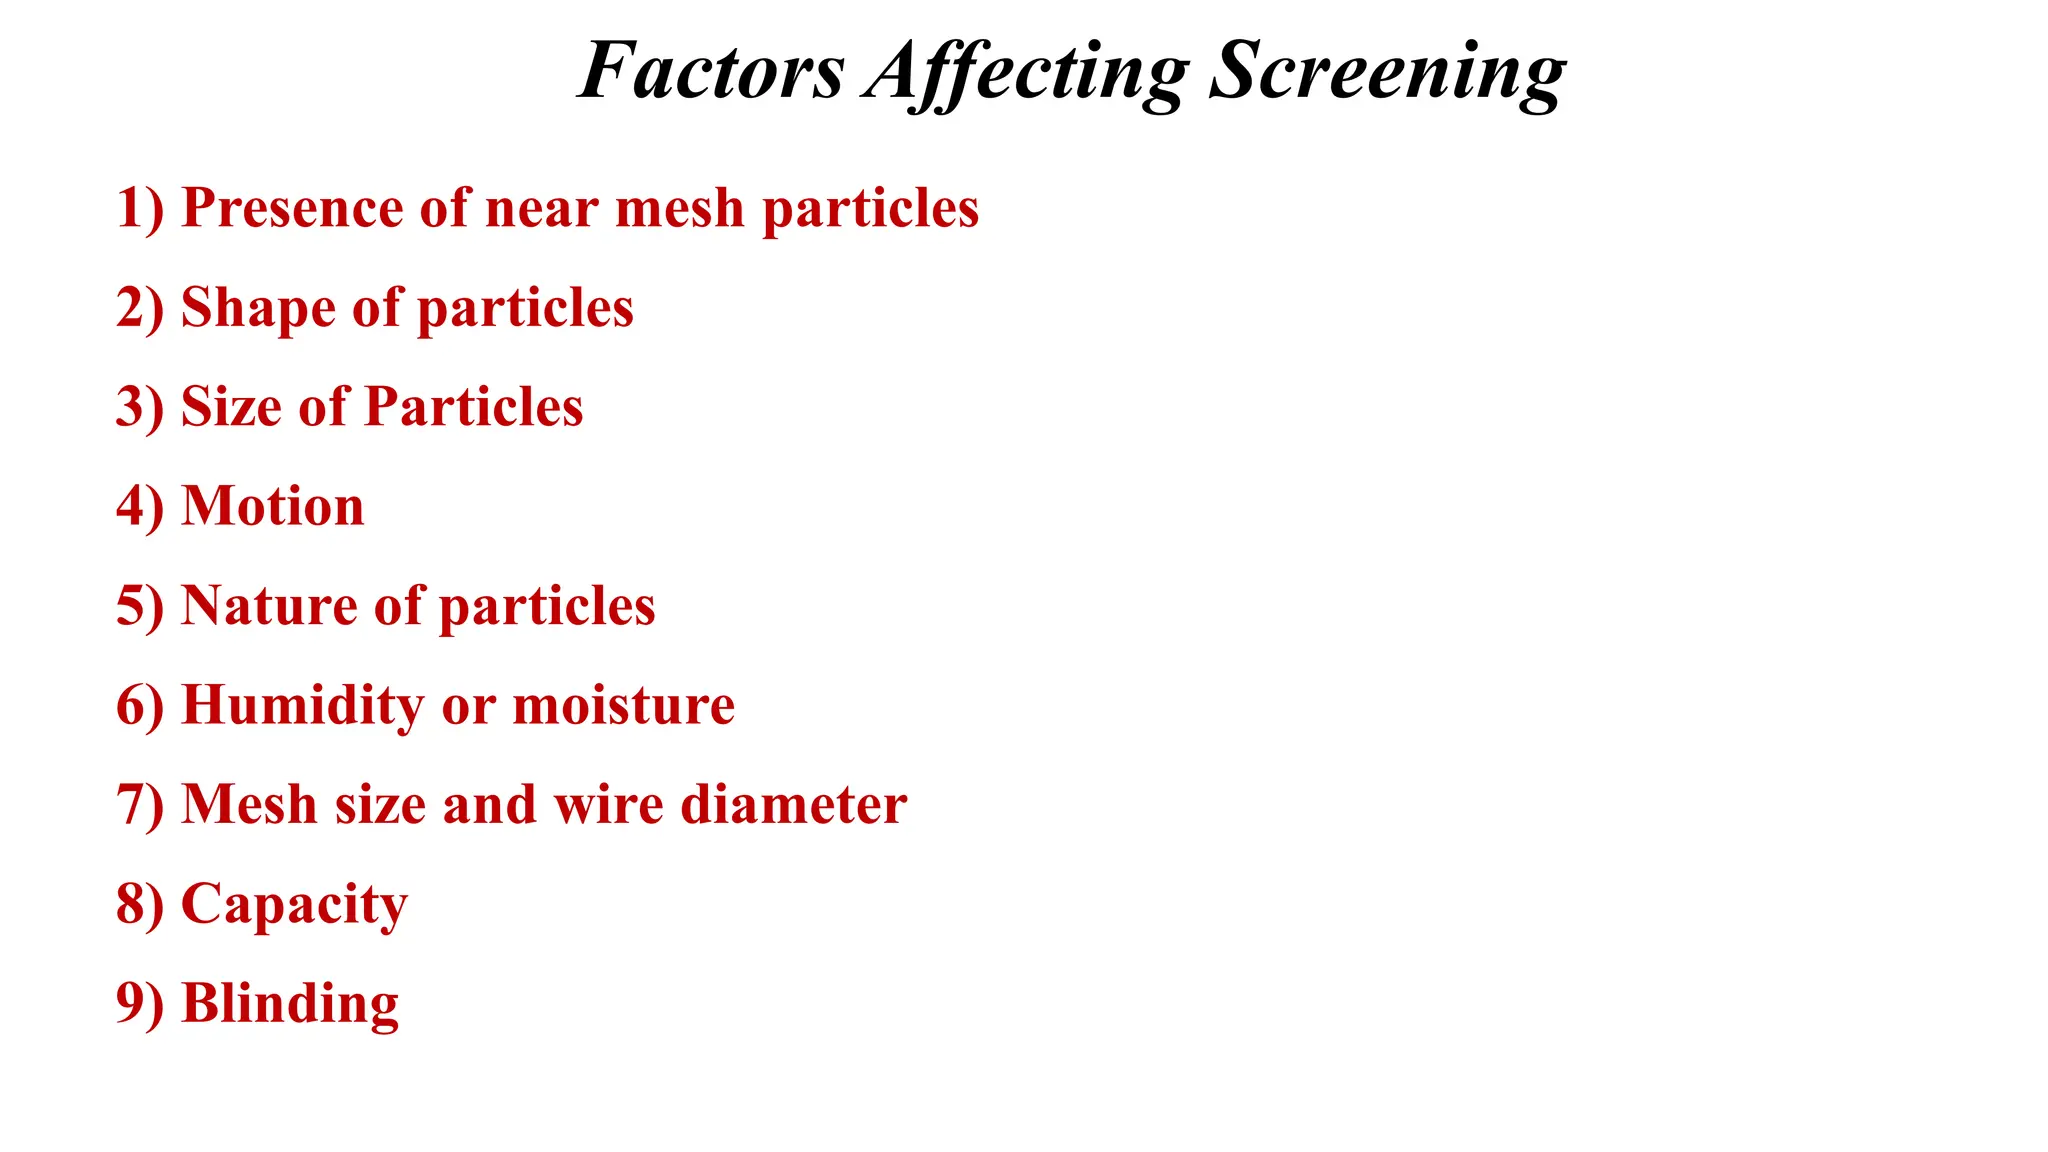
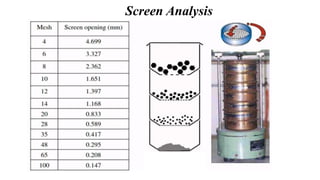
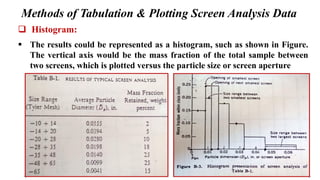
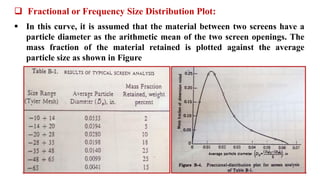
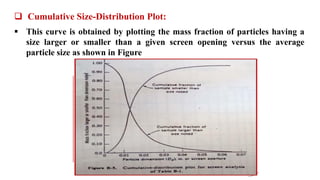

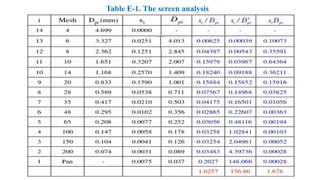
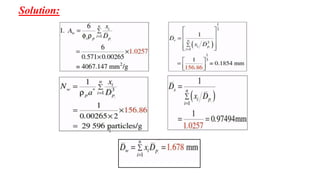
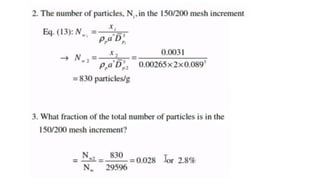
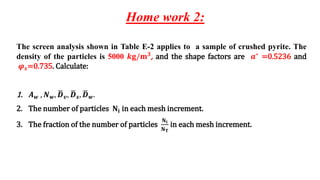
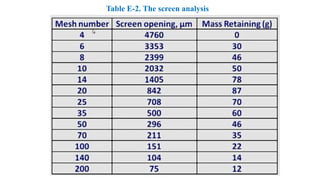
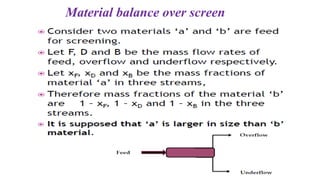
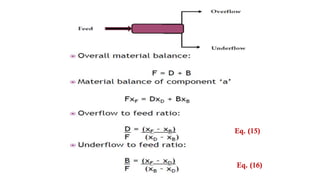
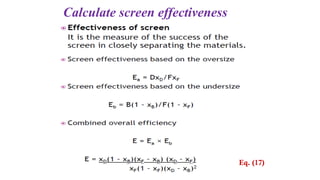


The document discusses various factors affecting particle screening, including particle shape, size, and mesh characteristics. It outlines methods for data representation in screen analysis such as histograms, frequency plots, and cumulative size distributions, supported by examples. Additionally, it briefly mentions industrial screening equipment types and presents calculations related to particle analysis and screen effectiveness.