데이터 분석 및 통계의 기초 개념 R 및 엑셀을 이용한 기술 통계 RHadoop 사용해보기 Learn about basic data analysis R and Excel, R Hadoop


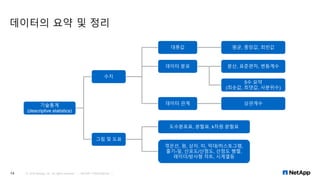


![R 및 RStudio 설치
© 2016 NetApp, Inc. All rights reserved. --- NETAPP CONFIDENTIAL ---28
1. EPEL(Extra Packages for Enterprise Linux) 패키지 설치
[hadoop@hadoop01 ~]$ sudo yum install epel-release
▪ 모든 노드에서 설치
2. R 설치
[hadoop@hadoop01 ~]$ sudo yum install R
▪ 모든 노드에서 설치
3. RStudio 다운로드 및 설치
▪ https://www.rstudio.com/products/rstudio/download/
▪ RStudio Server(OpenSource License) 다운로드 및 사용할 노드 1대에만 설치
▪ http://192.168.2.191:8787
▪ [hadoop@hadoop01 ~]$ sudo yum install --nogpgcheck rstudio-server-rhel-1.0.136-x86_64.rpm
▪ [hadoop@hadoop01 ~]$ systemctl status rstudio-server.service](https://image.slidesharecdn.com/20170728-170730064917/85/Learn-about-basic-data-analysis-28-320.jpg)


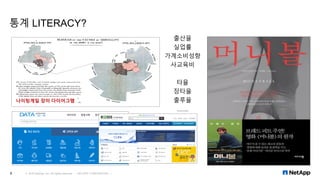
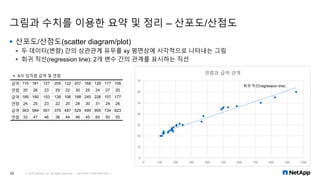
![RHadoop 설치
© 2016 NetApp, Inc. All rights reserved. --- NETAPP CONFIDENTIAL ---37
1. https://github.com/RevolutionAnalytics/RHadoop/wiki 에서 필요 패키지 다운로드 및 모든 노드에 업로드
▪ plyrmr_0.6.0.tar.gz, rhdfs_1.0.8.tar.gz, rmr2_3.3.1.tar.gz
2. R 추가 필요 의존 패키지 설치
[root@hadoop01 ~]# R
> install.packages(‘httr’)
▪ R 패키지: httr, functional, devtools, plyr, reshape2, rJava, RJSONIO, itertools, digest, Rcpp, dplyr, rsjon, caTools등
▪ OS 패키지: *-libcurl-devel-*, *-openssl-devel-* 등
▪ 설치시에 의존성 문제가 발생하면 R의 install.packages 및 CentOS의 yum 명령을 이용하여 필요 패키지 설치
▪ 모든 노드에서 설치
3. RHadoop 패키지 설치
[root@hadoop01 ~]# R CMD INSTALL rmr2_3.3.1.tar.gz
▪ plyrmr_0.6.0.tar.gz, rhdfs_1.0.8.tar.gz, rmr2_3.3.1.tar.gz
▪ 모든 노드에서 설치](https://image.slidesharecdn.com/20170728-170730064917/85/Learn-about-basic-data-analysis-37-320.jpg)
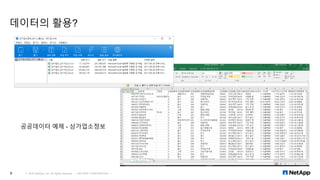
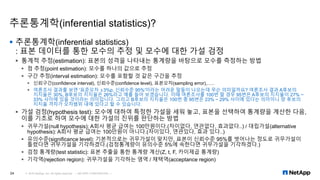
![RHadoop 환경 설정 및 기본 테스트
© 2016 NetApp, Inc. All rights reserved. --- NETAPP CONFIDENTIAL ---38
1. .bashrc 환경변수 설정 – hadoop 사용자의 기타 HADOOP 환경 변수는 설정되어 있다고 가정
# RHadoop
export HADOOP_CMD=/home/hadoop/hadoop/bin/hadoop
export HADOOP_STREAMING=/home/hadoop/hadoop/share/hadoop/tools/lib/hadoop-streaming-2.7.2.jar
2. R 실행 및 RHadoop 기본 테스트 - MapReduce
[hadoop@hadoop01 ~]$ R
> library(rmr2)
> from.dfs(to.dfs(1:100))
> from.dfs(mapreduce(to.dfs(1:100)))
17/01/25 16:18:58 INFO client.RMProxy: Connecting to ResourceManager at hadoop01/192.168.2.191:8032
17/01/25 16:18:59 INFO client.RMProxy: Connecting to ResourceManager at hadoop01/192.168.2.191:8032
…………..
17/01/25 16:19:21 INFO mapreduce.Job: map 50% reduce 0%
17/01/25 16:19:22 INFO mapreduce.Job: map 100% reduce 0%
17/01/25 16:19:22 INFO mapreduce.Job: Counters: 30
File System Counters
FILE: Number of bytes read=0
FILE: Number of bytes written=244870](https://image.slidesharecdn.com/20170728-170730064917/85/Learn-about-basic-data-analysis-38-320.jpg)
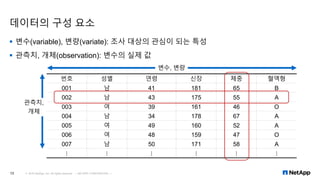
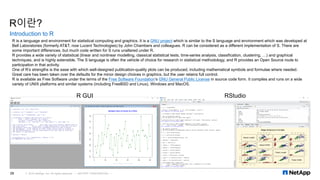
![RHadoop 환경 설정 및 기본 테스트
© 2016 NetApp, Inc. All rights reserved. --- NETAPP CONFIDENTIAL ---39
3. RHadoop 기본 테스트 – hdfs
> library(rhdfs)
> hdfs.init()
> hdfs.ls(‘/’)
permission owner group size modtime file
1 drwx------ hadoop supergroup 0 2017-01-25 16:23 /tmp
2 drwxr-xr-x hadoop supergroup 0 2017-01-25 10:52 /wc_input
> hdfs.defaults('conf')
[1] "Java-Object{Configuration: core-default.xml, core-site.xml, mapred-default.xml, mapred-site.xml, yarn-default.xml,
yarn-site.xml, hdfs-default.xml, hdfs-site.xml}“
> hdfs.defaults('blocksize')
[1] 134217728
> hdfs.defaults('fs')
[1] "Java-Object{DFS[DFSClient[clientName=DFSClient_NONMAPREDUCE_-200405410_1, ugi=hadoop
(auth:SIMPLE)]]}"](https://image.slidesharecdn.com/20170728-170730064917/85/Learn-about-basic-data-analysis-39-320.jpg)


![[Ankus Open Source Conference 2013] 빅데이터 분석을 위한 통계 이해와 해석](https://cdn.slidesharecdn.com/ss_thumbnails/random-131117193321-phpapp01-thumbnail.jpg?width=640&height=640&fit=bounds)


![[파인트리오픈클래스] 엑셀을 활용한 데이터 분석과 이해](https://cdn.slidesharecdn.com/ss_thumbnails/selection1-170223035345-thumbnail.jpg?width=640&height=640&fit=bounds)


![[도서 리뷰] 헤드 퍼스트 데이터 분석 ( Head First Data Analysis )](https://cdn.slidesharecdn.com/ss_thumbnails/headfirstdataanalysis-181125114351-thumbnail.jpg?width=640&height=640&fit=bounds)


![[방송통신대 컴퓨터과학과]데이터정보처리입문 과제물 작성](https://cdn.slidesharecdn.com/ss_thumbnails/knoucomputerscienceintroductiontodatainformationprocessingreportcommit-190903170618-thumbnail.jpg?width=640&height=640&fit=bounds)