This document describes a model of crater formation on the Moon and terrestrial planets based on the current understanding of the impactor population in the inner Solar System. The model calculates impact rates spatially across planetary surfaces to account for nonuniform cratering. It finds that the lunar cratering rate varies with latitude and longitude, being about 25% lower in some regions and higher in others. The model reconciles measured lunar crater size-frequency distributions with observations of near-Earth objects, assuming the presence of a porous lunar megaregolith affects the size of small craters. It provides revised estimates of the ages of some lunar and planetary geological features based on crater counts and the derived crater chronology.
1. The document analyzes the spatial distribution and size-frequency of rayed impact craters on the Moon using Clementine image data.
2. It finds that the size-frequency distribution of rayed craters indicates an average surface age of 750 million years, with compositional rays potentially persisting longer.
3. Small craters below 5 km in diameter show evidence of faster fading of ejecta rays, with an average retention time of only about 5 million years for craters 1-500m in size.
This document proposes a new method for rapidly assessing the age of geological units on Mars using measurements of topographic roughness. It hypothesizes that roughness will be correlated with age derived from crater size-frequency distributions, as craters increase surface roughness over time. To test this, the author analyzes topography images and measures roughness from 125 sites across Mars. Age is calculated from crater counts and compared to roughness measurements. Preliminary results show a significant relationship between some roughness measures and age, though there is also variation likely due to crater degradation processes altering roughness without affecting size distributions. If validated, roughness could provide a faster way to assess relative Martian surface ages than traditional crater counting.
Ancient igneous intrusions_and_early_expansion_of_the_moon_revealed_by_grailSérgio Sacani
1) Application of gravity gradiometry to data from the GRAIL mission revealed numerous linear gravity anomalies on the Moon with lengths of hundreds of kilometers.
2) Inversion of the anomalies indicates they are dense vertical intrusions or dikes formed by ancient magmatism during extension of the lunar lithosphere before the end of heavy bombardment.
3) The distribution, orientation, and size of the intrusions suggest they formed as the Moon's radius increased by 0.6-4.9 km early in its history, consistent with predictions of thermal evolution models.
M6.0 2004 Parkfield Earthquake : Seismic AttenuationAli Osman Öncel
HRSN isimli kuyu içi sismik istasyonlar kullanılarak, San Andreas fayı boyunca meydana gelen büyük depremler öncesi sismik azalımın varlığının olup olmadığı araştırılıyor.
The GRAIL spacecraft measured the gravity field of the Moon at high resolution, allowing determination of the bulk density and porosity of the lunar crust. The analysis found:
1) The bulk density of the lunar highlands crust is 2550 kg/m3, substantially lower than previous estimates due to impact-induced porosity.
2) The average porosity of the crust is 12%, varying regionally from 4-21% and correlated with impact basins.
3) A new global crustal thickness model was constructed satisfying seismic constraints with an average thickness of 34-43 km, indicating the Moon's composition is not highly enriched compared to Earth.
The document discusses gravity anomalies and density variations in different regions based on gravity data. It shows how gravity maps reveal details about crustal thickness, tectonic features like faults and volcanic zones, and plate boundaries. Specific examples discussed include the Tibetan Plateau, Central America subduction zone, an area in Chugoku, Japan, and the state of Florida in the US. Regional gravity data can be used to model density changes associated with plate tectonics, crustal evolution, and volcanic and tectonic activity.
Saturn’s magnetic field revealed by the Cassini Grand FinaleSérgio Sacani
Starting on 26 April 2017,
the Grand Finale phase of the Cassini mission
took the spacecraft through the gap between
Saturn’s atmosphere and the inner edge of its
innermost ring (the D-ring) 22 times, ending
with a final plunge into the atmosphere on
15 September 2017. This phase offered an opportunity
to investigate Saturn’s internal magnetic
field and the electromagnetic environment
between the planet and its rings. The internal
magnetic field is a diagnostic of interior structure,
dynamics, and evolution of
the host planet. Rotating convective
motion in the highly electrically
conducting layer of the planet
is thought to maintain the magnetic
field through the magnetohydrodynamic
(MHD) dynamo
process. Saturn’s internal magnetic
field is puzzling because of its
high symmetry relative to the spin
axis, known since the Pioneer 11
flyby. This symmetry prevents an
accurate determination of the rotation
rate of Saturn’s deep interior
and challenges our understanding
of the MHD dynamo process because
Cowling’s theorem precludes
a perfectly axisymmetric magnetic
field being maintained through an
active dynamo.
The nonmagnetic nucleus_of_comet_67_p_churyumov_gerasimenkoSérgio Sacani
Artigo descreve como a sonda Rosetta e o módulo Philae descobriram que o cometa Churyumov-Gerasimenko não é magnetizado, contrariando uma teoria da formação do Sistema Solar.
Mars surface radiation_environment_measured_with_curiositySérgio Sacani
The Radiation Assessment Detector on the Curiosity rover measured the radiation environment on the surface of Mars over approximately 300 days. It found:
1) The average absorbed radiation dose from galactic cosmic rays was 0.210 mGy/day, varying due to atmospheric and solar conditions.
2) An additional absorbed dose of about 50 μGy was measured from a solar particle event.
3) Extrapolating the surface measurements, the absorbed dose was estimated to be 76 mGy/year at 1 meter below the surface, decreasing substantially at greater depths.
Similarities between gravity and magnetics and application of different geoph...Jyoti Khatiwada
The document discusses similarities and differences between gravity and magnetic geophysical survey methods. Some key similarities are that both measure naturally occurring fields of the Earth (gravity and magnetic), both use identical physical and mathematical representations, and data acquisition/reduction/interpretation are similar. Key differences include magnetic susceptibility varying more than density, magnetic forces can be attractive or repulsive while gravity is always attractive, and the magnetic field is time-dependent unlike gravity.
VIMS images of the Huygens landing site on Titan acquired during Cassini flybys in October and December 2004 provide insight into surface features near the landing site with spatial resolutions of 14.4-19 km/pixel. Ratio images of the brightest and darkest spectra in the 2.03 μm window reveal a particularly contrasted structure north of the landing site, consistent with local enrichment in exposed water ice. The images also show a possible 150 km diameter impact crater with a central peak. While scattering from haze particles dominates Titan's spectrum, spectral ratios of bright and dark areas suggest differences in surface composition and/or topography related to DISR images of the site.
Extensive Noachian fluvial systems in Arabia Terra: Implications for early Ma...Sérgio Sacani
Valley networks are some of the strongest lines of evidence for
extensive fluvial activity on early (Noachian; >3.7 Ga) Mars. However,
their purported absence on certain ancient terrains, such as
Arabia Terra, is at variance with patterns of precipitation as predicted
by “warm and wet” climate models. This disagreement has contributed
to the development of an alternative “icy highlands” scenario,
whereby valley networks were formed by the melting of highland ice
sheets. Here, we show through regional mapping that Arabia Terra
shows evidence for extensive networks of sinuous ridges. We interpret
these ridge features as inverted fluvial channels that formed in
the Noachian, before being subject to burial and exhumation. The
inverted channels developed on extensive aggrading flood plains. As
the inverted channels are both sourced in, and traverse across, Arabia
Terra, their formation is inconsistent with discrete, localized sources
of water, such as meltwater from highland ice sheets. Our results are
instead more consistent with an early Mars that supported widespread
precipitation and runoff.
This document discusses seismic stratigraphy, which uses seismic data to extract stratigraphic information about subsurface rock layers. It defines seismic waves and methods, including refraction and reflection. Reflection seismic is more commonly used to identify structures like folds and faults beneath the surface. Key parameters for interpretation are reflection configuration, continuity, amplitude, frequency, and interval velocity. Depositional environments are also identified based on their relationship to the wave base.
The dynamic geophysical environment of (101955) Bennu based on OSIRIS-REx mea...Sérgio Sacani
The document summarizes measurements and analysis of asteroid Bennu conducted during the OSIRIS-REx mission's preliminary survey phase. Key findings include:
1) Bennu's measured bulk density is 1,190 ± 13 kg m-3, consistent with a rubble-pile interior that is 40-50% empty space.
2) Global mapping of Bennu's surface slopes found a transition at the boundary of the "rotational Roche lobe", with more relaxed slopes inside the lobe likely due to particle redistribution.
3) Bennu's top-like shape and evidence of interior heterogeneity suggest it underwent spin-induced failure at some point, though when and how is still unknown.
This document describes a Bayesian inversion approach to jointly interpret multiple seismic data types that provide information about anisotropic layering in the upper mantle. Surface wave dispersion curves, SKS splitting measurements, and receiver functions are traditionally interpreted separately, but sample different volumes of the Earth and have different sensitivities and uncertainties. The proposed method directly inverts seismograms for SKS and P phases using a cross-convolution approach, avoiding intermediate processing steps. A transdimensional Markov chain Monte Carlo scheme obtains probabilistic 1-D seismic velocity profiles down to 350 km depth beneath two stations, treating the number of layers and presence of anisotropy as unknown parameters. For both stations, the lithosphere-asthenosphere boundary is clearly visible and marked by
Magnetic field and_wind_of_kappa_ceti_towards_the_planetary_habitability_of_t...Sérgio Sacani
We report magnetic field measurements for κ
1 Cet, a proxy of the young Sun when life arose on Earth. We carry out an analysis
of the magnetic properties determined from spectropolarimetric observations and reconstruct its large-scale surface magnetic
field to derive the magnetic environment, stellar winds and particle flux permeating the interplanetary medium around κ
1 Cet.
Our results show a closer magnetosphere and mass-loss rate of M˙ = 9.7 × 10⁻¹³ M yr−1
, i.e., a factor 50 times larger than the
current solar wind mass-loss rate, resulting in a larger interaction via space weather disturbances between the stellar wind and
a hypothetical young-Earth analogue, potentially affecting the planet’s habitability. Interaction of the wind from the young Sun
with the planetary ancient magnetic field may have affected the young Earth and its life conditions.
This document discusses predicting volcanic rock facies distributions in the Yingcheng Formation of the Yingshan depression based on seismic attributes. It uses coherence detection to identify craters, waveform clustering to predict facies boundaries, and amplitude attributes to refine boundaries and classify facies. Three main facies are identified - crater/proximal facies with good porosity, proximal facies with moderate porosity, and distal facies. Prediction results match well logging data and identify crater and distal facies as favorable reservoirs.
Similarities and differences between gravity and magneticAkhtar Hussain
Geophysical exploration techniques that employ gravity and magnetic methods are passive, as they measure naturally occurring fields of the earth. Both gravity and magnetic fields are vector fields and force fields that exert force at the speed of light. While there are some similarities, there are also key differences between the two methods. The fundamental parameter controlling gravity variations is rock density, while the parameter for magnetic variations is magnetic susceptibility, which can vary widely even within the same rock type. Additionally, the gravitational field is always perpendicular to the earth's surface, whereas the magnetic field direction changes by location.
1) Geophysical surveys have been using measurements of the Earth's magnetic field for nearly 500 years since Gilbert showed that the Earth behaves like a large magnet.
2) Gravity and magnetic surveying methods are similar in that they both measure naturally occurring fields (potential fields), can use identical physical representations like magnetic monopoles, and have similar data acquisition and interpretation.
3) However, magnetic surveying also has differences from gravity - magnetic susceptibility of rocks can vary more than density, magnetism can be attractive or repulsive unlike gravity, magnetic sources always occur in pairs unlike gravity, and the magnetic field is time-dependent unlike gravity.
The document discusses different geophysical methods used for subsurface exploration, including gravity, magnetic, electrical resistivity, and seismic methods. It focuses on explaining the gravity and magnetic methods. Gravity surveys measure differences in the gravitational field to detect variations in subsurface density distributions. Magnetic surveys map variations in the magnetic field caused by changes in magnetic susceptibility or structure of near-surface rocks. Both methods are used to locate features like hydrocarbon deposits, ore bodies, cavities, and buried structures or utilities.
Jupiter’s magnetosphere and aurorae observed by the Juno spacecraft during it...Sérgio Sacani
The Juno spacecraft acquired direct observations of the jovian magnetosphere and auroral
emissions from a vantage point above the poles. Juno’s capture orbit spanned the jovian
magnetosphere from bow shock to the planet, providing magnetic field, charged particle,
and wave phenomena context for Juno’s passage over the poles and traverse of Jupiter’s
hazardous inner radiation belts. Juno’s energetic particle and plasma detectors measured
electrons precipitating in the polar regions, exciting intense aurorae, observed
simultaneously by the ultraviolet and infrared imaging spectrographs. Juno transited
beneath the most intense parts of the radiation belts, passed about 4000 kilometers
above the cloud tops at closest approach, well inside the jovian rings, and recorded the
electrical signatures of high-velocity impacts with small particles as it traversed the equator.
Geophysical surveys use physical methods at the Earth's surface to measure subsurface physical properties and anomalies. Types of geophysical surveys include gravity, magnetic, electrical, seismic, radiometric, and geothermal methods. The gravity method measures minute variations in gravity caused by differences in subsurface density and distance from the Earth's center. Gravity surveys can be aerial or land-based, using a highly sensitive gravimeter. Processed gravity data is plotted on maps showing variations due to subsurface densities, and is used for hydrocarbon exploration, mineral deposits, cavity detection, and other applications.
Jupiter’s interior and deep atmosphere: The initial pole-to-pole passes with ...Sérgio Sacani
On 27 August 2016, the Juno spacecraft acquired science observations of Jupiter,
passing less than 5000 kilometers above the equatorial cloud tops. Images of Jupiter’s
poles show a chaotic scene, unlike Saturn’s poles. Microwave sounding reveals weather
features at pressures deeper than 100 bars, dominated by an ammonia-rich, narrow
low-latitude plume resembling a deeper, wider version of Earth’s Hadley cell. Near-infrared
mapping reveals the relative humidity within prominent downwelling regions. Juno’s
measured gravity field differs substantially from the last available estimate and is one
order of magnitude more precise. This has implications for the distribution of heavy
elements in the interior, including the existence and mass of Jupiter’s core. The observed
magnetic field exhibits smaller spatial variations than expected, indicative of a rich
harmonic content.
DISCOVERY OF A GALAXY CLUSTER WITH A VIOLENTLY STARBURSTING CORE AT z = 2:506Sérgio Sacani
We report the discovery of a remarkable concentration of massive galaxies with extended X-ray
emission at zspec = 2:506, which contains 11 massive (M & 1011M) galaxies in the central 80kpc
region (11.6 overdensity). We have spectroscopically conrmed 17 member galaxies with 11 from CO
and the remaining ones from H. The X-ray luminosity, stellar mass content and velocity dispersion
all point to a collapsed, cluster-sized dark matter halo with mass M200c = 1013:90:2M, making it
the most distant X-ray-detected cluster known to date. Unlike other clusters discovered so far, this
structure is dominated by star-forming galaxies (SFGs) in the core with only 2 out of the 11 massive
galaxies classied as quiescent. The star formation rate (SFR) in the 80kpc core reaches 3400 M
yr 1 with a gas depletion time of 200 Myr, suggesting that we caught this cluster in rapid build-up
of a dense core. The high SFR is driven by both a high abundance of SFGs and a higher starburst
fraction ( 25%, compared to 3%-5% in the eld). The presence of both a collapsed, cluster-sized
halo and a predominant population of massive SFGs suggests that this structure could represent an
important transition phase between protoclusters and mature clusters. It provides evidence that the
main phase of massive galaxy passivization will take place after galaxies accrete onto the cluster,
providing new insights into massive cluster formation at early epochs. The large integrated stellar
mass at such high redshift challenges our understanding of massive cluster formation.
- Gravity and magnetic mapping techniques measure small variations in the Earth's gravity and magnetic fields to infer properties of subsurface geology.
- Gravity mapping uses highly sensitive spring balances called gravimeters to detect variations as small as 0.001 mgal, while magnetic mapping uses electronic instruments to continuously record magnetic field variations.
- Corrections must be applied to gravity and magnetic data to account for factors like latitude, elevation, density variations, and temporal changes in the magnetic field.
- Interpretation of the residual anomaly maps provides constraints on the locations, shapes, and depths of subsurface density and magnetic sources, allowing inference of geological structures.
The document summarizes numerical simulations of magma convection and mixing dynamics in volcanic systems. The simulations reveal unexpected pressure trends and oscillations in the Ultra-Long-Period (ULP) range of minutes related to the generation of rising magma plumes. These very long pressure oscillations can translate to comparable ULP ground displacements at the surface with amplitudes of 10-4 to 10-2 meters. Therefore, new magma injection into shallow magma chambers beneath volcanoes may be revealed by measuring ULP ground displacement.
Disc dark matter_in_the_galaxy_and_potential_cycles_of_extraterrestrial_impac...Sérgio Sacani
This document discusses potential periodic cycles of extraterrestrial impacts, mass extinctions, and geological events on Earth. It proposes that:
1) Mass extinctions and impact cratering may exhibit cycles of around 26-30 million years that could be linked to the Sun's vertical oscillations through the Galactic plane around every 30-42 million years.
2) Near the Galactic plane, comets in the Oort Cloud could be perturbed by Galactic tidal forces and a possible thin dark matter disc, producing periodic comet showers and impacts on Earth linked to extinction events.
3) Records of geological events like tectonism and volcanism also show a potential cycle of around 30 million years that could be linked to the
The document summarizes research on the origin of lunar concentric craters. The researchers analyzed data from Clementine, SELENE, and LRO to study 58 known concentric craters. They identified three morphological types and found concentric craters have shallower depths and smaller rim heights than fresh simple craters, suggesting impact degradation or uplift. Distribution near mare/highland boundaries and similarities to floor-fractured craters supports igneous intrusion as the most probable formation mechanism, rather than exogenic processes like simultaneous impacts or impact into layered targets.
Beyond the Drake Equation: A Time-Dependent Inventory of Habitable Planets an...Sérgio Sacani
We introduce a mathematical framework for statistical exoplanet population and astrobiology studies
that may help directing future observational efforts and experiments. The approach is based on a
set of differential equations and provides a time-dependent mapping between star formation, metal
enrichment, and the occurrence of exoplanets and potentially life-harboring worlds over the chemopopulation history of the solar neighborhood. Our results are summarized as follows: 1) the formation
of exoplanets in the solar vicinity was episodic, starting with the emergence of the thick disk about
11 Gyr ago; 2) within 100 pc from the Sun, there are as many as 11, 000 (η⊕/0.24) Earth-size planets
in the habitable zone (“temperate terrestrial planets” or TTPs) of K-type stars. The solar system is
younger than the median TTP, and was created in a star formation surge that peaked 5.5 Gyr ago and
was triggered by an external agent; 3) the metallicity modulation of the giant planet occurrence rate
results in a later typical formation time, with TTPs outnumbering giant planets at early times; 4) the
closest, life-harboring Earth-like planet would be ∼
< 20 pc away if microbial life arose as soon as it did
on Earth in ∼
> 1% of the TTPs around K stars. If simple life is abundant (fast abiogenesis), it is also
old, as it would have emerged more than 8 Gyr ago in about one third of all life-bearing planets today.
Older Earth analogs are more likely to have developed sufficiently complex life capable of altering the
environment and producing detectable oxygenic biosignatures.
This document describes experiments simulating volcanic flooding on the Moon using lunar topography data. Three similarly sized regions were artificially flooded: 1) heavily cratered terrain, 2) Hertzsprung basin, and 3) the Central Highlands. As flooding progressed, small craters were buried first followed by larger craters. Comparing the results from point source and ubiquitous flooding showed little difference in the volume of lava added or changes to crater size distributions over time. The experiments provide insights into estimating lava volumes involved in large scale resurfacing events on terrestrial planets.
Venus and Earth have remarkably diferent
surface conditions, yet the lithospheric
thickness and heat fow on Venus may be
Earth-like. This fnding supports a tectonic
regime with limited surface mobility and
dominated by intrusive magmatism.
Artigo relata como a Terra sofreu com os impactos de ateroides a 4 bilhões de anos atrás, e como a superfície do planeta foi remodelada e os oceanos formados.
This document summarizes evidence that argues against the hypothesis of a "lunar terminal cataclysm" approximately 3.9 billion years ago. It analyzes dating of lunar highland rocks and meteorites, finding they do not show a prominent peak at 3.9 billion years as expected, but rather a more uniform distribution of ages. Analysis of the cratering record of lunar basins also argues against a spike in the lunar bombardment rate at that time. Modeling of impact melt production and redistribution across the lunar surface further casts doubt on there having been a major cataclysm 3.9 billion years ago as hypothesized.
Hints that the_lunar_impactflux_has_not_been_constant_for_large_impacts_durin...Sérgio Sacani
This study analyzed 18 lunar craters between 50-300km in diameter to determine if the impact flux for large craters has been constant over the past 3 billion years. Model ages were calculated for each crater based on the size-frequency distribution of smaller superposed craters. The results suggest many craters may be older than previously thought, indicating possible spikes in the large impactor flux around 0-0.8Ga and 1.7-2.2Ga, and lulls between 0.9-1.6Ga and 2.3-3.2Ga. More analysis of additional large craters is still needed to verify if the flux was truly non-constant.
Extensive Pollution of Uranus and Neptune’s Atmospheres by Upsweep of Icy Mat...Sérgio Sacani
In the Nice model of solar system formation, Uranus and Neptune undergo an orbital upheaval,
sweeping through a planetesimal disk. The region of the disk from which material is accreted by
the ice giants during this phase of their evolution has not previously been identified. We perform
direct N-body orbital simulations of the four giant planets to determine the amount and origin of solid
accretion during this orbital upheaval. We find that the ice giants undergo an extreme bombardment
event, with collision rates as much as ∼3 per hour assuming km-sized planetesimals, increasing the
total planet mass by up to ∼0.35%. In all cases, the initially outermost ice giant experiences the
largest total enhancement. We determine that for some plausible planetesimal properties, the resulting
atmospheric enrichment could potentially produce sufficient latent heat to alter the planetary cooling
timescale according to existing models. Our findings suggest that substantial accretion during this
phase of planetary evolution may have been sufficient to impact the atmospheric composition and
thermal evolution of the ice giants, motivating future work on the fate of deposited solid material.
The colision between_the_milky_way_and_andromedaSérgio Sacani
The document summarizes a simulation of the future collision between the Milky Way and Andromeda galaxies. It finds that given current observational constraints on their distance, velocity, and masses:
1) The Milky Way and Andromeda are likely to collide in a few billion years, within the lifetime of the Sun.
2) During the interaction, there is a chance the Sun could be pulled into an extended tidal tail between the galaxies.
3) Eventually, after the merger is complete, the Sun would most likely be scattered to the outer halo of the merged galaxy at a distance over 30 kpc.
This document discusses evidence that the Moon-forming impact occurred later than previously thought, at around 95 million years after the formation of the solar system. The study uses simulations of planetary formation to show a correlation between the timing of the last giant impact and the amount of mass later accreted by the planet. Comparing this to highly siderophile element abundances in Earth's mantle, which constrain the amount of late-accreted mass, the study determines the Moon-forming impact was most likely 95 million years after solar system formation. Earlier times of 40 million years or less are ruled out at a 99.9% confidence level. The simulations include both classical scenarios and scenarios where Jupiter and Saturn migrated inward early in the solar
How common are earth moon planetary systemsSérgio Sacani
This document discusses the frequency of Earth-moon type planetary systems based on simulations of terrestrial planet formation. It first reviews how simulations of planet formation have improved over time to model more particles over longer timescales. It then examines parameters from a large set of simulations to identify collisions that could result in circumplanetary disks and satellite formation. The authors find that such moon-forming impacts occur in about 1 in 12 to 1 in 4 simulations, suggesting Earth-moon systems may be relatively common around other terrestrial planets.
A Morphological and Spatial Analysis of Volcanoes on VenusSérgio Sacani
Venus is home to many thousands of volcanic landforms that range in size from much less than 5 km to well over 100 km in diameter. Volcanism is clearly a major, widespread process on Venus, and is a principal expression of the planet's secular loss of interior heat. Without sufficient in situ data to clearly determine its internal structure, we can use the morphological and spatial properties of volcanoes across the planet to help place constraints on our understanding of the volcanic characteristics and history of Venus. With the Magellan synthetic-aperture radar full-resolution radar map left- and right-look global mosaics at 75 m-per-pixel resolution, we developed a global catalog of volcanoes on Venus that contains ∼85,000 edifices, ∼99% of which are <5 km in diameter. We find that Venus hosts far more volcanoes than previously mapped, and that although they are distributed across virtually the entire planet, size–frequency distribution analysis reveals a relative lack of edifices in the 20–100 km diameter range, which could be related to magma availability and eruption rate. Through spatial density analysis of volcanoes alongside assessments of geophysical data sets and proximal tectonic and volcanic structures, we report on the morphological and spatial patterns of volcanism on Venus to help gain new insights into the planet's geological evolution
Proterozoic Milankovitch cycles and the history of the solar systemSérgio Sacani
The geologic record of Milankovitch climate cycles provides a rich
conceptual and temporal framework for evaluating Earth system
evolution, bestowing a sharp lens through which to view our
planet’s history. However, the utility of these cycles for constraining
the early Earth system is hindered by seemingly insurmountable
uncertainties in our knowledge of solar system behavior
(including Earth–Moon history), and poor temporal control for validation
of cycle periods (e.g., from radioisotopic dates). Here we
address these problems using a Bayesian inversion approach to
quantitatively link astronomical theory with geologic observation,
allowing a reconstruction of Proterozoic astronomical cycles, fundamental
frequencies of the solar system, the precession constant,
and the underlying geologic timescale, directly from stratigraphic
data. Application of the approach to 1.4-billion-year-old rhythmites
indicates a precession constant of 85.79 ± 2.72 arcsec/year (2σ),
an Earth–Moon distance of 340,900 ± 2,600 km (2σ), and length of
day of 18.68 ± 0.25 hours (2σ), with dominant climatic precession
cycles of ∼14 ky and eccentricity cycles of ∼131 ky. The results
confirm reduced tidal dissipation in the Proterozoic. A complementary
analysis of Eocene rhythmites (∼55 Ma) illustrates how the
approach offers a means to map out ancient solar system behavior
and Earth–Moon history using the geologic archive. The method
also provides robust quantitative uncertainties on the eccentricity
and climatic precession periods, and derived astronomical timescales.
As a consequence, the temporal resolution of ancient Earth
system processes is enhanced, and our knowledge of early solar
system dynamics is greatly improved.
Periodic mass extinctions_and_the_planet_x_model_reconsideredSérgio Sacani
The 27 Myr periodicity in the fossil extinction record has been con-
firmed in modern data bases dating back 500 Myr, which is twice the time
interval of the original analysis from thirty years ago. The surprising regularity
of this period has been used to reject the Nemesis model. A second
model based on the sun’s vertical galactic oscillations has been challenged
on the basis of an inconsistency in period and phasing. The third astronomical
model originally proposed to explain the periodicity is the Planet
X model in which the period is associated with the perihelion precession
of the inclined orbit of a trans-Neptunian planet. Recently, and unrelated
to mass extinctions, a trans-Neptunian super-Earth planet has been proposed
to explain the observation that the inner Oort cloud objects Sedna
and 2012VP113 have perihelia that lie near the ecliptic plane. In this
Letter we reconsider the Planet X model in light of the confluence of the
modern palaeontological and outer solar system dynamical evidence.
Key Words: astrobiology - planets and satellites - Kuiper belt:
general - comets: general
Lunar ejecta origin of near-Earth asteroid Kamo’oalewa is compatible with rar...Sérgio Sacani
Near-Earth asteroid, Kamo’oalewa (469219), is one of a small number of known quasisatellites of Earth; it transitions between quasi-satellite and horseshoe orbital states on
centennial timescales, maintaining this dynamics over megayears. The similarity of its
reflectance spectrum to lunar silicates and its Earth-like orbit both suggest that it originated
from the lunar surface. Here we carry out numerical simulations of the dynamical evolution of
particles launched from different locations on the lunar surface with a range of ejection
velocities in order to assess the hypothesis that Kamo‘oalewa originated as a debris-fragment
from a meteoroidal impact with the lunar surface. As these ejecta escape the Earth-Moon
environment, they face a dynamical barrier for entry into Earth’s co-orbital space. However, a
small fraction of launch conditions yields outcomes that are compatible with Kamo‘oalewa’s
orbit. The most favored conditions are launch velocities slightly above the escape velocity
from the trailing lunar hemisphere.
Lunar Surface Model Age Derivation: Comparisons Between Automatic and Human C...Sérgio Sacani
Automated crater detection was performed on images of the Moon's surface from Kaguya Terrain Camera and LRO-NAC images. Crater size-frequency distributions from the automated detections were used to derive model ages for four Copernican impact craters (North Ray, Lalande, Tycho, Copernicus) and four young mare surfaces, and compared to previously published manually-derived model ages. When secondary and buried craters were excluded from the automated counts, the resulting model ages were generally within 20% of the published values, demonstrating that automated crater detection can reliably determine lunar surface ages when used carefully.
Lenz et al. discovered that soft particles at the nano- and microscale can form "clumpy crystals" where particles partially overlap and form regular lattices of clumps. This challenges ideas that soft materials will behave similarly to atomic and molecular systems. The discovery provides another example of how soft materials display unconventional behavior. An analysis of the satellites orbiting Andromeda found that about half are rotating coherently in a thin planar structure, providing a new constraint on galaxy formation theories. Further evidence suggests organized planar distributions of satellites may be common for nearby galaxy groups. The findings compound issues with the number of predicted versus observed satellites and suggest the structures themselves are not ancient.
The document describes measurements of the proper motion of the Andromeda Galaxy (M31) using Hubble Space Telescope imaging data from multiple fields observed at two epochs separated by 5-7 years. Background galaxies in the images are used as stationary reference objects to measure the displacement of thousands of M31 stars between epochs. This allows determining M31's absolute proper motion with an accuracy of 12 microarcseconds per year, providing crucial information about M31 and the Local Group's dynamics and future evolution.
The hazardous km-sized NEOs of the next thousands of yearsSérgio Sacani
This document discusses methods for assessing the long-term impact risk of km-sized near-Earth objects (NEOs) over thousands of years. It analyzes the evolution of the Minimum Orbit Intersection Distance (MOID) between NEOs and Earth to identify objects that remain in close proximity for extended periods. It then estimates the probability of a deep Earth encounter during these low-MOID periods based on the growth of orbital uncertainties over time. This allows the authors to rank km-sized NEOs by their long-term impact hazard and identify targets that warrant further observation and analysis.
Compositions of iron-meteorite parent bodies constrainthe structure of the pr...Sérgio Sacani
Magmatic iron-meteorite parent bodies are the earliest planetesimals in the Solar System,and they preserve information about conditions and planet-forming processes in thesolar nebula. In this study, we include comprehensive elemental compositions andfractional-crystallization modeling for iron meteorites from the cores of five differenti-ated asteroids from the inner Solar System. Together with previous results of metalliccores from the outer Solar System, we conclude that asteroidal cores from the outerSolar System have smaller sizes, elevated siderophile-element abundances, and simplercrystallization processes than those from the inner Solar System. These differences arerelated to the formation locations of the parent asteroids because the solar protoplane-tary disk varied in redox conditions, elemental distributions, and dynamics at differentheliocentric distances. Using highly siderophile-element data from iron meteorites, wereconstruct the distribution of calcium-aluminum-rich inclusions (CAIs) across theprotoplanetary disk within the first million years of Solar-System history. CAIs, the firstsolids to condense in the Solar System, formed close to the Sun. They were, however,concentrated within the outer disk and depleted within the inner disk. Future modelsof the structure and evolution of the protoplanetary disk should account for this dis-tribution pattern of CAIs.
Signatures of wave erosion in Titan’s coastsSérgio Sacani
The shorelines of Titan’s hydrocarbon seas trace flooded erosional landforms such as river valleys; however, it isunclear whether coastal erosion has subsequently altered these shorelines. Spacecraft observations and theo-retical models suggest that wind may cause waves to form on Titan’s seas, potentially driving coastal erosion,but the observational evidence of waves is indirect, and the processes affecting shoreline evolution on Titanremain unknown. No widely accepted framework exists for using shoreline morphology to quantitatively dis-cern coastal erosion mechanisms, even on Earth, where the dominant mechanisms are known. We combinelandscape evolution models with measurements of shoreline shape on Earth to characterize how differentcoastal erosion mechanisms affect shoreline morphology. Applying this framework to Titan, we find that theshorelines of Titan’s seas are most consistent with flooded landscapes that subsequently have been eroded bywaves, rather than a uniform erosional process or no coastal erosion, particularly if wave growth saturates atfetch lengths of tens of kilometers.
SDSS1335+0728: The awakening of a ∼ 106M⊙ black hole⋆Sérgio Sacani
Context. The early-type galaxy SDSS J133519.91+072807.4 (hereafter SDSS1335+0728), which had exhibited no prior optical variations during the preceding two decades, began showing significant nuclear variability in the Zwicky Transient Facility (ZTF) alert stream from December 2019 (as ZTF19acnskyy). This variability behaviour, coupled with the host-galaxy properties, suggests that SDSS1335+0728 hosts a ∼ 106M⊙ black hole (BH) that is currently in the process of ‘turning on’. Aims. We present a multi-wavelength photometric analysis and spectroscopic follow-up performed with the aim of better understanding the origin of the nuclear variations detected in SDSS1335+0728. Methods. We used archival photometry (from WISE, 2MASS, SDSS, GALEX, eROSITA) and spectroscopic data (from SDSS and LAMOST) to study the state of SDSS1335+0728 prior to December 2019, and new observations from Swift, SOAR/Goodman, VLT/X-shooter, and Keck/LRIS taken after its turn-on to characterise its current state. We analysed the variability of SDSS1335+0728 in the X-ray/UV/optical/mid-infrared range, modelled its spectral energy distribution prior to and after December 2019, and studied the evolution of its UV/optical spectra. Results. From our multi-wavelength photometric analysis, we find that: (a) since 2021, the UV flux (from Swift/UVOT observations) is four times brighter than the flux reported by GALEX in 2004; (b) since June 2022, the mid-infrared flux has risen more than two times, and the W1−W2 WISE colour has become redder; and (c) since February 2024, the source has begun showing X-ray emission. From our spectroscopic follow-up, we see that (i) the narrow emission line ratios are now consistent with a more energetic ionising continuum; (ii) broad emission lines are not detected; and (iii) the [OIII] line increased its flux ∼ 3.6 years after the first ZTF alert, which implies a relatively compact narrow-line-emitting region. Conclusions. We conclude that the variations observed in SDSS1335+0728 could be either explained by a ∼ 106M⊙ AGN that is just turning on or by an exotic tidal disruption event (TDE). If the former is true, SDSS1335+0728 is one of the strongest cases of an AGNobserved in the process of activating. If the latter were found to be the case, it would correspond to the longest and faintest TDE ever observed (or another class of still unknown nuclear transient). Future observations of SDSS1335+0728 are crucial to further understand its behaviour. Key words. galaxies: active– accretion, accretion discs– galaxies: individual: SDSS J133519.91+072807.4
Discovery of An Apparent Red, High-Velocity Type Ia Supernova at 𝐳 = 2.9 wi...Sérgio Sacani
We present the JWST discovery of SN 2023adsy, a transient object located in a host galaxy JADES-GS
+
53.13485
−
27.82088
with a host spectroscopic redshift of
2.903
±
0.007
. The transient was identified in deep James Webb Space Telescope (JWST)/NIRCam imaging from the JWST Advanced Deep Extragalactic Survey (JADES) program. Photometric and spectroscopic followup with NIRCam and NIRSpec, respectively, confirm the redshift and yield UV-NIR light-curve, NIR color, and spectroscopic information all consistent with a Type Ia classification. Despite its classification as a likely SN Ia, SN 2023adsy is both fairly red (
�
(
�
−
�
)
∼
0.9
) despite a host galaxy with low-extinction and has a high Ca II velocity (
19
,
000
±
2
,
000
km/s) compared to the general population of SNe Ia. While these characteristics are consistent with some Ca-rich SNe Ia, particularly SN 2016hnk, SN 2023adsy is intrinsically brighter than the low-
�
Ca-rich population. Although such an object is too red for any low-
�
cosmological sample, we apply a fiducial standardization approach to SN 2023adsy and find that the SN 2023adsy luminosity distance measurement is in excellent agreement (
≲
1
�
) with
Λ
CDM. Therefore unlike low-
�
Ca-rich SNe Ia, SN 2023adsy is standardizable and gives no indication that SN Ia standardized luminosities change significantly with redshift. A larger sample of distant SNe Ia is required to determine if SN Ia population characteristics at high-
�
truly diverge from their low-
�
counterparts, and to confirm that standardized luminosities nevertheless remain constant with redshift.
Evidence of Jet Activity from the Secondary Black Hole in the OJ 287 Binary S...Sérgio Sacani
Wereport the study of a huge optical intraday flare on 2021 November 12 at 2 a.m. UT in the blazar OJ287. In the binary black hole model, it is associated with an impact of the secondary black hole on the accretion disk of the primary. Our multifrequency observing campaign was set up to search for such a signature of the impact based on a prediction made 8 yr earlier. The first I-band results of the flare have already been reported by Kishore et al. (2024). Here we combine these data with our monitoring in the R-band. There is a big change in the R–I spectral index by 1.0 ±0.1 between the normal background and the flare, suggesting a new component of radiation. The polarization variation during the rise of the flare suggests the same. The limits on the source size place it most reasonably in the jet of the secondary BH. We then ask why we have not seen this phenomenon before. We show that OJ287 was never before observed with sufficient sensitivity on the night when the flare should have happened according to the binary model. We also study the probability that this flare is just an oversized example of intraday variability using the Krakow data set of intense monitoring between 2015 and 2023. We find that the occurrence of a flare of this size and rapidity is unlikely. In machine-readable Tables 1 and 2, we give the full orbit-linked historical light curve of OJ287 as well as the dense monitoring sample of Krakow.
Candidate young stellar objects in the S-cluster: Kinematic analysis of a sub...Sérgio Sacani
Context. The observation of several L-band emission sources in the S cluster has led to a rich discussion of their nature. However, a definitive answer to the classification of the dusty objects requires an explanation for the detection of compact Doppler-shifted Brγ emission. The ionized hydrogen in combination with the observation of mid-infrared L-band continuum emission suggests that most of these sources are embedded in a dusty envelope. These embedded sources are part of the S-cluster, and their relationship to the S-stars is still under debate. To date, the question of the origin of these two populations has been vague, although all explanations favor migration processes for the individual cluster members. Aims. This work revisits the S-cluster and its dusty members orbiting the supermassive black hole SgrA* on bound Keplerian orbits from a kinematic perspective. The aim is to explore the Keplerian parameters for patterns that might imply a nonrandom distribution of the sample. Additionally, various analytical aspects are considered to address the nature of the dusty sources. Methods. Based on the photometric analysis, we estimated the individual H−K and K−L colors for the source sample and compared the results to known cluster members. The classification revealed a noticeable contrast between the S-stars and the dusty sources. To fit the flux-density distribution, we utilized the radiative transfer code HYPERION and implemented a young stellar object Class I model. We obtained the position angle from the Keplerian fit results; additionally, we analyzed the distribution of the inclinations and the longitudes of the ascending node. Results. The colors of the dusty sources suggest a stellar nature consistent with the spectral energy distribution in the near and midinfrared domains. Furthermore, the evaporation timescales of dusty and gaseous clumps in the vicinity of SgrA* are much shorter ( 2yr) than the epochs covered by the observations (≈15yr). In addition to the strong evidence for the stellar classification of the D-sources, we also find a clear disk-like pattern following the arrangements of S-stars proposed in the literature. Furthermore, we find a global intrinsic inclination for all dusty sources of 60 ± 20◦, implying a common formation process. Conclusions. The pattern of the dusty sources manifested in the distribution of the position angles, inclinations, and longitudes of the ascending node strongly suggests two different scenarios: the main-sequence stars and the dusty stellar S-cluster sources share a common formation history or migrated with a similar formation channel in the vicinity of SgrA*. Alternatively, the gravitational influence of SgrA* in combination with a massive perturber, such as a putative intermediate mass black hole in the IRS 13 cluster, forces the dusty objects and S-stars to follow a particular orbital arrangement. Key words. stars: black holes– stars: formation– Galaxy: center– galaxies: star formation
JAMES WEBB STUDY THE MASSIVE BLACK HOLE SEEDSSérgio Sacani
The pathway(s) to seeding the massive black holes (MBHs) that exist at the heart of galaxies in the present and distant Universe remains an unsolved problem. Here we categorise, describe and quantitatively discuss the formation pathways of both light and heavy seeds. We emphasise that the most recent computational models suggest that rather than a bimodal-like mass spectrum between light and heavy seeds with light at one end and heavy at the other that instead a continuum exists. Light seeds being more ubiquitous and the heavier seeds becoming less and less abundant due the rarer environmental conditions required for their formation. We therefore examine the different mechanisms that give rise to different seed mass spectrums. We show how and why the mechanisms that produce the heaviest seeds are also among the rarest events in the Universe and are hence extremely unlikely to be the seeds for the vast majority of the MBH population. We quantify, within the limits of the current large uncertainties in the seeding processes, the expected number densities of the seed mass spectrum. We argue that light seeds must be at least 103 to 105 times more numerous than heavy seeds to explain the MBH population as a whole. Based on our current understanding of the seed population this makes heavy seeds (Mseed > 103 M⊙) a significantly more likely pathway given that heavy seeds have an abundance pattern than is close to and likely in excess of 10−4 compared to light seeds. Finally, we examine the current state-of-the-art in numerical calculations and recent observations and plot a path forward for near-future advances in both domains.
Anti-Universe And Emergent Gravity and the Dark UniverseSérgio Sacani
Recent theoretical progress indicates that spacetime and gravity emerge together from the entanglement structure of an underlying microscopic theory. These ideas are best understood in Anti-de Sitter space, where they rely on the area law for entanglement entropy. The extension to de Sitter space requires taking into account the entropy and temperature associated with the cosmological horizon. Using insights from string theory, black hole physics and quantum information theory we argue that the positive dark energy leads to a thermal volume law contribution to the entropy that overtakes the area law precisely at the cosmological horizon. Due to the competition between area and volume law entanglement the microscopic de Sitter states do not thermalise at sub-Hubble scales: they exhibit memory effects in the form of an entropy displacement caused by matter. The emergent laws of gravity contain an additional ‘dark’ gravitational force describing the ‘elastic’ response due to the entropy displacement. We derive an estimate of the strength of this extra force in terms of the baryonic mass, Newton’s constant and the Hubble acceleration scale a0 = cH0, and provide evidence for the fact that this additional ‘dark gravity force’ explains the observed phenomena in galaxies and clusters currently attributed to dark matter.
The binding of cosmological structures by massless topological defectsSérgio Sacani
Assuming spherical symmetry and weak field, it is shown that if one solves the Poisson equation or the Einstein field
equations sourced by a topological defect, i.e. a singularity of a very specific form, the result is a localized gravitational
field capable of driving flat rotation (i.e. Keplerian circular orbits at a constant speed for all radii) of test masses on a thin
spherical shell without any underlying mass. Moreover, a large-scale structure which exploits this solution by assembling
concentrically a number of such topological defects can establish a flat stellar or galactic rotation curve, and can also deflect
light in the same manner as an equipotential (isothermal) sphere. Thus, the need for dark matter or modified gravity theory is
mitigated, at least in part.
EWOCS-I: The catalog of X-ray sources in Westerlund 1 from the Extended Weste...Sérgio Sacani
Context. With a mass exceeding several 104 M⊙ and a rich and dense population of massive stars, supermassive young star clusters
represent the most massive star-forming environment that is dominated by the feedback from massive stars and gravitational interactions
among stars.
Aims. In this paper we present the Extended Westerlund 1 and 2 Open Clusters Survey (EWOCS) project, which aims to investigate
the influence of the starburst environment on the formation of stars and planets, and on the evolution of both low and high mass stars.
The primary targets of this project are Westerlund 1 and 2, the closest supermassive star clusters to the Sun.
Methods. The project is based primarily on recent observations conducted with the Chandra and JWST observatories. Specifically,
the Chandra survey of Westerlund 1 consists of 36 new ACIS-I observations, nearly co-pointed, for a total exposure time of 1 Msec.
Additionally, we included 8 archival Chandra/ACIS-S observations. This paper presents the resulting catalog of X-ray sources within
and around Westerlund 1. Sources were detected by combining various existing methods, and photon extraction and source validation
were carried out using the ACIS-Extract software.
Results. The EWOCS X-ray catalog comprises 5963 validated sources out of the 9420 initially provided to ACIS-Extract, reaching a
photon flux threshold of approximately 2 × 10⁻⁸ photons cm−2
s
−1
. The X-ray sources exhibit a highly concentrated spatial distribution,
with 1075 sources located within the central 1 arcmin. We have successfully detected X-ray emissions from 126 out of the 166 known
massive stars of the cluster, and we have collected over 71 000 photons from the magnetar CXO J164710.20-455217.
The debris of the ‘last major merger’ is dynamically youngSérgio Sacani
The Milky Way’s (MW) inner stellar halo contains an [Fe/H]-rich component with highly eccentric orbits, often referred to as the
‘last major merger.’ Hypotheses for the origin of this component include Gaia-Sausage/Enceladus (GSE), where the progenitor
collided with the MW proto-disc 8–11 Gyr ago, and the Virgo Radial Merger (VRM), where the progenitor collided with the
MW disc within the last 3 Gyr. These two scenarios make different predictions about observable structure in local phase space,
because the morphology of debris depends on how long it has had to phase mix. The recently identified phase-space folds in Gaia
DR3 have positive caustic velocities, making them fundamentally different than the phase-mixed chevrons found in simulations
at late times. Roughly 20 per cent of the stars in the prograde local stellar halo are associated with the observed caustics. Based
on a simple phase-mixing model, the observed number of caustics are consistent with a merger that occurred 1–2 Gyr ago.
We also compare the observed phase-space distribution to FIRE-2 Latte simulations of GSE-like mergers, using a quantitative
measurement of phase mixing (2D causticality). The observed local phase-space distribution best matches the simulated data
1–2 Gyr after collision, and certainly not later than 3 Gyr. This is further evidence that the progenitor of the ‘last major merger’
did not collide with the MW proto-disc at early times, as is thought for the GSE, but instead collided with the MW disc within
the last few Gyr, consistent with the body of work surrounding the VRM.
Observation of Io’s Resurfacing via Plume Deposition Using Ground-based Adapt...Sérgio Sacani
Since volcanic activity was first discovered on Io from Voyager images in 1979, changes
on Io’s surface have been monitored from both spacecraft and ground-based telescopes.
Here, we present the highest spatial resolution images of Io ever obtained from a groundbased telescope. These images, acquired by the SHARK-VIS instrument on the Large
Binocular Telescope, show evidence of a major resurfacing event on Io’s trailing hemisphere. When compared to the most recent spacecraft images, the SHARK-VIS images
show that a plume deposit from a powerful eruption at Pillan Patera has covered part
of the long-lived Pele plume deposit. Although this type of resurfacing event may be common on Io, few have been detected due to the rarity of spacecraft visits and the previously low spatial resolution available from Earth-based telescopes. The SHARK-VIS instrument ushers in a new era of high resolution imaging of Io’s surface using adaptive
optics at visible wavelengths.
Earliest Galaxies in the JADES Origins Field: Luminosity Function and Cosmic ...Sérgio Sacani
We characterize the earliest galaxy population in the JADES Origins Field (JOF), the deepest
imaging field observed with JWST. We make use of the ancillary Hubble optical images (5 filters
spanning 0.4−0.9µm) and novel JWST images with 14 filters spanning 0.8−5µm, including 7 mediumband filters, and reaching total exposure times of up to 46 hours per filter. We combine all our data
at > 2.3µm to construct an ultradeep image, reaching as deep as ≈ 31.4 AB mag in the stack and
30.3-31.0 AB mag (5σ, r = 0.1” circular aperture) in individual filters. We measure photometric
redshifts and use robust selection criteria to identify a sample of eight galaxy candidates at redshifts
z = 11.5 − 15. These objects show compact half-light radii of R1/2 ∼ 50 − 200pc, stellar masses of
M⋆ ∼ 107−108M⊙, and star-formation rates of SFR ∼ 0.1−1 M⊙ yr−1
. Our search finds no candidates
at 15 < z < 20, placing upper limits at these redshifts. We develop a forward modeling approach to
infer the properties of the evolving luminosity function without binning in redshift or luminosity that
marginalizes over the photometric redshift uncertainty of our candidate galaxies and incorporates the
impact of non-detections. We find a z = 12 luminosity function in good agreement with prior results,
and that the luminosity function normalization and UV luminosity density decline by a factor of ∼ 2.5
from z = 12 to z = 14. We discuss the possible implications of our results in the context of theoretical
models for evolution of the dark matter halo mass function.
THE IMPORTANCE OF MARTIAN ATMOSPHERE SAMPLE RETURN.Sérgio Sacani
The return of a sample of near-surface atmosphere from Mars would facilitate answers to several first-order science questions surrounding the formation and evolution of the planet. One of the important aspects of terrestrial planet formation in general is the role that primary atmospheres played in influencing the chemistry and structure of the planets and their antecedents. Studies of the martian atmosphere can be used to investigate the role of a primary atmosphere in its history. Atmosphere samples would also inform our understanding of the near-surface chemistry of the planet, and ultimately the prospects for life. High-precision isotopic analyses of constituent gases are needed to address these questions, requiring that the analyses are made on returned samples rather than in situ.
Multi-source connectivity as the driver of solar wind variability in the heli...Sérgio Sacani
The ambient solar wind that flls the heliosphere originates from multiple
sources in the solar corona and is highly structured. It is often described
as high-speed, relatively homogeneous, plasma streams from coronal
holes and slow-speed, highly variable, streams whose source regions are
under debate. A key goal of ESA/NASA’s Solar Orbiter mission is to identify
solar wind sources and understand what drives the complexity seen in the
heliosphere. By combining magnetic feld modelling and spectroscopic
techniques with high-resolution observations and measurements, we show
that the solar wind variability detected in situ by Solar Orbiter in March
2022 is driven by spatio-temporal changes in the magnetic connectivity to
multiple sources in the solar atmosphere. The magnetic feld footpoints
connected to the spacecraft moved from the boundaries of a coronal hole
to one active region (12961) and then across to another region (12957). This
is refected in the in situ measurements, which show the transition from fast
to highly Alfvénic then to slow solar wind that is disrupted by the arrival of
a coronal mass ejection. Our results describe solar wind variability at 0.5 au
but are applicable to near-Earth observatories.
Gliese 12 b: A Temperate Earth-sized Planet at 12 pc Ideal for Atmospheric Tr...Sérgio Sacani
Recent discoveries of Earth-sized planets transiting nearby M dwarfs have made it possible to characterize the
atmospheres of terrestrial planets via follow-up spectroscopic observations. However, the number of such planets
receiving low insolation is still small, limiting our ability to understand the diversity of the atmospheric
composition and climates of temperate terrestrial planets. We report the discovery of an Earth-sized planet
transiting the nearby (12 pc) inactive M3.0 dwarf Gliese 12 (TOI-6251) with an orbital period (Porb) of 12.76 days.
The planet, Gliese 12 b, was initially identified as a candidate with an ambiguous Porb from TESS data. We
confirmed the transit signal and Porb using ground-based photometry with MuSCAT2 and MuSCAT3, and
validated the planetary nature of the signal using high-resolution images from Gemini/NIRI and Keck/NIRC2 as
well as radial velocity (RV) measurements from the InfraRed Doppler instrument on the Subaru 8.2 m telescope
and from CARMENES on the CAHA 3.5 m telescope. X-ray observations with XMM-Newton showed the host
star is inactive, with an X-ray-to-bolometric luminosity ratio of log 5.7 L L X bol » - . Joint analysis of the light
curves and RV measurements revealed that Gliese 12 b has a radius of 0.96 ± 0.05 R⊕,a3σ mass upper limit of
3.9 M⊕, and an equilibrium temperature of 315 ± 6 K assuming zero albedo. The transmission spectroscopy metric
(TSM) value of Gliese 12 b is close to the TSM values of the TRAPPIST-1 planets, adding Gliese 12 b to the small
list of potentially terrestrial, temperate planets amenable to atmospheric characterization with JWST.
Gliese 12 b, a temperate Earth-sized planet at 12 parsecs discovered with TES...Sérgio Sacani
We report on the discovery of Gliese 12 b, the nearest transiting temperate, Earth-sized planet found to date. Gliese 12 is a
bright (V = 12.6 mag, K = 7.8 mag) metal-poor M4V star only 12.162 ± 0.005 pc away from the Solar system with one of the
lowest stellar activity levels known for M-dwarfs. A planet candidate was detected by TESS based on only 3 transits in sectors
42, 43, and 57, with an ambiguity in the orbital period due to observational gaps. We performed follow-up transit observations
with CHEOPS and ground-based photometry with MINERVA-Australis, SPECULOOS, and Purple Mountain Observatory,
as well as further TESS observations in sector 70. We statistically validate Gliese 12 b as a planet with an orbital period of
12.76144 ± 0.00006 d and a radius of 1.0 ± 0.1 R⊕, resulting in an equilibrium temperature of ∼315 K. Gliese 12 b has excellent
future prospects for precise mass measurement, which may inform how planetary internal structure is affected by the stellar
compositional environment. Gliese 12 b also represents one of the best targets to study whether Earth-like planets orbiting cool
stars can retain their atmospheres, a crucial step to advance our understanding of habitability on Earth and across the galaxy.
The importance of continents, oceans and plate tectonics for the evolution of...Sérgio Sacani
Within the uncertainties of involved astronomical and biological parameters, the Drake Equation
typically predicts that there should be many exoplanets in our galaxy hosting active, communicative
civilizations (ACCs). These optimistic calculations are however not supported by evidence, which is
often referred to as the Fermi Paradox. Here, we elaborate on this long-standing enigma by showing
the importance of planetary tectonic style for biological evolution. We summarize growing evidence
that a prolonged transition from Mesoproterozoic active single lid tectonics (1.6 to 1.0 Ga) to modern
plate tectonics occurred in the Neoproterozoic Era (1.0 to 0.541 Ga), which dramatically accelerated
emergence and evolution of complex species. We further suggest that both continents and oceans
are required for ACCs because early evolution of simple life must happen in water but late evolution
of advanced life capable of creating technology must happen on land. We resolve the Fermi Paradox
(1) by adding two additional terms to the Drake Equation: foc
(the fraction of habitable exoplanets
with significant continents and oceans) and fpt
(the fraction of habitable exoplanets with significant
continents and oceans that have had plate tectonics operating for at least 0.5 Ga); and (2) by
demonstrating that the product of foc
and fpt
is very small (< 0.00003–0.002). We propose that the lack
of evidence for ACCs reflects the scarcity of long-lived plate tectonics and/or continents and oceans on
exoplanets with primitive life.
A Giant Impact Origin for the First Subduction on EarthSérgio Sacani
Hadean zircons provide a potential record of Earth's earliest subduction 4.3 billion years ago. Itremains enigmatic how subduction could be initiated so soon after the presumably Moon‐forming giant impact(MGI). Earlier studies found an increase in Earth's core‐mantle boundary (CMB) temperature due to theaccumulation of the impactor's core, and our recent work shows Earth's lower mantle remains largely solid, withsome of the impactor's mantle potentially surviving as the large low‐shear velocity provinces (LLSVPs). Here,we show that a hot post‐impact CMB drives the initiation of strong mantle plumes that can induce subductioninitiation ∼200 Myr after the MGI. 2D and 3D thermomechanical computations show that a high CMBtemperature is the primary factor triggering early subduction, with enrichment of heat‐producing elements inLLSVPs as another potential factor. The models link the earliest subduction to the MGI with implications forunderstanding the diverse tectonic regimes of rocky planets.
Climate extremes likely to drive land mammal extinction during next supercont...Sérgio Sacani
Mammals have dominated Earth for approximately 55 Myr thanks to their
adaptations and resilience to warming and cooling during the Cenozoic. All
life will eventually perish in a runaway greenhouse once absorbed solar
radiation exceeds the emission of thermal radiation in several billions of
years. However, conditions rendering the Earth naturally inhospitable to
mammals may develop sooner because of long-term processes linked to
plate tectonics (short-term perturbations are not considered here). In
~250 Myr, all continents will converge to form Earth’s next supercontinent,
Pangea Ultima. A natural consequence of the creation and decay of Pangea
Ultima will be extremes in pCO2 due to changes in volcanic rifting and
outgassing. Here we show that increased pCO2, solar energy (F⨀;
approximately +2.5% W m−2 greater than today) and continentality (larger
range in temperatures away from the ocean) lead to increasing warming
hostile to mammalian life. We assess their impact on mammalian
physiological limits (dry bulb, wet bulb and Humidex heat stress indicators)
as well as a planetary habitability index. Given mammals’ continued survival,
predicted background pCO2 levels of 410–816 ppm combined with increased
F⨀ will probably lead to a climate tipping point and their mass extinction.
The results also highlight how global landmass configuration, pCO2 and F⨀
play a critical role in planetary habitability.
How information systems are built or acquired puts information, which is what they should be about, in a secondary place. Our language adapted accordingly, and we no longer talk about information systems but applications. Applications evolved in a way to break data into diverse fragments, tightly coupled with applications and expensive to integrate. The result is technical debt, which is re-paid by taking even bigger "loans", resulting in an ever-increasing technical debt. Software engineering and procurement practices work in sync with market forces to maintain this trend. This talk demonstrates how natural this situation is. The question is: can something be done to reverse the trend?
inQuba Webinar Mastering Customer Journey Management with Dr Graham HillLizaNolte
HERE IS YOUR WEBINAR CONTENT! 'Mastering Customer Journey Management with Dr. Graham Hill'. We hope you find the webinar recording both insightful and enjoyable.
In this webinar, we explored essential aspects of Customer Journey Management and personalization. Here’s a summary of the key insights and topics discussed:
Key Takeaways:
Understanding the Customer Journey: Dr. Hill emphasized the importance of mapping and understanding the complete customer journey to identify touchpoints and opportunities for improvement.
Personalization Strategies: We discussed how to leverage data and insights to create personalized experiences that resonate with customers.
Technology Integration: Insights were shared on how inQuba’s advanced technology can streamline customer interactions and drive operational efficiency.
Discover top-tier mobile app development services, offering innovative solutions for iOS and Android. Enhance your business with custom, user-friendly mobile applications.
Introduction of Cybersecurity with OSS at Code Europe 2024Hiroshi SHIBATA
I develop the Ruby programming language, RubyGems, and Bundler, which are package managers for Ruby. Today, I will introduce how to enhance the security of your application using open-source software (OSS) examples from Ruby and RubyGems.
The first topic is CVE (Common Vulnerabilities and Exposures). I have published CVEs many times. But what exactly is a CVE? I'll provide a basic understanding of CVEs and explain how to detect and handle vulnerabilities in OSS.
Next, let's discuss package managers. Package managers play a critical role in the OSS ecosystem. I'll explain how to manage library dependencies in your application.
I'll share insights into how the Ruby and RubyGems core team works to keep our ecosystem safe. By the end of this talk, you'll have a better understanding of how to safeguard your code.
"Frontline Battles with DDoS: Best practices and Lessons Learned", Igor IvaniukFwdays
At this talk we will discuss DDoS protection tools and best practices, discuss network architectures and what AWS has to offer. Also, we will look into one of the largest DDoS attacks on Ukrainian infrastructure that happened in February 2022. We'll see, what techniques helped to keep the web resources available for Ukrainians and how AWS improved DDoS protection for all customers based on Ukraine experience
Have you ever been confused by the myriad of choices offered by AWS for hosting a website or an API?
Lambda, Elastic Beanstalk, Lightsail, Amplify, S3 (and more!) can each host websites + APIs. But which one should we choose?
Which one is cheapest? Which one is fastest? Which one will scale to meet our needs?
Join me in this session as we dive into each AWS hosting service to determine which one is best for your scenario and explain why!
The Microsoft 365 Migration Tutorial For Beginner.pptxoperationspcvita
This presentation will help you understand the power of Microsoft 365. However, we have mentioned every productivity app included in Office 365. Additionally, we have suggested the migration situation related to Office 365 and how we can help you.
You can also read: https://www.systoolsgroup.com/updates/office-365-tenant-to-tenant-migration-step-by-step-complete-guide/
High performance Serverless Java on AWS- GoTo Amsterdam 2024Vadym Kazulkin
Java is for many years one of the most popular programming languages, but it used to have hard times in the Serverless community. Java is known for its high cold start times and high memory footprint, comparing to other programming languages like Node.js and Python. In this talk I'll look at the general best practices and techniques we can use to decrease memory consumption, cold start times for Java Serverless development on AWS including GraalVM (Native Image) and AWS own offering SnapStart based on Firecracker microVM snapshot and restore and CRaC (Coordinated Restore at Checkpoint) runtime hooks. I'll also provide a lot of benchmarking on Lambda functions trying out various deployment package sizes, Lambda memory settings, Java compilation options and HTTP (a)synchronous clients and measure their impact on cold and warm start times.
Northern Engraving | Modern Metal Trim, Nameplates and Appliance PanelsNorthern Engraving
What began over 115 years ago as a supplier of precision gauges to the automotive industry has evolved into being an industry leader in the manufacture of product branding, automotive cockpit trim and decorative appliance trim. Value-added services include in-house Design, Engineering, Program Management, Test Lab and Tool Shops.
This talk will cover ScyllaDB Architecture from the cluster-level view and zoom in on data distribution and internal node architecture. In the process, we will learn the secret sauce used to get ScyllaDB's high availability and superior performance. We will also touch on the upcoming changes to ScyllaDB architecture, moving to strongly consistent metadata and tablets.
Connector Corner: Seamlessly power UiPath Apps, GenAI with prebuilt connectorsDianaGray10
Join us to learn how UiPath Apps can directly and easily interact with prebuilt connectors via Integration Service--including Salesforce, ServiceNow, Open GenAI, and more.
The best part is you can achieve this without building a custom workflow! Say goodbye to the hassle of using separate automations to call APIs. By seamlessly integrating within App Studio, you can now easily streamline your workflow, while gaining direct access to our Connector Catalog of popular applications.
We’ll discuss and demo the benefits of UiPath Apps and connectors including:
Creating a compelling user experience for any software, without the limitations of APIs.
Accelerating the app creation process, saving time and effort
Enjoying high-performance CRUD (create, read, update, delete) operations, for
seamless data management.
Speakers:
Russell Alfeche, Technology Leader, RPA at qBotic and UiPath MVP
Charlie Greenberg, host
The Department of Veteran Affairs (VA) invited Taylor Paschal, Knowledge & Information Management Consultant at Enterprise Knowledge, to speak at a Knowledge Management Lunch and Learn hosted on June 12, 2024. All Office of Administration staff were invited to attend and received professional development credit for participating in the voluntary event.
The objectives of the Lunch and Learn presentation were to:
- Review what KM ‘is’ and ‘isn’t’
- Understand the value of KM and the benefits of engaging
- Define and reflect on your “what’s in it for me?”
- Share actionable ways you can participate in Knowledge - - Capture & Transfer
Dandelion Hashtable: beyond billion requests per second on a commodity serverAntonios Katsarakis
This slide deck presents DLHT, a concurrent in-memory hashtable. Despite efforts to optimize hashtables, that go as far as sacrificing core functionality, state-of-the-art designs still incur multiple memory accesses per request and block request processing in three cases. First, most hashtables block while waiting for data to be retrieved from memory. Second, open-addressing designs, which represent the current state-of-the-art, either cannot free index slots on deletes or must block all requests to do so. Third, index resizes block every request until all objects are copied to the new index. Defying folklore wisdom, DLHT forgoes open-addressing and adopts a fully-featured and memory-aware closed-addressing design based on bounded cache-line-chaining. This design offers lock-free index operations and deletes that free slots instantly, (2) completes most requests with a single memory access, (3) utilizes software prefetching to hide memory latencies, and (4) employs a novel non-blocking and parallel resizing. In a commodity server and a memory-resident workload, DLHT surpasses 1.6B requests per second and provides 3.5x (12x) the throughput of the state-of-the-art closed-addressing (open-addressing) resizable hashtable on Gets (Deletes).
[OReilly Superstream] Occupy the Space: A grassroots guide to engineering (an...Jason Yip
The typical problem in product engineering is not bad strategy, so much as “no strategy”. This leads to confusion, lack of motivation, and incoherent action. The next time you look for a strategy and find an empty space, instead of waiting for it to be filled, I will show you how to fill it in yourself. If you’re wrong, it forces a correction. If you’re right, it helps create focus. I’ll share how I’ve approached this in the past, both what works and lessons for what didn’t work so well.
Freshworks Rethinks NoSQL for Rapid Scaling & Cost-EfficiencyScyllaDB
Freshworks creates AI-boosted business software that helps employees work more efficiently and effectively. Managing data across multiple RDBMS and NoSQL databases was already a challenge at their current scale. To prepare for 10X growth, they knew it was time to rethink their database strategy. Learn how they architected a solution that would simplify scaling while keeping costs under control.
Northern Engraving | Nameplate Manufacturing Process - 2024Northern Engraving
Manufacturing custom quality metal nameplates and badges involves several standard operations. Processes include sheet prep, lithography, screening, coating, punch press and inspection. All decoration is completed in the flat sheet with adhesive and tooling operations following. The possibilities for creating unique durable nameplates are endless. How will you create your brand identity? We can help!
Northern Engraving | Nameplate Manufacturing Process - 2024
Le feuvre and_wieczorek_2011
1. Icarus 214 (2011) 1–20
Contents lists available at ScienceDirect
Icarus
journal homepage: www.elsevier.com/locate/icarus
Nonuniform cratering of the Moon and a revised crater chronology of the inner
Solar System
Mathieu Le Feuvre ⇑, Mark A. Wieczorek
Institut de Physique du Globe de Paris, Saint Maur des Fossés, France
a r t i c l e i n f o a b s t r a c t
Article history: We model the cratering of the Moon and terrestrial planets from the present knowledge of the orbital and
Received 18 August 2010 size distribution of asteroids and comets in the inner Solar System, in order to refine the crater chronol-
Revised 1 March 2011 ogy method. Impact occurrences, locations, velocities and incidence angles are calculated semi-analyti-
Accepted 7 March 2011
cally, and scaling laws are used to convert impactor sizes into crater sizes. Our approach is
Available online 31 March 2011
generalizable to other moons or planets. The lunar cratering rate varies with both latitude and longitude:
with respect to the global average, it is about 25% lower at (±65°N, 90°E) and larger by the same amount
Keywords:
at the apex of motion (0°N, 90°W) for the present Earth–Moon separation. The measured size-frequency
Cratering
Moon
distributions of lunar craters are reconciled with the observed population of near-Earth objects under the
Terrestrial planets assumption that craters smaller than a few kilometers in diameter form in a porous megaregolith. Vary-
Impact processes ing depths of this megaregolith between the mare and highlands is a plausible partial explanation for dif-
ferences in previously reported measured size-frequency distributions. We give a revised analytical
relationship between the number of craters and the age of a lunar surface. For the inner planets, expected
size-frequency crater distributions are calculated that account for differences in impact conditions, and
the age of a few key geologic units is given. We estimate the Orientale and Caloris basins to be 3.73 Ga
old, and the surface of Venus to be 240 Ma old. The terrestrial cratering record is consistent with the
revised chronology and a constant impact rate over the last 400 Ma. Better knowledge of the orbital
dynamics, crater scaling laws and megaregolith properties are needed to confidently assess the net
uncertainty of the model ages that result from the combination of numerous steps, from the observation
of asteroids to the formation of craters. Our model may be inaccurate for periods prior to 3.5 Ga because
of a different impactor population, or for craters smaller than a few kilometers on Mars and Mercury, due
to the presence of subsurface ice and to the abundance of large secondaries, respectively. Standard
parameter values allow for the first time to naturally reproduce both the size distribution and absolute
number of lunar craters up to 3.5 Ga ago, and give self-consistent estimates of the planetary cratering
rates relative to the Moon.
Ó 2011 Elsevier Inc. All rights reserved.
1. Introduction 2001a; Stöffler and Ryder, 2001, and references therein). For statis-
tical robustness, craters are generally counted within a number of
The counting of impact craters offers a simple method to esti- consecutive diameter ranges, allowing one to recognize certain
mate the ages of geologic units on planetary surfaces when biases, such as erosion, resurfacing or crater saturation processes.
in situ rock samples are lacking. The crater chronology method is Measurements over various geologic units has led to the postulate
based on the simple idea that old surfaces have accumulated more that the relative shape of the size-frequency distributions (SFD) of
impact craters than more recent ones (Baldwin, 1949). The rela- lunar impact craters was similar for all surfaces, but unfortunately,
tionship between geologic age and number of lunar craters, based the exact shape of this production function in the 2–20 km range is
on the radiometric dating of existing lunar rock samples, is found still debated after decades of study. The total predicted size-fre-
to be approximately linear from the present to about 3 Ga ago, quency distribution for any given time is obtained by multiplying
and approximately exponential beyond that time (Neukum et al., the production function, assumed independent of age, by a time-
variable constant. The age of a geologic unit is estimated by finding
the best fit between the standardized and measured distributions.
⇑ Corresponding author. Present address: Laboratoire de Planétologie et Géody- The approach taken in this work models directly crater distribu-
namique, Université de Nantes, France. tions from the current knowledge of the impactor population. This
E-mail address: mathieu.lefeuvre@univ-nantes.fr (M. Le Feuvre). allows us to infer properties of the impact history of a planetary
0019-1035/$ - see front matter Ó 2011 Elsevier Inc. All rights reserved.
doi:10.1016/j.icarus.2011.03.010
2. 2 M. Le Feuvre, M.A. Wieczorek / Icarus 214 (2011) 1–20
body that the sole observation of craters could not reveal. In partic- orek, 2008), whereas longitudinal asymmetries result from syn-
ular, whereas the crater chronology method assumes that craters chronous rotation since the relative encounter velocity, hence
accumulate uniformly on the surface of the planetary body, this impact rate, are maximized at the apex of motion (e.g., Morota
method allows to quantify possible spatial variations in the impact et al., 2005). In addition, the Earth may focus low inclination and
rate. Moreover, in the absence of dated samples with known geo- velocity projectiles onto the nearside of the satellite or act as a
logical context from Mercury, Venus and Mars, the generalization shield at small separation distances.
of the crater chronology to these planets requires an estimate of Several studies have attempted to give estimates of the lunar
the relative cratering rates with respect to the Moon: in the same cratering asymmetries. Wiesel (1971) used a simplified asteroid
period of time, the number of craters of a given size that form on population, and Bandermann and Singer (1973) used analytical for-
two planets differ according to both the different impact probabil- mulations based on strongly simplifying assumptions in order to
ities of the planet-crossing objects and the impact conditions (e.g., calculate impact locations on a planet. These formulations did
impact velocity, surface gravity). not allow to investigate any latitudinal effects. Wood (1973)
Using this bottom-up approach, Neukum et al. (2001b) pro- numerically integrated the trajectories of ecliptic projectiles; Pinet
posed age estimates of mercurian geologic features based on a (1985) numerically studied the asymmetries caused by geocentric
Mercury/Moon cratering rate ratio estimated from telescopic projectiles that were potentially present early in the lunar history.
observations. Similarly, Hartmann and Neukum (2001) adapted Horedt and Neukum (1984), Shoemaker and Wolfe (1982), Zahnle
the lunar cratering chronology to Mars, using the Mars/Moon cra- et al. (1998) and Zahnle et al. (2001) all proposed analytical formu-
tering rate ratio of Ivanov (2001). The venusian surface, which lations for the apex/antapex effect, but the range of predicted
contains a small number of craters that appear to be randomly amplitudes is very large (the first, in particular, claimed that this
distributed, has been the subject of several attempts of dating. effect is negligible for the Moon). Moreover, these four studies
The most recent estimates can be found in Korycansky and Zahnle based their results on isotropic encounter inclinations. Gallant
(2005) and McKinnon et al. (1997), and are both based on the et al. (2009) numerically modeled projectile trajectories in the
population of Venus crossers as estimated by Shoemaker et al. Sun–Earth–Moon system, and reported a significant apex/antapex
(1990). In this study, we use improved estimates of the orbital effect. In our study, we derive a semi-analytic approach for calcu-
characteristics and size-frequency distribution of the impactor lating cratering rates of synchronously locked satellites, and apply
population. it to the Moon. This method yields results that are nearly identical
The early lunar cratering record indicates that impactors were to full numerical simulations, is computationally very rapid, and
hundred of times more numerous than today, possibly due to the easily generalizable to other satellites.
massive injection in the inner system of main-belt and/or Kuiper- The ‘‘asteroid to crater’’ modeling requires several steps to cre-
belt objects about 700 Ma after the Moon formed, an event ate synthetic crater distributions. First, one needs to know the
known as the Late Heavy Bombardment (LHB) (see Gomes impactor population as a function of orbital elements, size and
et al., 2005; Tera et al., 1974; Hartmann et al., 2000). More than time. Second, impact probabilities are calculated over precession
3 Ga ago, the impactor population appears to have reached a rel- and revolution cycles of both the projectile and target, based on
ative state of equilibrium, being replenished both in size and orbit geometrical considerations (Öpik, 1951; Wetherill, 1967; Green-
by, respectively, collisions inside the main asteroid belt and the berg, 1982; Bottke and Greenberg, 1993). As these impact probabil-
ejection by resonances with the giant planets (Bottke et al., ities predict typically that a given planetary crosser will collide
2002). Under the assumption of a steady-state distribution of with a given planet over timescales of about 10 Ga, whereas the
impactors, the distribution of craters on $3 Ga old surfaces typical lifetime of these objects is thought to be a thousand times
should be consistent with the present astronomically inferred lower (Michel et al., 2005) as a result of ejection from the Solar Sys-
cratering rates. tem or collision with another body, the calculated bombardment
The lunar cratering record, in the form of the standardized pro- must be seen as the product of a steady-state population, where
duction functions, agrees reasonably well with telescopic observa- vacant orbital niches are continuously reoccupied (Ivanov et al.,
tions of planet-crossing objects down to a few kilometers in 2007). Third, scaling laws derived from laboratory experiments
diameter (Stuart, 2003; Werner et al., 2002). Smaller craters appear and dimensional analyses are used to calculate the final crater size
to be not numerous enough to have been formed by an impacting produced for given a impact condition (e.g., impactor size, velocity
population similar to the present one. But, in Ivanov et al. (2007), it and cohesion of the target material), for which several different
was suggested that the presence of a porous lunar megaregolith scaling laws have been proposed (Schmidt and Housen, 1987;
may reduce the predicted size of small craters, accounting for this Holsapple and Schmidt, 1987; Gault, 1974; Holsapple, 1993; Hols-
observation. In Strom et al. (2005), the distinction was made be- apple and Housen, 2007). Subsequent gravitational modification of
tween pre- and post-LHB lunar crater distributions. Older distribu- the transient cavity that gives rise to the final crater size have been
tions, depleted in small craters, would reflect the SFD of Main Belt deduced from crater morphological studies (Pike, 1980; Croft,
asteroids – massively provided by the LHB – rather than the SFD of 1985).
near-Earth asteroids. Marchi et al. (2009) revised the crater chro- The rest of this paper is organized as follows. In the following
nology method by deriving a new production function from impact section, we describe the employed orbital and size distribution of
modeling that differs significantly from those based on measure- the impactor population. In Section 3, the necessary equations
ments. In this study, we attempt to fully reconcile the measured lu- used in generating synthetic cratering rates are summarized; the
nar production functions with the telescopic observations of full derivations are given in the appendix. In Section 4, we compare
planet-crossing objects. our synthetic lunar crater distribution with observations, we
Modeling the impact bombardment also allows us to quantify describe the lunar spatial asymmetries, and give the predicted pla-
spatial cratering asymmetries that are not accounted for in the tra- net/Moon cratering ratios. We also provide simple analytic equa-
ditional crater chronology method. The presence of such asymme- tions that reproduce the predicted cratering asymmetries on the
tries would bias the ages based on crater densities according to the Moon, as well as the latitudinal variations predicted for the terres-
location of the geologic unit. The Moon is subject to nonuniform trial planets in Le Feuvre and Wieczorek (2008). Section 5 is dedi-
cratering, since it is not massive enough to gravitationally homog- cated to revising the crater chronology method. New age estimates
enize encounter trajectories. Latitudinal asymmetries are produced are proposed for geologic units on the Moon, Earth, Venus and
by the anisotropy of encounter inclinations (Le Feuvre and Wiecz- Mercury.
3. M. Le Feuvre, M.A. Wieczorek / Icarus 214 (2011) 1–20 3
2. Impactor population 10 5
10 4
Let us denote a, e, i and d respectively the semi-major axis, 10 3
eccentricity, inclination and diameter of those objects whose orbits
Cumulative impact probability
10 2
can intersect the inner planets. The entire population can be
10 1
written
10 0
nð d; a; e; iÞ ¼ nð 1Þ Â oða; e; iÞ Â sð dÞ; ð1Þ 10 −1
10 −2
where n can be expressed as the product of nðd 1Þ, the total num-
ber of objects with a diameter greater than 1 km; o(a, e, i), the rela- 10 −3
tive number of objects with a given set of orbital elements, 10 −4
R
normalized so that oða; e; iÞ da de di ¼ 1; and s(d), the normal- 10 −5
ized cumulative number of objects larger than a given diameter, 10 −6
such that s(1 km) = 1. This formulation assumes that no correla- 10 −7
tions exist between the size of the object and its orbit, which is con- 10 −8
sistent with the observations of Stuart and Binzel (2004) for
10 −9
diameters ranging from $10 m to $10 km.
10−10
0.0001 0.001 0.01 0.1 1 10 100
2.1. Orbital distribution
diameter (km)
The orbital distribution of near-Earth objects (NEOs) is taken Fig. 1. Impact probability per year on Earth, for impactors larger than a given
from the model of Bottke et al. (2002), which provides a debiased diameter. Estimates come from atmospheric records or Öpik probabilities derived
estimate of the orbital distribution of bolides that can potentially from telescopic observations (black triangles: Halliday et al. (1996); black diamonds:
ReVelle (2001); gray triangles: Brown et al. (2002); gray squares and white triangles:
encounter the Earth–Moon system. This model assumes that the
Rabinowitz et al. (2000); gray circles: Harris (2002); white circles: Morbidelli et al.
NEO population is in steady-state, continuously replenished by (2002); black squares: Stuart and Binzel (2004)). Our compilation at large sizes is
the influx coming from source regions associated with the main augmented by including the observed size-frequency distribution of Mars-crossing
asteroid belt or the transneptunian disk. The model was deter- objects with sizes greater than 4 km, scaled to the terrestrial impact rates of Stuart
mined through extensive numerical integrations of test particles and Binzel (2004) (gray diamonds). The red curve is the best fit polynomial.
from these sources, and calibrated with the real population ob-
served by the Spacewatch survey. The relative number of objects a constant mean geometric albedo of 0.1 in order to convert their
is discretized in orbital cells that spans 0.25 AU in semi-major axis, telescopic observations from magnitude to diameter at all sizes.
0.1 in eccentricity, and 5° in inclination. Though small objects are expected to possess a larger albedo as
In order to model the martian impact flux, we have amended they are generally younger than large objects, we did not attempt
this model by including the known asteroids that cross the orbit to correct for this effect, since estimates of Rabinowitz et al. (2000)
of Mars, but which are not part of the NEO population. These are show a general agreement with other studies. In atmospheric flash
taken from the database provided by E. Bowell (Lowell Observa- estimates, masses have been deduced from kinetic energy, the lat-
tory), that gives the orbit and absolute magnitude H of telescopic ter being estimated from luminous energy. We convert kinetic
discoveries. We consider the population of H 15 objects to be energies of Brown et al. (2002) into diameters using a mean den-
the best compromise between a sufficient number of objects (in or- sity of 2700 kg mÀ3 and a mean impact velocity of 20 km sÀ1 (Stu-
der to avoid sparseness in the orbital space), and completeness. art and Binzel, 2004). In order to increase the range of sizes in our
Their distribution as a function of perihelion is very similar in compilation, and to reduce the statistical uncertainties associated
shape to brighter (hence larger) H 13 objects (see Le Feuvre and with the larger objects, we have also included the size-frequency
Wieczorek, 2008), the latter being large enough to ensure they distribution of Mars-crossing objects with sizes greater than
do not suffer observational bias in the martian neighborhood. 4 km, and scaled these to the terrestrial impact rates of Stuart
The H 15 population is therefore considered as complete, and is and Binzel (2004).
scaled to match the modeled NEO population. From the relation- Various assumptions have led to all these estimates. Among
ship between absolute magnitude and geometric albedo of Bowell them, the assumed impact velocity and bolide density are only of
et al. (1989), and a mean albedo of 0.13 (Stuart and Binzel, 2004), moderate influence. As an example, varying the density from
H 15 corresponds to d $4 km. 2700 to 2000 kg mÀ3, or the mean impact velocity from 20 to
17 km sÀ1, changes the estimates of Brown et al. (2002) only by
2.2. Size distribution about 10%. Of major influence are the luminous efficiency used
to obtain kinetic energy from flashes (see Ortiz et al., 2006), and
The size distribution of impactors is taken from a compilation of the debiasing process in the case of telescopic observations, which
various estimates of the size-dependent impact rate on Earth, as are difficult to assign a statistical uncertainty to. Consequently, we
shown in Fig. 1. This compilation gathers atmospheric recordings simply fit a 10th-order polynomial to the entire dataset, assuming
of meteoroids and impact probabilities calculated with Öpik each data is error free, and that the average combination of all esti-
equations from debiased telescopic observations. Estimates from mates gives a good picture of the impactor population.
telescopic observations are those of Rabinowitz et al. (2000), Mor- We express the resulting analytic size-frequency distribution as
bidelli et al. (2002), Harris (2002) and Stuart and Binzel (2004). the product of two terms: the normalized size distribution
P
Estimates based on atmospheric recordings include Halliday et al. log sð dÞ ¼ 10 si ðlog dkm Þi , whose coefficients are listed in Table
i¼0
(1996), ReVelle (2001) and Brown et al. (2002). Concerning the 1, and the Earth’s impact rate for objects larger than 1 km,
À2
LINEAR survey, estimates of Harris (2002) have been scaled at large /e ðd 1Þ ¼ 3:1 Â 10À6 GaÀ1 km . An overbar is appended to the
sizes to the estimates of Stuart and Binzel (2004). In contrast to Earth’s impact rate symbol, denoting that this quantity is spatially
Morbidelli et al. (2002) and Stuart and Binzel (2004), Rabinowitz averaged over the planet’s surface. The size-frequency distribution
et al. (2000) did not use a debiased albedo distribution, but rather of impactors is here assumed to be the same for all bodies in the
4. 4 M. Le Feuvre, M.A. Wieczorek / Icarus 214 (2011) 1–20
Table 1
P
Impactor size distribution: log sð dÞ ¼ 10 si ðlog dkm Þi .
i¼0
s0 s1 s2 s3 s4 s5
1.0 3.1656EÀ01 1.0393EÀ01 5.7091EÀ02 À8.1475EÀ02 À2.9864EÀ02
s6 s7 s8 s9 s10
1.3977EÀ02 5.8676EÀ03 À4.6476EÀ04 À3.8428EÀ04 À3.7825EÀ05
inner Solar System. The relative impact rates for these bodies with the encounter probability are avoided following Dones et al.
respect to Earth are calculated in Section 3 using the orbital distri- (1999). For a given orbital geometry, the encounter probability
bution of the planet crossing objects. is proportional to the gravitational cross section, whose radius
is
pffiffiffiffiffiffiffiffiffiffiffiffiffi
3. From asteroids to craters s ¼ R 1 þ C; ð2Þ
Here we describe how is calculated the number of craters where R is the target’s radius and
that form on the Moon and planets, per unit area and unit time, GM
as a function of the crater diameter and location on the surface. C¼2 ð3Þ
RU 2
We first need to calculate the encounter conditions generated by
the impactor population, then the corresponding impact rate and is the Safronov parameter, with G the gravitational constant and M
conditions (impact velocity and incidence angle), in order to fi- the target’s mass.
nally obtain a cratering rate by the use of impact crater scaling Note that the calculated impact probabilities are long-term
laws. For the reader’s convenience, derivations are given in the averages over precession cycles of both the projectile and target
appendix. (i.e., the longitude of node and argument of pericenter can take
any value between 0 and 2p). We account for secular variations
3.1. Encounter probability of the planetary orbital elements using the probability distribu-
tions given as a function of time in Laskar (2008). Our results are
Following Öpik (1951), the assumptions under which an only sensitive to secular variations for Mars, and in the following,
encounter is considered to occur can be summarized as follows: two values are quoted for this planet, that correspond to the pres-
ent day value and to a long-term average (1 Ga and 4 Ga averages
An encounter between the target (Moon or planet) and impac- yield nearly identical results).
tor occurs at the geometrical point of crossing of the two orbits By calculating the encounter probability P and velocity U asso-
(the mutual node). The geometry of encounter is given by the ciated with a given orbital element set (a, e, i), by weighting this
relative velocity vector U at this point, which is expressed here probability with the relative number of objects o(a, e, i), and by
in a frame where the X-axis points towards the central body summing over the entire planet-crossing population for each ter-
(planet or Sun), (XY) defines the target’s orbital plane, and the restrial planet, we build the probability distribution of the encoun-
Z-axis points upward. ter conditions, p(U), using bins of 1 km sÀ1 for each component of
The relative encounter velocity does not account for the acceler- the encounter velocity. Analytically, we have
ation generated by the mass of the target. p0 ðUÞ
The impactor, as seen by the target, is treated as if it were pðUÞ ¼ R ; ð4Þ
U
p0 ðUÞ dU
approaching from an infinite distance, under only the gravita-
tional influence of the target. The encounter trajectory is there- with
fore hyperbolic in the reference frame of the target. Z
For a given U, there are an infinite number of hyperbolic trajecto- p0 ðUÞ ¼ PðDÞoða; e; iÞdðUðDÞ À U0 Þ dD; ð5Þ
D
ries that can actually strike the target, that are distributed uni-
formly on a circle perpendicular to U with a surface equal to the where the integration is performed over the eight-dimensional
target’s gravitational cross section. domain
À Á
D ¼ U 0X ; U 0Y ; U 0Z ; a; e; i; w0 ; DX , with w0 the target’s argument of
These approximations hold as long as the radius of the tar- perihelion, DX the difference between the target and projectile’s
get’s Hill sphere is large enough with respect to the target size. longitudes of the ascending node (see Greenberg, 1982), and d
We performed three-body numerical simulations that show that the Kronecker function which equals 1 when U = U0 and 0 other-
a factor of ten between the Hill sphere and target radii suffices wise. The impact rate relative to the Earth is
to ensure the validity of the above approximations. For the ter-
R 0
p ðUÞdU
restrial planets, this condition is largely verified. For the Moon, it r¼RU 0 : ð6Þ
U
pe ðUÞ dU
corresponds to a minimum Earth–Moon separation of $17
Earth’s radii. where p0e is calculated from Eq. (5) with the Earth being the target.
In the case of planets in nearly circular orbits, the encounter The lunar case requires a specific treatment, which is detailed in
geometry U and probability P (providing the two orbits inter- Appendix A.2. For simplicity and without altering the results, it is
sect) are simply given by the well known Öpik equations assumed that the lunar orbit is circular about the Earth and possess
(Öpik, 1951). In order to account for the eccentricity of the tar- a zero inclination with respect to the ecliptic. We first calculate
get (which is important for Mercury and Mars, but not for the encounters probabilities P0 and velocities V with the entire
Earth), we use the improved formulation of Greenberg (1982) Earth–Moon system, whose expression is the same as for the Earth,
and Bottke and Greenberg (1993). The probability is largest except that the gravitational cross section radius is replaced in the
for low inclination encounters, and for encounters occurring Öpik equation by what we call here the lunar orbit cross section,
near the projectile’s pericenter and apocenter. Singularities of defined as Zahnle et al. (1998)
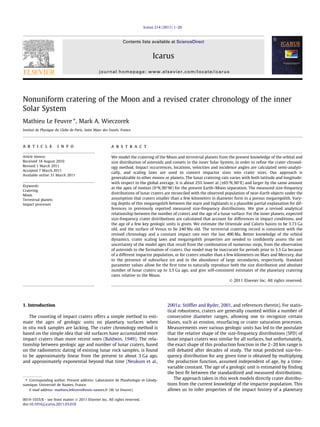
5. M. Le Feuvre, M.A. Wieczorek / Icarus 214 (2011) 1–20 5
sffiffiffiffiffiffiffiffiffiffiffiffiffiffiffiffiffiffiffi
v2 from Eqs. (A.51) and (A.54). The impact velocity u is only dependent
m
s0 ¼ a m 1 þ 2 2
; ð7Þ on U and C, while the incidence angle h further depends on position.
V
where am and vm are respectively the lunar semi-major axis and 3.3. Cratering rate
velocity. On the cross sectional disk, the distance from the center
is denoted by the impact parameter b. Only when b 6 s0 is it possi- To obtain cratering rates from impact rates, we need to convert
ble for a hyperbolic orbit to impact the Moon (note that the gravi- the impactor diameters into crater diameters. For this purpose, we
tational cross section of the Moon itself is accounted for later in use equations that have been derived in the framework of p-scal-
the calculation, see Appendix A.2). The probability distribution of ing dimensional analysis (Holsapple and Schmidt, 1987; Holsapple,
encounter conditions p(V) is first calculated according to this new 1993), where the transient crater is given as a function of the pro-
definition of the encounter probability. Then, the relative lunar jectile diameter, impact velocity, surface gravity and projectile/tar-
encounter velocity U and probability Pm are derived analytically get density ratio (see Appendix A.4). It is assumed that only the
for each hyperbolic orbit crossing the Earth–Moon system (Eqs. vertical component of the impact velocity, whose value is obtained
(A.19), (A.18), (A.24), (A.25), (A.30)–(A.33)). The probability distri- from the impact angle, contributes to the crater size (Pierazzo
bution of lunar encounter conditions, p(U), is then determined by et al., 1997), though other relations could be easily incorporated
integrating numerically Pm for all possible hyperbolic orbits of each into this analysis. The scaling equation and parameters are taken
encounter V, and for all encounter velocities. Similarly, the impact from the summary of Holsapple and Housen (2007) for the case
probability with Earth Pe is determined for each hyperbola, and of porous and non-porous scaling. It will be seen that both forma-
the Moon/Earth impact ratio r is calculated over all possible tion regimes are necessary to reconcile the impactor and crater
encounters. Mathematically, p(U) and r are given by Eqs. (A.34)– SFDs. We only consider craters that form in the gravity regime,
(A.36). where the tensile strength of rock is negligible, that is, craters lar-
Note that there is a dependence of the lunar impact rate on the ger than a few hundred meters in competent rock, and larger than
Earth–Moon separation distance, am. This distance has evolved out- a few meters in consolidated soils. An increase of the transient cra-
ward with time, and we test various separation distances in the ter diameter by wall slumping and rim formation is accounted for
simulations. A major difference between our approach and previ- as given in Melosh (1989). Finally, large craters collapse due to
ous investigations (Shoemaker and Wolfe, 1982; Zahnle et al., gravity, becoming complex craters, and the relationship between
1998; Zahnle et al., 2001) is that the argument of pericenter of simple and complex crater diameters is taken from Holsapple
the hyperbolic orbits is not assumed to precess uniformly within (1993). Putting this altogether, we obtain the relation d(D, u, h) that
the Earth–Moon system, but is explicitly given by the encounter gives the impactor diameter d as a function of the crater diameter
geometry. Our formulation allows to calculate explicitly lateral D, impact velocity u and incidence angle h (Appendix A.4, Eqs.
asymmetries in the lunar cratering rate. (A.63), (A.59)). The impactor diameter d required to create a crater
of size D is ultimately a function of k, / and U (see Eqs. (A.51) and
3.2. Impact rate (A.54)).
The cratering rate, that is the number of craters larger than D
Let us express the cumulative impact flux, that is the number of that form at (k, u) per unit time and area, is
objects with diameters greater than d that hit the planet per unit Z
time and area, as Cð D; k; uÞ ¼ /ð d; k; /ÞpðUÞdU; ð12Þ
U
/ð d; k; uÞ ¼ /ð dÞ Â D/ðk; uÞ; ð8Þ where
where k and u are respectively the latitude and longitude, /ð dÞ is d ¼ dðD; k; /; UÞ: ð13Þ
the spatially averaged impact rate for projectiles larger than d, and
D/(k, u) is the relative impact rate as a function of position, normal- For convenience, we separate the cratering rate into
ized to the global average. Using our normalized impactor SFD, the
average impact rate expresses as
Cð D; k; uÞ ¼ Cð DÞ Â DCð D; k; uÞ: ð14Þ
/ð dÞ ¼ /ð 1Þsð dÞ; ð9Þ where Cð DÞ is the spatially averaged rate and DC(D, k, u) is the
relative spatial variation. Note that DC depends on D, though in
and /ðd 1Þ is obtained from the impact ratio between the target practice, this dependence is moderate (see next section).
and Earth, r, and the terrestrial impact rate /e ðd 1Þ as
/ð 1Þ ¼ r /e ð 1Þ: ð10Þ 4. Results
The net spatial asymmetry D/(k, u) is found by integrating the spa- 4.1. Crater size-frequency distributions
tial asymmetries d/(k, u, U) associated with each encounter
geometry: We first present our synthetic size-frequency distribution of lu-
Z nar craters. Following the terminology of Marchi et al. (2009), we
D/ðk; uÞ ¼ d/ðk; u; UÞpðUÞdU; ð11Þ refer to this as a model production function. We compare our mod-
U
el production function with the two standard measured production
where d/ is given in Appendix A.3 as a function of the Safronov functions of Neukum (1983, 1994) and Hartmann (Basaltic Volca-
parameter C and obliquity of the target (Eqs. (A.47)–(A.49)). The nism Study Project, 1981; Hartmann, 1999). We note that the
impact flux is homogeneous for C = 1, that is, for encounter veloc- two are in good agreement over the crater diameter range from
ities negligible with respect to the target’s surface gravitational po- 300 m to 100 km, but differ between 2 and 20 km, with a
tential (Eq. (3)). On the other hand, for C = 0, encounter trajectories maximum discrepancy of a factor 3 at 5 km.
are straight lines, and the impact flux is a simple geometrical pro- Using the traditional non-porous scaling relations and a
jection of the spatially uniform encounter flux (on a plane perpen- standard target density of 2800 kg mÀ3, we calculate that
dicular to the radiant) onto the target’s spherical surface. The 2.88 Â 10À11 craters larger than 1 km would be created each year
associated impact velocities and incidence angles are calculated on the lunar surface by the present impactor population. Using
6. 6 M. Le Feuvre, M.A. Wieczorek / Icarus 214 (2011) 1–20
the time-dependence established by Neukum (1983) that predicts 1
dz ðzÞ ¼ ððT À zÞdp þ zdnp Þ for z 6 T;
a quasi-constant impact flux over the last $3 Ga, the Hartmann T ð17Þ
and Neukum production functions return respective values of dz ðzÞ ¼ dnp for z P T;
7.0 Â 10À13 and 8.2 Â 10À13, which are about 10 times lower,
implying that the present flux must be considerably larger than
the time averaged value. with dp and dnp the impactor diameters respectively required from
However, by using the porous scaling law instead, in order to the porous and non-porous regimes. In the calculation of dnp, the
account for the presence of megaregolith on the lunar surface, target density is set to 2800 kg mÀ3 (solid rocks), whereas we as-
our calculated spatially averaged lunar cratering rate is sume in calculating dp that the density of the porous material is
À2 2500 kg mÀ3, based on Bondarenko and Shkuratov (1999) who in-
C m ðD 1Þ ¼ 7:5 Â 10À13 yrÀ1 km ; ð15Þ ferred an upper regolith density comprised between 2300 and
a value in excellent agreement with the two measured production 2600 kg mÀ3 from correlations between the surface regolith thick-
functions under the assumption of a constant impact flux over the ness and the Soderblom’s crater parameter (Soderblom and Lebof-
last $3 Ga. sky, 1972). We note that given the simplicity of our crater-scaling
Let us now reconcile the entire shape of the measured produc- procedure in the transition zone, the correspondance between T
tion functions with the observed impactor population. As shown in and the actual megaregolith thickness should not be expected to
Fig. 2, the two measured distributions are very well fitted by using be exact.
the porous regime for small craters (D 2 km), and the non-porous As shown in Fig. 2, our model reproduces both the Hartmann
regime for larger craters (D 20 km). We model a simple smooth and Neukum production functions within the 100 m – 300 km
transition between the two regimes by considering that the impac- diameter range, for respective values of T equal to 250 and 700
tor size d required to create a crater of diameter D is a linear com- m, respectively. For these diameter ranges, the maximum discrep-
bination of the sizes required from the porous and non-porous ancy between our model and the Neukum production function is
scaling relations, the influence of each regime depending on the only 30% at 200 m, and always less than 20% for craters larger than
depth of material excavated by the crater. The depth of excavation 500 m. Below 100 m, we note that our model is in reasonable
zT is about 1/10 of the transient crater diameter DT, and does not agreement with the Neukum production function, and we leave
seem to depend on target properties (Melosh and Ivanov, 1999). the implications for the contribution of secondary craters to fur-
The impactor size is averaged over the depth of excavation: ther investigations. The model production function proposed by
Z zT
Marchi et al. (2009) is also shown in Fig. 2. A detailed comparison
1 with this latter study is given in the discussion section.
d¼ dz ðzÞ dz; ð16Þ
zT 0 The use of porous scaling was first suggested by Ivanov (2006)
where dz is the impactor size required by the material at depth z, (see also Ivanov, 2008; Ivanov et al., 2007), and is a natural conse-
given by the porous regime at the surface, by the non-porous re- quence of a highly fractured megaregolith on airless bodies. Also
gime at depths larger than a given ‘‘megaregolith thickness’’ T, natural is to expect that the thickness of the megaregolith will de-
and by a linear combination between z = 0 and z = T: pend upon both age and local geology. We note that the need for a
transition regime falls within the diameter range where the mea-
sured production functions differ the most (excluding very large
craters). We suspect that this is partially a result of the Hartmann
production function being based on crater counts performed solely
over mare units, whereas the Neukum production function also in-
10−5 cludes older highlands terrains (Neukum et al., 2001a).
Estimated megaregolith thicknesses are roughly consistent with
10−6
seismic models of the lunar crust (e.g., Warren and Trice, 1977;
10−7 Lognonné et al., 2003) that generally predict reduced seismic
Cumulative number (km−2 yr − 1)
10−8 velocities for the upper km, which is attributed to an increased
10−9 porosity and fractures. Furthermore, seismic data at the Apollo
17 landing site, overlaid by mare basalt, indicates that the upper
10−10
250 / 400 m show a very low P-wave velocity with respect to the
10−11 deeper basalt (Kovach and Watkins, 1973; Cooper et al., 1974),
10−12 the lower estimate being in agreement with our calculated megar-
10−13 egolith depth of 250 m for the Hartmann production function. Fi-
nally, Thompson et al. (1979) show by analysis of radar and
10−14 infrared data (which are dependent on the amount of near surface
10−15 Neukum et al. (2001) rocks) that craters overlying highlands show different signatures
10−16 Hartmann (1999) for craters greater and less than 12 km, and that mare craters down
10−17
Marchi et al. (2009) to 4 km in diameter possess a similar signature to that of highlands
Model, megaregolith 700 m craters greater than 12 km. They attribute this difference to the
10−18 Model, megaregolith 250 m presence of a pulverized megaregolith layer that is thicker in the
10−19 older highlands than the younger mare.
0.01 0.1 1 10 100 By the use of a porous regime dictated by the properties of a
Crater diameter (km) megaregolith, our model production function reproduces the mea-
sured crater distributions in shape and in the absolute number of
Fig. 2. Model production function of lunar craters, for 1 yr, in comparison with the craters formed over the past 3 Ga, under the assumption of a con-
Hartmann and Neukum measured production functions, and the model production stant impact flux. We caution that our simple formulation of the
function of Marchi et al. (2009). Respective megaregolith thicknesses of 700 and
250 m allow to fit either the Neukum or Hartmann production functions in the
porous/non-porous transition does not account for the temporal
diameter range 2–20 km. The thin dotted red curve is obtained by using only the evolution of the megaregolith and that the inferred megaregolith
non-porous scaling relation. thicknesses are only qualitative estimates.
7. M. Le Feuvre, M.A. Wieczorek / Icarus 214 (2011) 1–20 7
The present Earth–Moon distance has been used in the above For illustrative purpose, Rc is shown for the inner planets in Fig. 3 by
calculation of the lunar cratering rate, and temporal variations in assuming that craters with diameters less than 10 km form in a por-
the lunar semi-major axis could, in principle, modify the Earth/ ous soil on both the planet and Moon, while craters with greater
Moon impact ratio and encounter velocity distribution with the sizes form in solid rocks (except for the Earth and Venus where only
Moon. Nevertheless, it is found in our simulations that, for a lunar the non-porous regime is used). Note that Rc can be easily calcu-
semi-major axis as low as 20 Earth radii, the average lunar crater- lated from Eq. (18) and Table 2 for a different (and more realistic)
ing rate is changed by less than 3%. This implies that both the transition between porous and non-porous regimes.
shielding and gravitational focusing of projectiles by the Earth The mean impact velocity on the Moon is calculated to be
are of very moderate effects, especially since the Moon is believed um ¼ 19:7 km sÀ1 . The full probability distribution of impact veloc-
to have spent the vast majority of its history beyond 40 Earth radii.
ities for each planet is shown in Fig. 4. The quantities /=/m ; u=um
Our globally averaged planetary cratering rates Cð DÞ are fitted
by 10th-order polynomials for the Moon and inner planets. The
coefficients (with units of yrÀ1 km2) are listed in Table 2. Since 4
the megaregolith thickness is not necessarily the same on each pla-
net, and may depend on the age and geology of the surface, coeffi-
cients are given for the two scaling regimes (T = 1 and T = 0 km)
for diameters between 0.1 and 1000 km (except for the Earth and 3
Venus, where only non-porous scaling is given). A linear transition
simpler than ours can be used by defining two threshold diame-
ters, Dp and Dnp, such that the porous and non-porous regime ap- Mercury
R c (D)
plies alone respectively below Dp and above Dnp. The cratering Venus
rate in the transition regime is then calculated as Cð DÞ ¼ 2 Earth
C ðD ÞÀC ðD Þ
C p ð Dp Þ þ np Dnp ÀDpp p ðD À Dp Þ, where Cp and Cnp are given in Ta- Mars
np
ble 2 in the porous and non-porous columns, respectively. Note
that the martian cratering rate is sensitive to the eccentricity of
the planet, since the number of potential impactors increases dra- 1
matically as this planets gets closer to the Main Asteroid Belt (Le
Feuvre and Wieczorek, 2008; Ivanov, 2001). In addition to calculat-
ing the present day martian cratering rate, we also used the prob-
ability distribution of the martian eccentricity provided by Laskar
(2008) to calculate an average over the past 1 Ga (note that this va- 0
0.1 1 10 100 1000
lue is nearly insensitive for longer averages).
Planetary size-frequency distributions are generally expressed D (km)
with respect to the lunar one. This is done by defining the size-
Fig. 3. Planetary cratering ratios with respect to the Moon, for craters larger than a
dependent quantity Rc, which is the cratering ratio with respect
given diameter D. For illustrative purposes, craters with D 10 km and D 10 km
to the Moon, are respectively assumed to form in the porous and non-porous regimes. Curves are
not shown for Venus and the Earth for D 10 km, since the porous regime is not
Cð DÞ expected, and erosion or atmospheric shielding are known to be of significant
Rc ð DÞ ¼ : ð18Þ
C m ð DÞ influence at these sizes.
Table 2
P
Planetary crater size-frequency distributions for 1 yr (kmÀ2): log Cð DÞ ¼ 10 C i ðlog Dkm Þi ; D 2 ½0:1—1000Š km.
i¼0
Moon Moon Mercury Mercury Venus
Non-porous Porous Non-porous Porous Non-porous
C0 À0.1049E+02 À0.1206E+02 À0.9939E+01 À0.1159E+02 À0.1073E+02
C1 À0.4106E+01 À0.3578E+01 À0.3994E+01 À0.3673E+01 À0.4024E+01
C2 À0.8715E+00 0.9917E+00 À0.1116E+01 0.9002E+00 À0.4503EÀ01
C3 0.1440E+01 0.7884E+00 0.1269E+01 0.9609E+00 0.1374E+01
C4 0.1000E+01 À0.5988E+00 0.1272E+01 À0.5239E+00 0.2433E+00
C5 À0.8733E+00 À0.2805E+00 À0.8276E+00 À0.3622E+00 À0.7040E+00
C6 À0.2725E+00 0.1665E+00 À0.3718E+00 0.1508E+00 À0.3962EÀ01
C7 0.2373E+00 0.3732EÀ01 0.2463E+00 0.5224EÀ01 0.1541E+00
C8 0.9500EÀ02 À0.1880EÀ01 0.2091EÀ01 À0.1843EÀ01 À0.8944EÀ02
C9 À0.2438EÀ01 À0.1529EÀ02 À0.2756EÀ01 À0.2510EÀ02 À0.1289EÀ01
C10 0.3430EÀ02 0.7058EÀ03 0.3659EÀ02 0.8053EÀ03 0.2102EÀ02
Earth Mars (long term) Mars (long term) Mars (today) Mars (today)
Non-porous Non-porous Porous Non-porous Porous
C0 À0.1099E+02 À0.1089E+02 À0.1213E+02 À0.1082E+02 À0.1207E+02
C1 À0.3996E+01 À0.4068E+01 À0.3124E+01 À0.4072E+01 À0.3134E+01
C2 0.2334E+00 0.2279E+00 0.1295E+01 0.2157E+00 0.1293E+01
C3 0.1333E+01 0.1422E+01 0.1542E+00 0.1426E+01 0.1713E+00
C4 0.2286EÀ02 0.2470EÀ01 À0.7519E+00 0.3330EÀ01 À0.7518E+00
C5 À0.6476E+00 À0.7150E+00 0.3125EÀ01 À0.7171E+00 0.2232EÀ01
C6 0.2875EÀ01 0.2056EÀ01 0.1779E+00 0.1856EÀ01 0.1786E+00
C7 0.1313E+00 0.1535E+00 À0.2311EÀ01 0.1540E+00 À0.2129EÀ01
C8 À0.1410EÀ01 À0.1526EÀ01 À0.1369EÀ01 À0.1510EÀ01 À0.1396EÀ01
C9 À0.1006EÀ01 À0.1252EÀ01 0.2623EÀ02 À0.1255EÀ01 0.2492EÀ02
C10 0.1810EÀ02 0.2247EÀ02 0.5521EÀ05 0.2246EÀ02 0.3212EÀ04
8. 8 M. Le Feuvre, M.A. Wieczorek / Icarus 214 (2011) 1–20
0.20 velocity is added to the projectile velocity for impacts at the apex,
whereas it is subtracted at the antapex. The apex/antapex ratio is
Mercury 1.37. We note that there is a negligible nearside/farside effect:
Venus
the nearside experiences the formation of about 0.1% more craters
Earth
that the farside. The Earth does indeed concentrate very low incli-
0.15 Moon
nation (and moderate velocity) projectiles onto the lunar nearside,
Mars
but these are not numerous enough to influence the global
distribution.
Probability
The lateral cratering variations depend on the crater size since
0.10 the size-frequency distribution of impactors s(d) is not a simple
power law, and the impact conditions are not everywhere the
same. Nevertheless, the maximum/minimum cratering ratio varies
only by about 5% for D ranging from 30 m to 300 km. Consequently,
0.05 for the following discussion, we shall consider that DC(D, k, u) ’
DC(1, k, u).
For smaller Earth–Moon distances am, the apex/antapex effect
increases as the lunar velocity increases. Between 20 and 60 Earth
radii, this dependency is fit by the simple equation
0.00
10 20 30 40 50 60 70 80 90 am
CðapexÞ=CðantapexÞ ¼ 1:12eÀ0:0529 Re þ 1:32; ð19Þ
Impact velocity (km/s)
where Re is the Earth radius. Over this range of Earth–Moon separa-
Fig. 4. Probability distribution of impact velocities for the Moon and terrestrial
tions, latitudinal variations and the nearside/farside effect are found
planets.
to vary by less than 1%. These calculations assume that the lunar
and g/gm, that give the relative impact flux, impact velocity and obliquity stayed equal to its present value in the past.
surface gravity with respect to the Moon, are given in Table 3 for Fig. 6 plots the relative cratering rate DC as a function of the
the inner planets. Mars experiences a high impact rate with respect angular distance from the apex of motion for the present Earth–
to the Moon (about 3) due to its proximity to the main asteroid Moon distance, and compares this with the counts of rayed craters
belt. In comparison, the martian cratering ratio is reduced (be- with diameters greater than 5 km given in Morota et al. (2005).
tween about 0.5 and 2.5) because the impact velocity on Mars is Rayed craters are younger than about 1 Ga (Wilhelms et al.,
significantly lower than on the Moon, requiring larger (and hence 1987), which should corresponds to an Earth–Moon separation dis-
less numerous) impactors to create a crater of a given size. Mercury tance very close to the present one (Sonett and Chan, 1998; Eriks-
exhibits also a high impact rate, and the impact velocity is about son and Simpson, 2000). As is seen, the model compares favorably
twice as large as on the Moon, resulting in a high value of the cra- to the data.
tering ratio Rc, comprised between 2 and 4. The impact rate is lar- We note that the impact rate exhibits nearly the same behavior
ger on the Earth and Venus than on the Moon, as these planets as the cratering rate, but with a reduced amplitude. The pole/equa-
possess a higher gravitational attraction. Their higher surface grav- tor ratio is 0.90, whereas the apex/antapex ratio is 1.29. The latitu-
ities compensate the differences in impact velocities with the dinal cratering variations are enhanced with respect to the impact
Moon, and Rc is comprised between 0.5 and 1.5 for the Earth and rate variations, as the mean impact angle and impact velocity are
between 1 and 2 for Venus. smaller at the poles than at the equator (respectively by 2.5° and
500 m/s), requiring a larger projectile to create the same crater
size. As large projectiles are less numerous than small ones, the im-
4.2. Spatial variations pact rate at the poles is smaller than the cratering rate (Le Feuvre
and Wieczorek, 2008). This is also true for the apex/antapex asym-
The relative spatial cratering variations on the Moon, metry, as the average impact velocity is 500 m/s higher at the apex
DC(D, k, u), are shown in Fig. 5 for the present Earth–Moon dis- than at the antapex. However, the increase is moderate, as the
tance of about 60 Earth radii, and for crater diameters larger than mean impact angle is only about 1.5° smaller.
1 km. The cratering rate varies from approximately À20% to +25% It is seen in Fig. 7 that our predicted apex/antapex effect differs
with respect to the global average. It is minimized at about from that of Zahnle et al. (2001). These authors describe their vari-
(±65°N, 90°E), whereas the maximum, which is a factor 1.5 higher, ations of the impact rate as a function of c, the angular distance to
is located at the apex of motion (0°N, 90°W). the apex, as
Two effects conjugate to give such a distribution. First, a latitu- 0 12
dinal effect, detailed in Le Feuvre and Wieczorek (2008), comes
B vm C
from the higher proportion of low inclination asteroids associated D/ðcÞ ¼ @1 þ qffiffiffiffiffiffiffiffiffiffiffiffiffiffiffiffiffiffiffiffiffi cos cA ; ð20Þ
with the higher probabilities of low inclination encounters. The 2v 2 þ V 2
m
pole/equator ratio is 0.80. Second, a longitudinal apex/antapex ef-
fect comes from the synchronous rotation of the Moon and the where V ’ 19 km sÀ1 is the mean encounter velocity with the
higher relative encounter velocities at the apex. The lunar orbital Earth–Moon system. We are able to reproduce their analytical solu-
Table 3
Impact rate, mean impact velocity and surface gravity for the inner planets, normalized to the Moon’s.
Moon Mercury Venus Earth Mars (long term) Mars (today)
Impact rate ratio 1 1.82 1.75 1.58 2.76 3.20
Mean velocity ratio 1 2.16 1.28 1.04 0.53 0.54
Surface gravity ratio 1 2.2 5.3 5.9 2.2 2.2
9. M. Le Feuvre, M.A. Wieczorek / Icarus 214 (2011) 1–20 9
90°
60°
30°
180° 210° 240° 270° 300° 330° 0° 30° 60° 90° 120° 150° 180°
−30°
−60°
−90°
0.85 0.90 0.95 1.00 1.05 1.10 1.15 1.20 1.25
Relative cratering rate
Fig. 5. Relative cratering rate on the Moon for the current Earth–Moon distance and for crater diameters larger than 1 km. This image is plotted in a Mollweide projection
centered on the sub-Earth point.
1.2
1.4
1.1
Relative impact rate
Relative cratering rate
1.2
1 1.0
0.8
0.9
0.6
0 30 60 90 120 150 180
0 30 60 90 120 150 180
Angular distance from apex (º)
Angular distance to apex (°)
Fig. 6. Relative lunar cratering rate as a function of angular distance from the apex
of motion. Rayed crater data are for crater diameters greater than 5 km from Morota Fig. 7. Relative lunar impact rate as a function of the angular distance from the
et al. (2005) that were counted between approximately [70°E, 290°E] in longitude apex (solid black), in comparison with the equation from Zahnle et al. (2001) (solid
and [À42°N, 42°N] in latitude. In comparison, the predicted apex/antapex cratering gray). The latter is reproduced if the model forces latitudinal isotropy of encounter
effect is shown over the same count area (solid black) and for the entire Moon inclinations (dotted black).
(dotted black).
2008). Spatial variations in the impact flux and cratering rate are
parameterized by a sum a spherical harmonic functions
tion, but only under the condition where we force the encounter
inclinations with respect to the lunar orbit plane to be isotropic in X X
1 l
space. These authors used Öpik equations (Shoemaker and Wolfe, DCðk; uÞ ¼ C lm Y lm ðk; uÞ; ð21Þ
l¼0 m¼Àl
1982) for hyperbolic orbits that were assumed to precess uniformly
inside the planet–Moon system. We nevertheless point out that where Ylm is the spherical harmonic function of degree l and order
Zahnle et al. (2001) applied Eq. (20) to the moons of Jupiter, where m, Clm is the corresponding expansion coefficient, and (k, u) repre-
this approximation might be valid. sents position on the sphere in terms of latitude k and longitude
We next provide analytical solutions for the relative variations u, respectively. The real spherical harmonics are defined as
of both the impact and cratering rates on the Moon. We also give (
solutions for the latitudinal variations presented on the terrestrial Plm ðsin kÞ cos mu if m P 0
Y lm ðk; uÞ ¼ ð22Þ
planets in Le Feuvre and Wieczorek (2008). Two values are quoted Pljmj ðsin kÞ sin jmju if m 0;
for Mars, one that corresponds to its present obliquity and eccen-
tricity and the other to averaged results using variations over and the corresponding unnormalized Legendre functions are listed
3 Ga as given in Laskar et al. (2004) (see Le Feuvre and Wieczorek, in Table 4. Many of the expansion coefficients are nearly zero since
10. 10 M. Le Feuvre, M.A. Wieczorek / Icarus 214 (2011) 1–20
Table 4 the following relationship between the number of craters with
Unnormalized associated Legendre functions. diameters greater than 1 km and the age of the geologic unit:
l, m Plm(sin k)
NðD 1; tÞ ¼ aðebt À 1Þ þ ct; ð23Þ
0, 0 1
1, 1 cosk
where NðD 1; tÞ is given per 106 km2, t is the age expressed in Ga,
2, 0 1 2
2 ð3 sin k À 1Þ
and a = 5.44 Â 10À14, b = 6.93 and c = 8.38 Â 10À4. This relationship
2
2, 2 3 cos k
3, 1 3 2 is essentially linear over the last 3.3 Ga (constant cratering rate in
2 ð5 sin k À 1Þ cos k
4, 0 1 4 2 time) and approximately exponential beyond. The data used to con-
8 ð35 sin k À 30 sin k þ 3Þ
struct this empirical curve are obtained from radiometric ages of
the Apollo and Luna rock samples, compared to the crater density
covering the associated geologic unit. We emphasize that no agreed
Table 5 upon calibration data exist between 1 and 3 Ga and beyond 3.9 Ga
Spherical harmonic coefficients of the lunar relative impact flux D/(k, u) for Earth–
Moon separations of 30, 45, and 60 Earth radii.
(Stöffler and Ryder, 2001). We also note that Eq. (23) was originally
obtained using age estimates of the highland crust and Nectaris im-
Clm 30 Earth radii 45 Earth radii 60 Earth radii pact basin, both of which are disputed and considerably older than
C0,0 1 1 1 3.9 Ga.
C1,À1 À1.7779020 Â 10À1 À1.4591830 Â 10À1 À1.2670400 Â 10À1 Accounting for our calculated spatial variations, we first convert
C2,0 À6.3209891 Â 10À2 À6.2923420 Â 10À2 À6.2755592 Â 10À2
the measured crater density at a given site, N(D 1, k, u), into the
C2,2 À1.7937283 Â 10À3 À1.2524090 Â 10À3 À9.8998262 Â 10À4
C4,0 À9.9735381 Â 10À3 À1.0141450 Â 10À2 À1.0222370 Â 10À2 corresponding spatially averaged quantity:
NðD 1Þ ¼ NðD 1; k; uÞ=DCðD 1; k; uÞ: ð24Þ
Table 6 The cratering asymmetry DC is given in Table 2, and we use the
Spherical harmonic coefficients of the lunar relative cratering rate DC(D 1,k, u) for function that corresponds to the present Earth–Moon separation
Earth–Moon separations of 30, 45, and 60 Earth radii.
for cratered surfaces that are less than 1 Ga (consistent with the ti-
Clm 30 Earth radii 45 Earth radii 60 Earth radii dal deposit data of Sonett and Chan (1998)). We choose a Earth–
C0,0 1 1 1 Moon separation of 40 Earth radii for units that are older than
C1,À1 À2.2715950 Â 10À1 À1.8571530 Â 10À1 À1.6092760 Â 10À1 3 Ga (based on the tidal deposits data of Eriksson and Simpson
C2,0 À1.3954110 Â 10À1 À1.3874170 Â 10À1 À1.3831914 Â 10À1 (2000)). This lunar semi-major axis value corresponds to a lunar
C2,2 À3.3499412 Â 10À3 À2.2729362 Â 10À3 À1.7822560 Â 10À3
orbital velocity twice as large as the present one. We further as-
C3,À1 2.9040180 Â 10À3 2.3263713 Â 10À3 1.9948010 Â 10À3
C4,0 2.7412530 Â 10À3 2.7863080 Â 10À3 2.8083000 Â 10À3 sume that the lunar obliquity was equal to its present value (nearly
zero) for the entire time between 3.9 Ga and the present.
The data used to calibrate the crater density versus age relation-
ship are listed in Table 9, along with their corrections accounting
Table 7 for spatial variations in the cratering rate. We use the crater den-
Spherical harmonic coefficients of the relative impact flux D/(k) for the terrestrial
planets.
sity and ages values quoted in Stöffler and Ryder (2001). We did
not attempt to fit crater distributions with our model production
Planet C00 C20 C40 function to re-estimate N(D 1) values, since our model already
Mercury 1 3.7395410 Â 10À2 À7.9170623 Â 10À3 reproduces very well the Neukum production function that was
Venus 1 7.3546990 Â 10À3 À6.0267052 Â 10À3 used to estimate this quantity. For the case of very young calibra-
Earth 1 À2.6165971 Â 10À2 À1.8682412 Â 10À3
tion surfaces, we suspect that a thinner megaregolith might change
Mars (today) 1 1.6254980 Â 10À1 À1.0738801 Â 10À2
Mars (long-term average) 1 8.7425552 Â 10À2 4.7442493 Â 10À3 the crater distribution with respect to the Neukum production
function at sizes larger than one kilometer, but, for small exposure
times, the largest observed craters are below this diameter value.
Based on the data and interpretations of Norman (2009), we ex-
Table 8 clude the Nectaris basin from consideration, as it is possible that
Spherical harmonic coefficients of the relative cratering rate DC(D 1, k) for the
samples assigned to this basin have instead an Imbrium prove-
terrestrial planets.
nance. We thus assume that the Descartes formation is not Necta-
Planet C00 C20 C40 ris ejecta, but rather Imbrium ejecta with an age of 3.85 Ga. We
Mercury 1 4.5850560 Â 10À2 2.4749320 Â 10À3 also exclude the Crisium basin from the fit, due to the uncertain
Venus 1 À1.8545722 Â 10À3 3.5865970 Â 10À4 provenance of samples dated at the Luna 20 site. Finally, we use
Earth 1 À7.6586370 Â 10À2 2.4353234 Â 10À4
the recent crater counts performed on Copernicus deposits by
Mars (today) 1 3.3900970 Â 10À1 2.2655340 Â 10À3
Mars (long-term average) 1 1.7986312 Â 10À1 À4.3484250 Â 10À4 Hiesinger et al. (2010) with high-resolution Lunar Reconnaissance
Orbiter images, which agree with a constant impact flux during the
last 800 Ma, in contrast to previous studies.
the cratering rate is symmetric about both the equator and the axis As seen in Table 9, the spatial correction is in general moderate,
connecting the apex and antapex of motion. Only the most signifi- since the calibration terrains are located in the central portion of
cant coefficients are listed in Tables 5 and 6, which for most cases the nearside hemisphere, far from the extrema of the spatially-
reproduce the data to better than 0.2%. The coefficients for the lat- dependent cratering rate. Nevertheless, we point out that after cor-
itudinal variations on the terrestrial planets are listed in Tables 7 rection, the Apennines, Fra Mauro and Descartes formations, which
and 8. are all Imbrian in age, exhibit nearly the same globally averaged
crater density, which is consistent with our assignment of an
5. Crater chronology Imbrium origin to the Descartes formation, as recently suggested
by Norman (2009) (see also Haskin et al., 1998).
Neukum et al. (2001a) (see also Neukum, 1983; Strom and We perform a new fit of the calibration point, using the same
Neukum, 1988; Neukum and Ivanov, 1994) established empirically functional form as in Eq. (23). Our resulting best parameters are