Downloaded 21 times


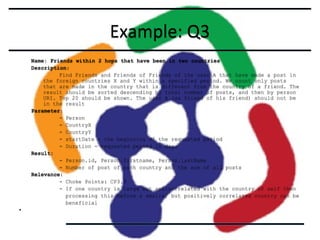
![Example: Q5 - Cypher
MATCH (person:Person)-[:KNOWS*1..2]-(friend:Person)
WHERE person.id={person_id}
MATCH (friend)<-[membership:HAS_MEMBER]-(forum:Forum)
WHERE membership.joinDate>{join_date}
MATCH (friend)<-[:HAS_CREATOR]-(comment:Comment)
WHERE (comment)-[:REPLY_OF*0..]->(:Comment)-[:REPLY_OF]->(:Post)<[:CONTAINER_OF]-(forum)
RETURN forum.title AS forum, count(comment) AS commentCount
ORDER BY commentCount DESC
MATCH (person:Person)-[:KNOWS*1..2]-(friend:Person)
WHERE person.id={person_id}
MATCH (friend)<-[membership:HAS_MEMBER]-(forum:Forum)
WHERE membership.joinDate>{join_date}
MATCH (friend)<-[:HAS_CREATOR]-(post:Post)<-[:CONTAINER_OF]-(forum)
RETURN forum.title AS forum, count(post) AS postCount
ORDER BY postCount DESC](https://image.slidesharecdn.com/ldbcfosdem-140205045820-phpapp02/85/FOSDEM2014-Social-Network-Benchmark-SNB-Graph-Generator-Peter-Boncz-31-320.jpg)
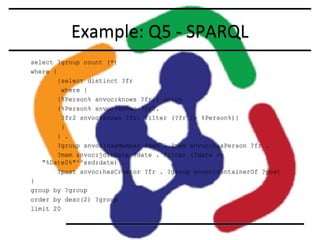
![Example: Q5 - DEX
v.setLongVoid(personId);
v.setLongVoid(personId);
long personOID = graph.findObject(personId, v);
long personOID = graph.findObject(personId, v);
Objects friends = graph.neighbors(personOID, knows, EdgesDirection.Outgoing);
Objects friends = graph.neighbors(personOID, knows, EdgesDirection.Outgoing);
Objects allFriends = graph.neighbors(friends, knows, EdgesDirection.Outgoing);
Objects allFriends = graph.neighbors(friends, knows, EdgesDirection.Outgoing);
allFriends.union(friends);
allFriends.union(friends);
allFriends.remove(personOID);
allFriends.remove(personOID);
friends.close();
friends.close();
Objects members = graph.explode(allFriends, hasMember, EdgesDirection.Ingoing);
Objects members = graph.explode(allFriends, hasMember, EdgesDirection.Ingoing);
v.setTimestampVoid(date);
v.setTimestampVoid(date);
Objects candidate = graph.select(joinDate, Condition.GreaterEqual, v, members);
Objects candidate = graph.select(joinDate, Condition.GreaterEqual, v, members);
Objects finalSelection = graph.tails(candidate);
Objects finalSelection = graph.tails(candidate);
candidate.close();
candidate.close();
members.close();
members.close();
Objects posts = graph.neighbors(allFriends, hasCreator, EdgesDirection.Ingoing);
Objects posts = graph.neighbors(allFriends, hasCreator, EdgesDirection.Ingoing);
ObjectsIterator iterator = finalSelection.iterator();
ObjectsIterator iterator = finalSelection.iterator();
while (iterator.hasNext()) {
while (iterator.hasNext()) {
long oid = iterator.next();
long oid = iterator.next();
Container c = new Container();
Container c = new Container();
Objects postsGroup = graph.neighbors(oid, containerOf, EdgesDirection.Outgoing);
Objects postsGroup = graph.neighbors(oid, containerOf, EdgesDirection.Outgoing);
Objects moderators = graph.neighbors(oid, hasModerator, EdgesDirection.Outgoing);
Objects moderators = graph.neighbors(oid, hasModerator, EdgesDirection.Outgoing);
long moderatorOid = moderators.any();
long moderatorOid = moderators.any();
moderators.close();
moderators.close();
Objects postsModerator = graph.neighbors(moderatorOid, hasCreator, EdgesDirection.Ingoing);
Objects postsModerator = graph.neighbors(moderatorOid, hasCreator, EdgesDirection.Ingoing);
postsGroup.difference(postsModerator);
postsGroup.difference(postsModerator);
postsModerator.close();
postsModerator.close();
postsGroup.intersection(posts);
postsGroup.intersection(posts);
long count = postsGroup.size();
long count = postsGroup.size();
if (count > 0) {
if (count > 0) {
graph.getAttribute(oid, forumId, v);
graph.getAttribute(oid, forumId, v);
c.row[0] = db.getForumURI(v.getLong());
c.row[0] = db.getForumURI(v.getLong());
c.compare2 = String.valueOf(v.getLong());
c.compare2 = String.valueOf(v.getLong());
c.row[1] = String.valueOf(count);
c.row[1] = String.valueOf(count);
c.compare = count;
c.compare = count;
results.add(c);
results.add(c);
}
}
postsGroup.close()
postsGroup.close()
}
}](https://image.slidesharecdn.com/ldbcfosdem-140205045820-phpapp02/85/FOSDEM2014-Social-Network-Benchmark-SNB-Graph-Generator-Peter-Boncz-32-320.jpg)


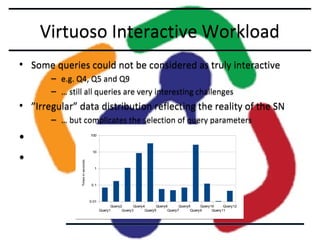


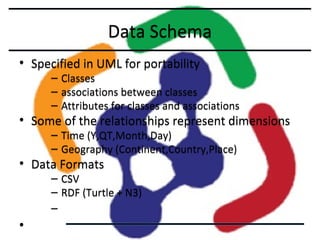
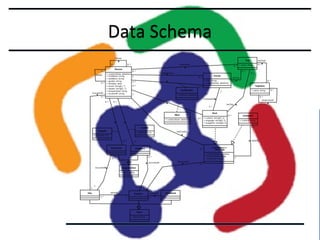
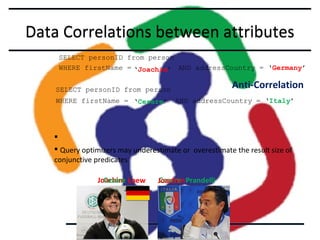
This document describes the LDBC Social Network Benchmark (SNB). The SNB was created to benchmark graph databases and RDF stores using a social network scenario. It includes a data generator that produces synthetic social network data with correlations between attributes. It also defines workloads of interactive, business intelligence, and graph analytics queries. Systems are evaluated based on metrics like query response times. The SNB aims to uncover performance choke points for different database systems and drive improvements in graph processing capabilities.