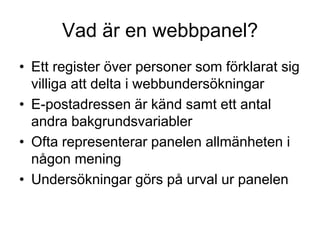
Vad är enwebbpanel?
• Ett register över personer som förklarat sig
villiga att delta i webbundersökningar
• E-postadressen är känd samt ett antal
andra bakgrundsvariabler
• Ofta representerar panelen allmänheten i
någon mening
• Undersökningar görs på urval ur panelen
3.
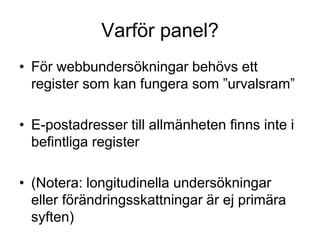
Varför panel?
• Förwebbundersökningar behövs ett
register som kan fungera som ”urvalsram”
• E-postadresser till allmänheten finns inte i
befintliga register
• (Notera: longitudinella undersökningar
eller förändringsskattningar är ej primära
syften)
4.
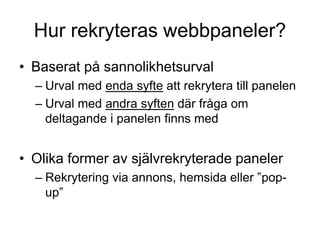
Hur rekryteras webbpaneler?
•Baserat på sannolikhetsurval
– Urval med enda syfte att rekrytera till panelen
– Urval med andra syften där fråga om
deltagande i panelen finns med
• Olika former av självrekryterade paneler
– Rekrytering via annons, hemsida eller ”pop-
up”
5.
Profilundersökning
• Rekryterade personergenomgår en
profilundersökning där bakgrundsvariabler
registreras
• Urval dras ur panelen för specifika
undersökningar. Respondenten kontaktas med
epost och får en länk till en webbenkät
6.
Bakgrund till densvenska
Surveyföreningens engagemang
• Allt vanligare med undersökningar utförda
på webbpaneler
• Stickprovsteorin oftast inte tillämplig
• Svårt att utvärdera kvaliteten (represen-
tativitet, generaliserbarhet) i resultat
• En webbpanelkommitté tillsattes
7.
Webbpanelkommittén - Rollatt fylla
• Föreslå beskrivningsmått för bedömning av
kvaliteten i resultat från webbpanelundersökningar
• Komplement till ISOs, AAPORs och ESOMARs
riktlinjer
• Målgrupp
– Panelleverantörer, undersökningsköpare, andra
användare av undersökningsresultat
• Öka transparensen i tillvägagångssätt och
metoder
– Viktigt för branschens förtroende och för kundernas
förståelse
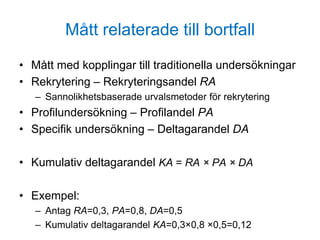
Mått relaterade tillbortfall
• Mått med kopplingar till traditionella undersökningar
• Rekrytering – Rekryteringsandel RA
– Sannolikhetsbaserade urvalsmetoder för rekrytering
• Profilundersökning – Profilandel PA
• Specifik undersökning – Deltagarandel DA
• Kumulativ deltagarandel KA = RA × PA × DA
• Exempel:
– Antag RA=0,3, PA=0,8, DA=0,5
– Kumulativ deltagarandel KA=0,3×0,8 ×0,5=0,12
11.
Övriga mått: Tvåtyper
• Mått relaterade till panelen
• Mått relaterade till en specifik undersökning
• Samband mellan mått och kvalitet ofta
komplicerat
12.
Mått relaterade tillpanelen
Uppgiftslämnarbörda
• Belysa hur många undersökningar
panelmedlemmarna konfronteras med (per år)
• Två mått:
– UB1: antal utsända inbjudningar totalt i förhållande till
panelstorlek
– UB2: antal komplett besvarade enkäter i förhållande
till panelstorlek
13.
Mått relaterade tillpanelen
Dominans från vissa
panelmedlemmar
𝐷20 = Andel ifyllda enkäter som de 20
procent mest aktiva medlemmarna står för
Conditioning (forts)
Mått:
• Delain de svarande i grupper efter hur många
undersökningar de tidigare svarat på och jämför
gruppernas svarsmönster
• Beräkna
– AS1 = andel obesvarade frågor (slarv)
– AS2 = mediantiden att besvara enkäten (slarv)
– AS3 = andel med t ex extrempunktsvärde på vald
fråga (professionalisering)
17.
Nåbarhetsandel (Absorbtion rate)
•Nåbarhetsandel NA – andelen av alla
inbjudningar som kommer fram (ej returneras)
• Måttet NA mäter den grundläggande kvaliteten
på e-postadresserna
18.
Avbrottsandel (Break-off rate)
•Avbrottsandel AA - Andelen enkäter som öppnats
men klassats som ej svar i förhållande till samtliga
öppnade enkäter (besvarade och ej besvarade)
• Är en möjlig indikator på problem med designen av
ett frågeformulär (för långt, för tråkigt)
• Kan säga något om förekomsten av tekniska
problem
• Hög avbrottsandel tyder på att man bör kontrollera
undersökningen
19.
Komplement: Verbala beskrivningar
•T ex
– Urval – hur gick urvalet till?
– Viktning – redovisa på ett transparant sätt hur
eventuella vägningar har genomförts
20.
Planerad fortsättning
• Publiceringav rapporten under hösten 2013
• Inbjudan till undersökningsföretag att presentera
värden på olika mått på Surveyföreningens
hemsida (flera företag är intresserade)
• Uppbyggnad av erfarenheter när det gäller
relationen mellan måttens värden och
resultatens kvalitet