Download as PDF, PPTX
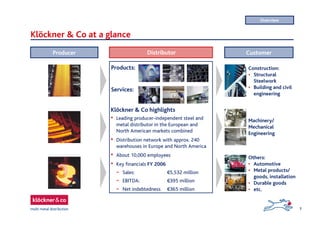
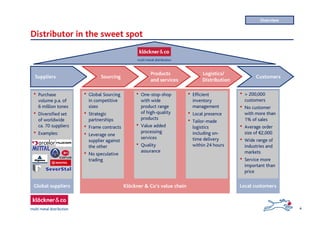
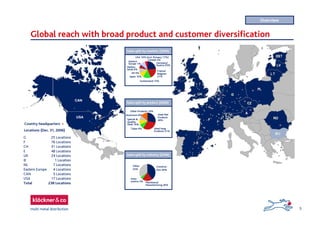

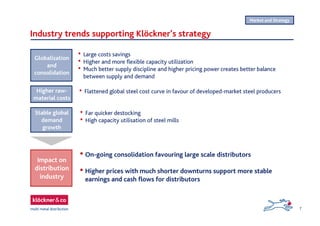
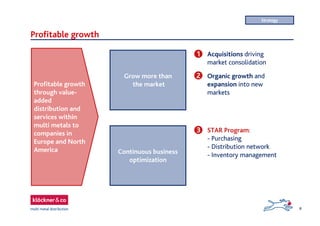
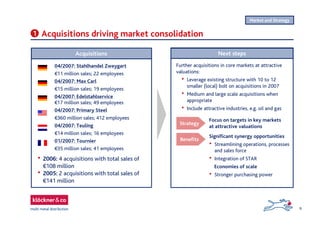
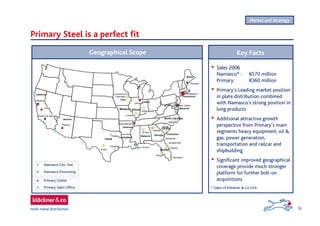
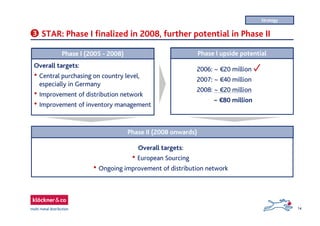
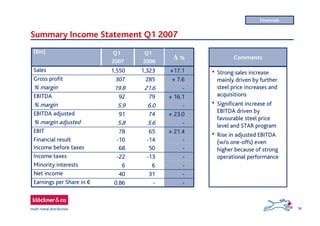

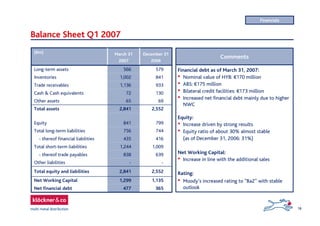
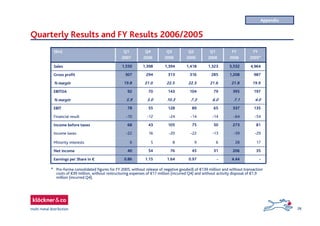


This document provides an overview of Klöckner & Co, a leading steel and metal distributor. Some key points: - Klöckner & Co operates distribution networks in Europe and North America with 240 warehouses and over 10,000 employees. - In 2006, sales were €5.5 billion with EBITDA of €395 million. - The company sources metals from global suppliers and provides products, value-added services, and efficient distribution to over 200,000 customers. - The strategy focuses on profitable growth through acquisitions, organic expansion, and optimization programs to improve purchasing, distribution, and inventory management.


