Kinematics 2011 part2
•
0 likes•766 views

The document provides information about displacement-time graphs and velocity-time graphs including: 1) Examples of different types of displacement-time and velocity-time graphs showing various motions like constant velocity, acceleration, deceleration, and vertical motion. 2) Definitions of velocity, acceleration, and the relationships between the gradients of the graphs and these quantities. 3) Kinematics equations for uniformly accelerated motion derived from the area under the velocity-time graph.

Recommended
More Related Content
Viewers also liked
More from Catherine He
Recently uploaded
Recently uploaded (20)
Kinematics 2011 part2
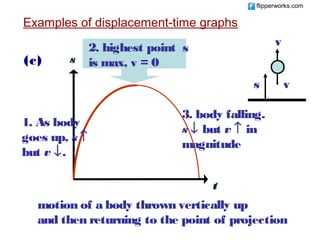
- 1. flipperworks.com Examples of displacement-time graphs K v 2. highest point s i (c) s is max, v = 0 n s v e m 3. body falling. 1. As body a goes up, s ↑ s ↓ but v ↑ in t but v ↓. magnitude i c t s motion of a body thrown vertically up and then returning to the point of projection
- 2. flipperworks.com Velocity and Acceleration Definition Graphically Velocity Rate of ds Gradient of s-t change of v= graph displacement dt Acceleration Rate of Gradient of v-t dv change of velocity a= graph dt
- 3. flipperworks.com K [b] Velocity-time graph i n shows the velocity of a body at any e instant of time. t i the gradient of the graph is the c instantaneous acceleration of the body. s the area under the graph is the displacement of the body.
- 4. flipperworks.com v B C A Area = A1 O E H t Area = A2 D F G v (+ve when pointing to the right) O
- 5. flipperworks.com v B C A Area = A1 O E H t Area = A2 D F G O to A v increases from zero at constant rate ⇒ body is moving from rest with uniform acceleration
- 6. flipperworks.com v B C A Area = A1 O E H t Area = A2 D F G A to B v increasing but gradient decreasing ⇒ body continues to move faster but with decreasing acceleration.
- 7. flipperworks.com v B C A Area = A1 O E H t Area = A2 D F G B to C v remains constant ⇒ zero acceleration
- 8. flipperworks.com v K B C i A n Area = A1 e E H O t m D Area = A2 c F G s C to D v decreases at a constant rate but still positive ⇒ acceleration is constant but negative i.e. constant deceleration.
- 9. flipperworks.com v B C A Area = A1 O E H t Area = A2 D F G D to E v = 0 ⇒ body is stationary
- 10. flipperworks.com v Q: At time F, is B C displacement of car A negative? Area = A1 O E H t Area = A2 D F G E to F v negative but magnitude is increasing at constant rate ⇒ body is moving in opposite direction and speeds up ⇒ uniform negative acceleration.
- 11. flipperworks.com v Q: At time F, is B C displacement of car A negative? Area = A1 O E H t Area = A2 D F G v (+ve when pointing to the right) O A B C D HG F E
- 12. flipperworks.com v K B C i A n Area = A1 e E H O t a D Area = A2 t F G i c F to G s v remains constant
- 13. flipperworks.com v B C A Area = A1 O E H t Area = A2 D F G G to H v is negative but acceleration is positive ⇒ constant deceleration. Body slows down and comes to rest at H
- 14. flipperworks.com v B C A Area = A1 O E H t Area = A2 D F G Total distance moved = A1 + A2 Net displacement = A1 - A2
- 15. flipperworks.com Examples of velocity-time graphs (a) v (b) v 2 3 1 t t line 1: uniform velocity increasing acceleration line 2: uniform acceleration line 3: uniform deceleration
- 16. flipperworks.com Q: Can it be ball thrown v upwards, hitting ceiling (c) and bouncing back? 0 t Ball, released from rest at a certain height, hitting the floor and bouncing back
- 17. flipperworks.com (c) + v v2 g 0 t v2 -v1 v1 free fall ⇒ acceleration = gradient = -g
- 18. flipperworks.com Example 2: v/ s-1 m Velocity after 10 s = 0.80 x 10 = 8.0 m s-1 8.0 total distance travelled = area under graph = ½(20 +30) 8.0 t/ s = 200 m 0 10 30
- 19. flipperworks.com Example 3: The graph shows the variation with time of the velocity of a trolley, initially projected up an inclined runway. Velocity/m s-1 0.8 0.6 0.4 0.2 θ 0 Time/ s -0.2 -0.4 -0.6 -0.8
- 20. flipperworks.com (a) maximum distance = area under v-t graph between t = 0 & t = 2.5 s = ½ × 0.80 × 2.5 = 1.0 m Velocity/m s-1 0.8 0.6 0.4 Trolley reaches 0.2 max. distance 0 Time/ velocity = 0 when s -0.2 -0.4 -0.6 -0.8
- 21. flipperworks.com (b) a = gradient of v-t graph 0.00 - 0.80 = = - 0.32 m s-2 2.5 - 0.0 ∴ deceleration = 0.32 m s-2 Velocity/m s-1 0.8 0.6 0.4 0.2 0 Time/ s -0.2 -0.4 -0.6 -0.8
- 22. flipperworks.com (c) displacement = total area under graph = 1.0 + (-1.0) =0m Velocity/m s-1 0.8 0.6 0.4 0.2 +1.0 0 Time/ s -0.2 -0.4 -1.0 -0.6 -0.8
- 23. flipperworks.com (d) Trolley travels 1.0 m up the runway with uniform deceleration, stops momentarily at t = 2.5 s and then accelerates uniformly down the runway. Velocity/m s-1 0.8 0.6 0.4 0.2 0 Time/ s -0.2 -0.4 -0.6 -0.8
- 24. flipperworks.com Displacement Speed Velocity Acceleration Average speed Average velocity WORDS & TERMS KINEMATICS EQUATIONS GRAPHS
- 25. flipperworks.com Equations representing uniformly accelerated motion in a straight line Suppose that a body is moving with constant acceleration a and that in a time interval t, its velocity increases from u to v and its displacement increases from 0 to s . v u 0 t Since a = d v / d t ⇒ a = v - u t Hence v = u + at -------------- (1)
- 26. flipperworks.com Since velocity increases steadily, u+v average velocity, < v > = 2 Recall: displacement, s = average velocity × time Thus, s = ½ (u + v) t ------------- (2) Substituting (1) into (2), s = ut + ½ at2 -------------- (3)
- 27. flipperworks.com v -u From (1), t = a Substituting this into (2), u+v v -u s = × 2 a Therefore v 2 = u 2 + 2 a s -------- (4)
- 28. flipperworks.com Kinematics equations for uniformly accelerated motion in a straight line : v = u +at s = ½ (u + v) t recall & derive s = u t + ½ a t2 v2 = u2 + 2 a s Since u, v , a and s are vector quantities, their directions must be taken into account when solving problems.
- 29. flipperworks.com Sign Conventions Eg. A ball is released from a certain height. Starting + position s is -ve a is -ve v is -ve