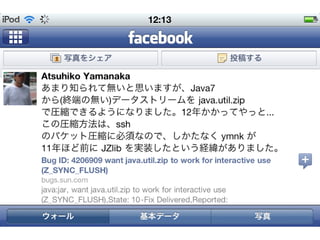
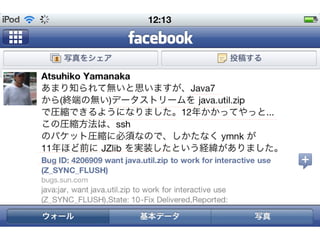
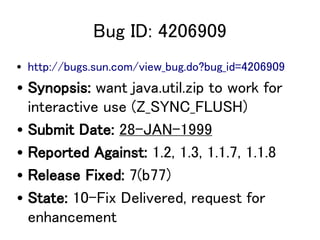
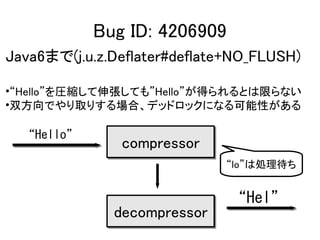
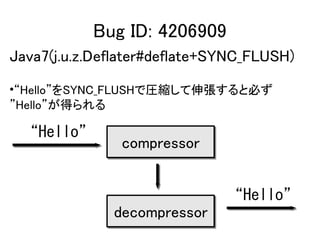
Bug ID: 4206909
•http://bugs.sun.com/view_bug.do?bug_id=4206909
• Synopsis: want java.util.zip to work for
interactive use (Z_SYNC_FLUSH)
• Submit Date: 28-JAN-1999
• Reported Against: 1.2, 1.3, 1.1.7, 1.1.8
• Release Fixed: 7(b77)
• State: 10-Fix Delivered, request for
enhancement
10.
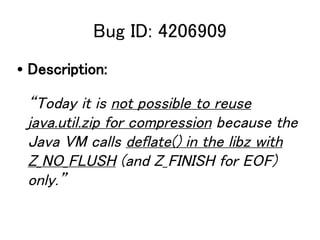
Bug ID: 4206909
•Description:
“Today it is not possible to reuse
java.util.zip for compression because the
Java VM calls deflate() in the libz with
Z_NO_FLUSH (and Z_FINISH for EOF)
only.”
11.
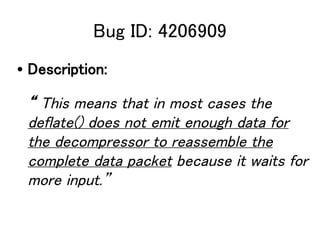
Bug ID: 4206909
•Description:
“ This means that in most cases the
deflate() does not emit enough data for
the decompressor to reassemble the
complete data packet because it waits for
more input.”
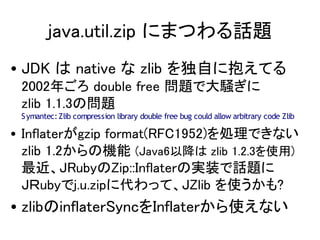
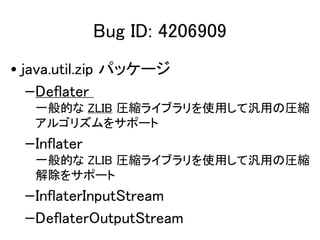
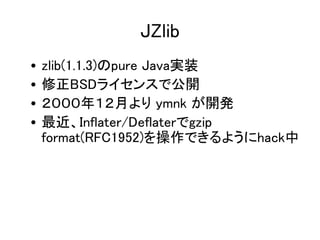
JZlib
• 開発の動機
SSHのパケット圧縮[RFC4253]実現のため
“The 'zlib' compression is described in
[RFC1950] and in [RFC1951].The
compression context is initialized after each
key exchange, and is passed from one packet
to the next, with only a partial flush being
performed at the end of each packet. “
20.
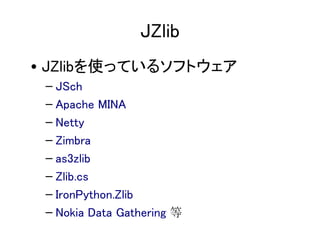
JZlib
• JZlibを使っているソフトウェア
–JSch
– Apache MINA
– Netty
– Zimbra
– as3zlib
– Zlib.cs
– IronPython.Zlib
– Nokia Data Gathering 等
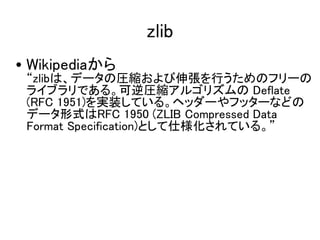
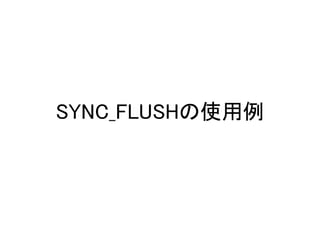
SYNC_FLUSHの使用例
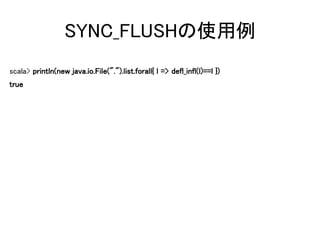
scala> val defl_infl= {
import java.util.zip._
val (defl, infl, buf) = (new Deflater, new Inflater, new Array[Byte](100))
def f(in: String): String = synchronized {
in.getBytes match {
case result =>
defl.setInput(result)
defl.deflate(buf, 0, buf.length, Deflater.SYNC_FLUSH) match{
case l => l は buf に書き出された圧縮データのサイズ
//
infl.setInput(buf, 0, l)
val len = infl.inflate(result, 0, result.length)
new String(result, 0, len)
}}} // ちゃんと実装するには、中間バッファ(buf)の溢れに注意
f_ // また、伸張後のバッファ溢れにも注意すべき
}


![JZlib
• 開発の動機
SSHのパケット圧縮[RFC4253]実現のため
“The 'zlib' compression is described in
[RFC1950] and in [RFC1951].The
compression context is initialized after each
key exchange, and is passed from one packet
to the next, with only a partial flush being
performed at the end of each packet. “](https://image.slidesharecdn.com/jzlibandafixedbuginjava7-110904033119-phpapp01/85/JZlib-and-an-aged-fixed-bug-in-java7-19-320.jpg)

)
def f(in: String): String = synchronized {
in.getBytes match {
case result =>
defl.setInput(result)
defl.deflate(buf, 0, buf.length, Deflater.SYNC_FLUSH) match{
case l => l は buf に書き出された圧縮データのサイズ
//
infl.setInput(buf, 0, l)
val len = infl.inflate(result, 0, result.length)
new String(result, 0, len)
}}} // ちゃんと実装するには、中間バッファ(buf)の溢れに注意
f_ // また、伸張後のバッファ溢れにも注意すべき
}](https://image.slidesharecdn.com/jzlibandafixedbuginjava7-110904033119-phpapp01/85/JZlib-and-an-aged-fixed-bug-in-java7-27-320.jpg)