Download as PDF, PPTX


![27Copyright © 2015 JX Holdings, Inc.
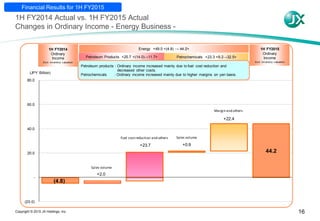
Key Factors
*1 Crude oil arrival basis
*2 Due to a change of fiscal term, referring terms are different. 2014 1Q: Jan.-Mar., 1H: Jan.-Jun., Full Year: Jan.-Dec.; 2015 1Q: Apr.-Jun., 1H: Apr.-Sep., Full Year: Apr.-Mar.
*3 Production of companies closing in Dec., 1Q: Jan.-Mar., 1H: Jan.-Jun., Full Year: Jan.-Dec.; closing in Mar., 1Q: Apr.-Jun., 1H: Apr.-Sep., Full Year: Apr.-Mar.
Reference
1Q 1H Full Year 1Q 1H Full Year
Actual Actual Actual Actual
Exchange rate [Yen/$] 102 103 110 121 122 121
Crude oil price [Dubai][Apri.-Mar.]*1 [$/bbl] 105 105 88 59 57 53
Sales volume <Crude oil equivalent> [1,000 bbl/day] 115 112 115 113 116 125
Crude oil price [Brent] [Jan.-Dec.] [$/bbl] 108 109 99 54 58 55
Metals Copper price [LME] *2 [¢/lb] 319 314 311 275 256 243
Equity entitled copper mine production *3 [1,000 tons/period ・year] 33 65 148 39 81 206
PPC copper cathode sales [1,000 tons/period ・year] 152 307 623 144 308 597
Treated rolled copper foil sales [1,000 km/month] 4.0 4.0 4.1 5.0 5.1 4.7
Precision rolled products sales [1,000 tons/month] 3.7 3.8 3.8 3.7 3.8 3.9
Gold recovery volume by Recycling & Environmental Services [tons/period ・year] 1.3 3.0 5.9 1.6 3.5 6.6
FY2014 FY2015
Actual Forecast
(announced in Nov.)
All segments
Energy
Oil and
Natural Gas
E&P](https://image.slidesharecdn.com/jxpresentation-151203100514-lva1-app6891/85/Jx-presentation-28-320.jpg)


- Ordinary income decreased from 71.6 billion yen in the first half of fiscal year 2014 to a loss of 27.7 billion yen in the first half of fiscal year 2015 due to inventory valuation losses from falling crude oil prices. - Excluding inventory valuation effects, ordinary income increased from 71.6 billion yen to 91 billion yen due to improved performance in petrochemicals and metals businesses, despite declines in oil and gas exploration and petroleum products. - Revenue decreased 16% to 4,552.6 billion yen as crude oil prices and the yen's strength negatively impacted performance.


